. 2016 Feb 19:5:e10051.
doi: 10.7554/eLife.10051.

Stepwise nucleosome translocation by RSC remodeling complexes

Affiliations

Stepwise nucleosome translocation by RSC remodeling complexes

Bryan T Harada et al. Elife. .

Abstract

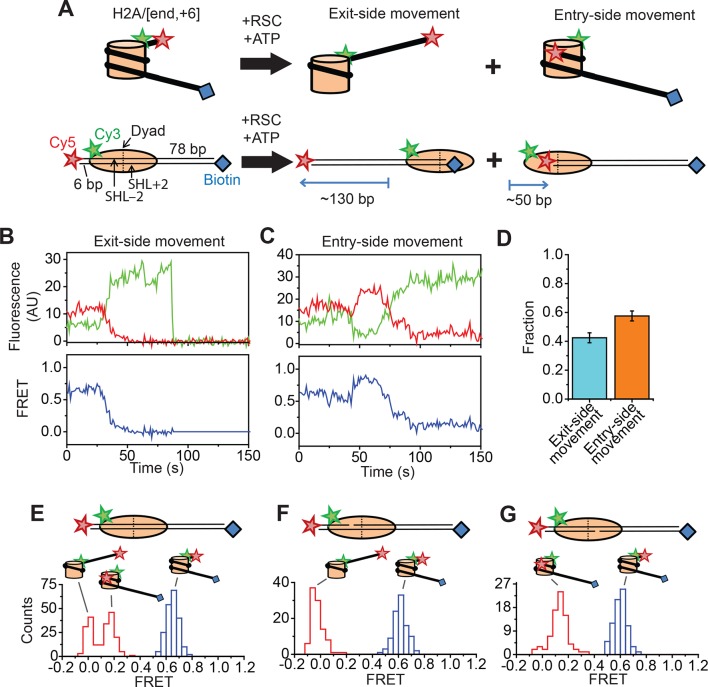
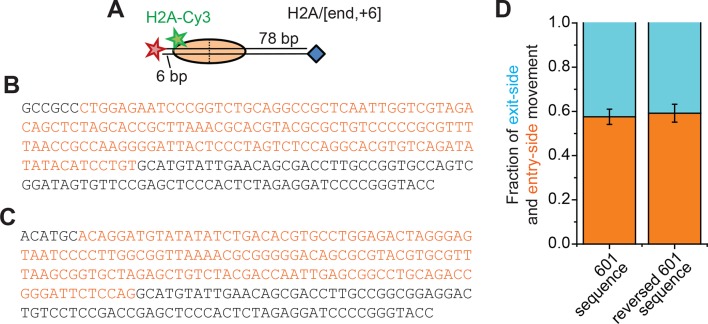
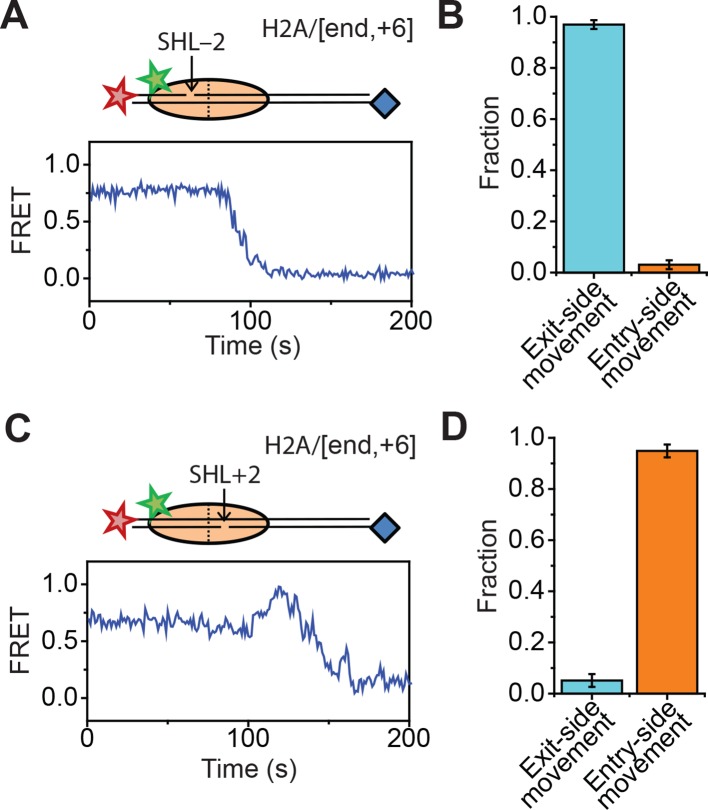
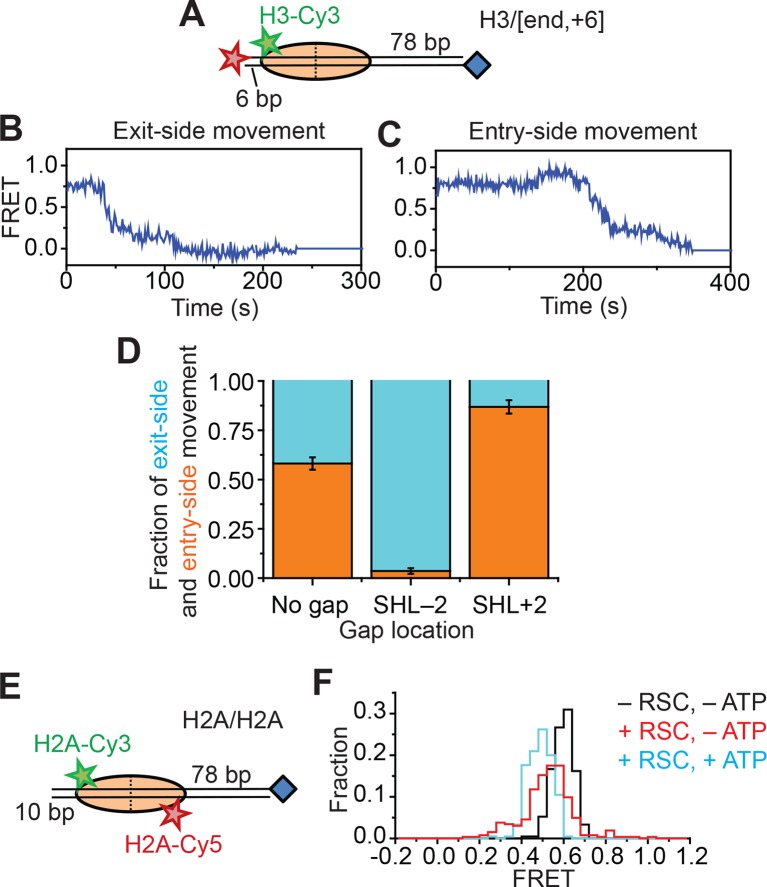
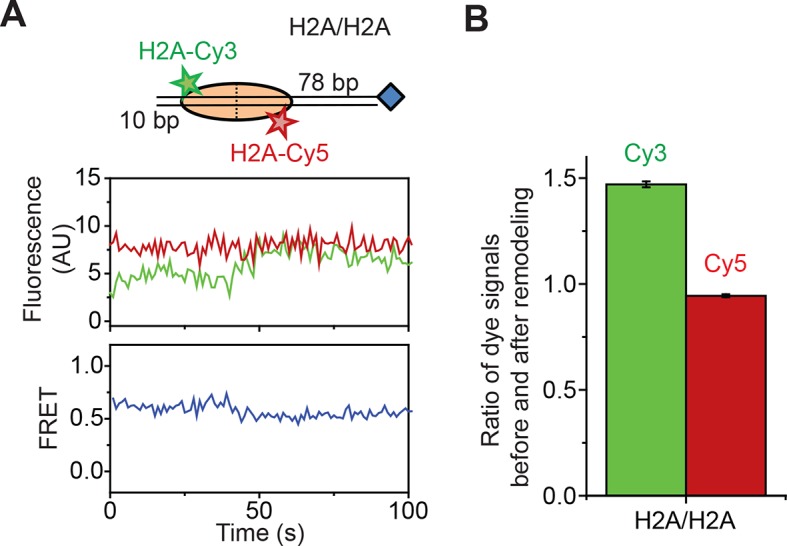
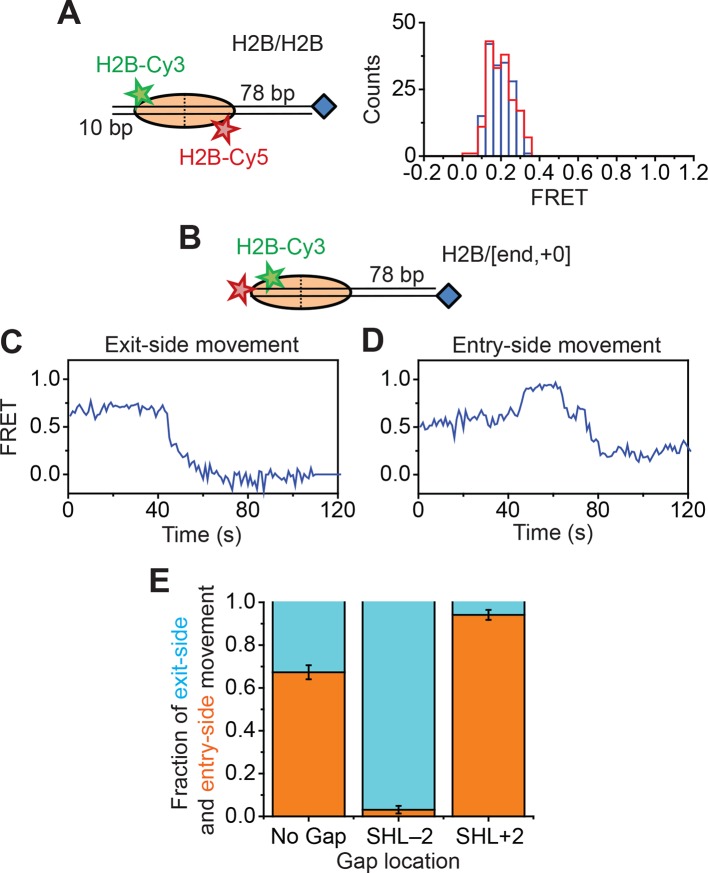
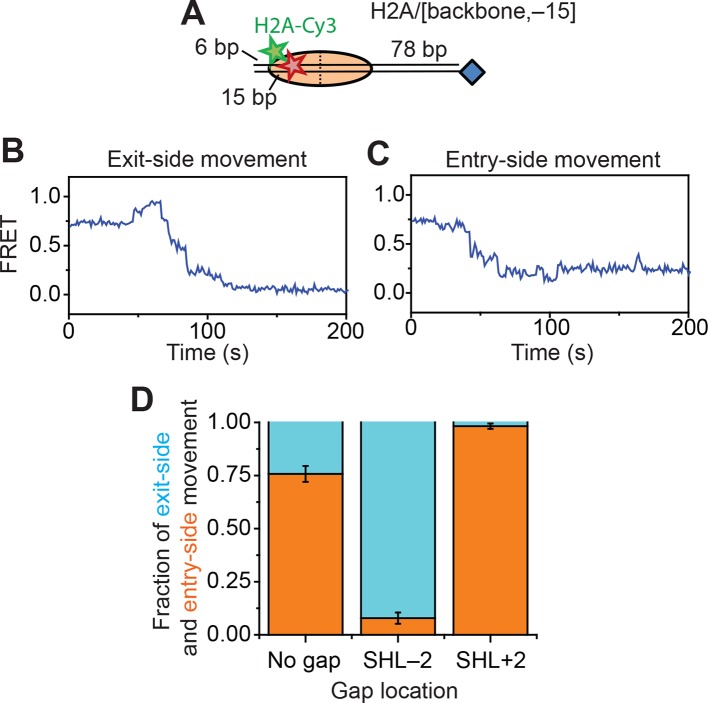
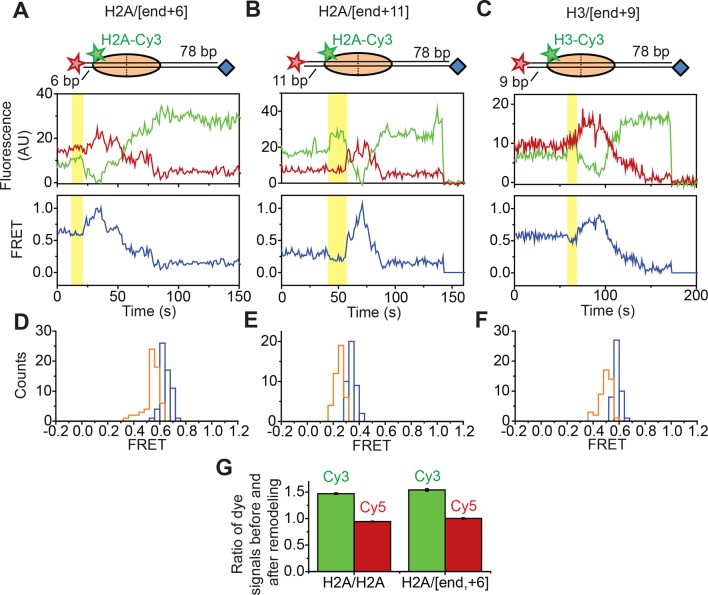
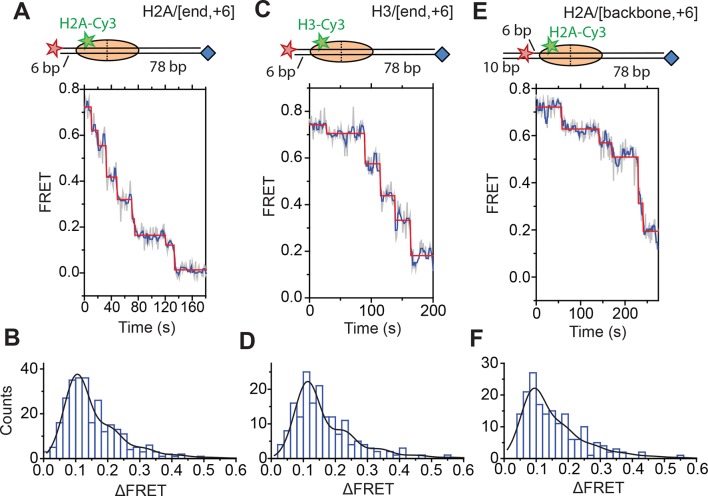
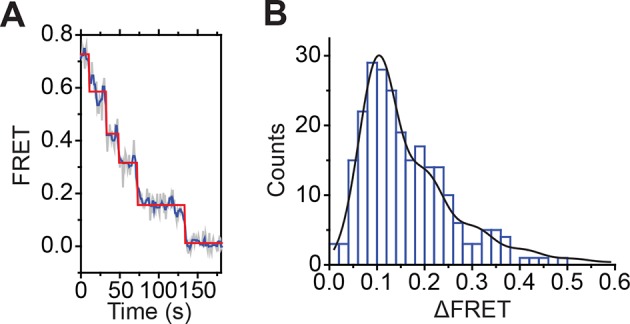
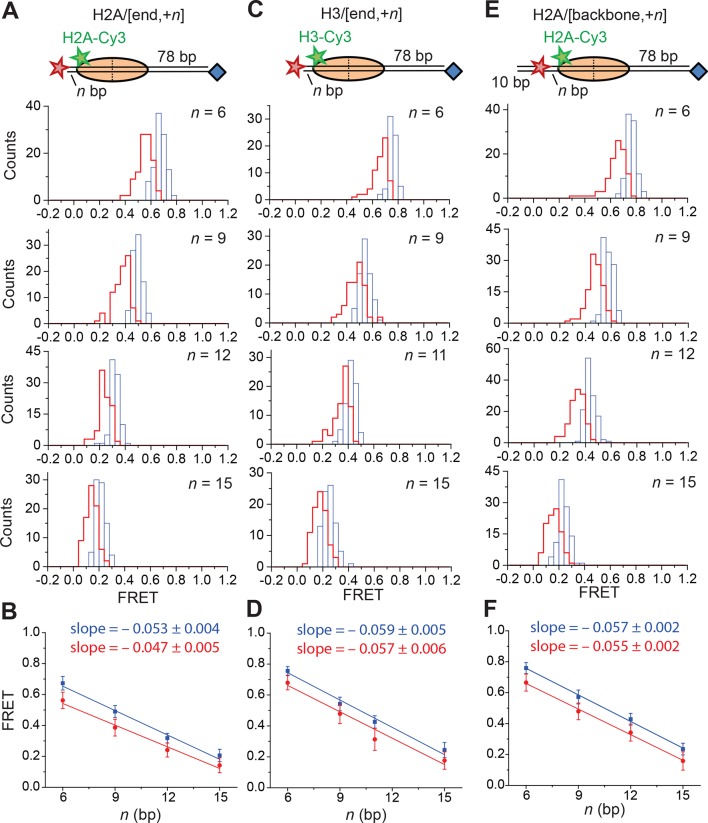
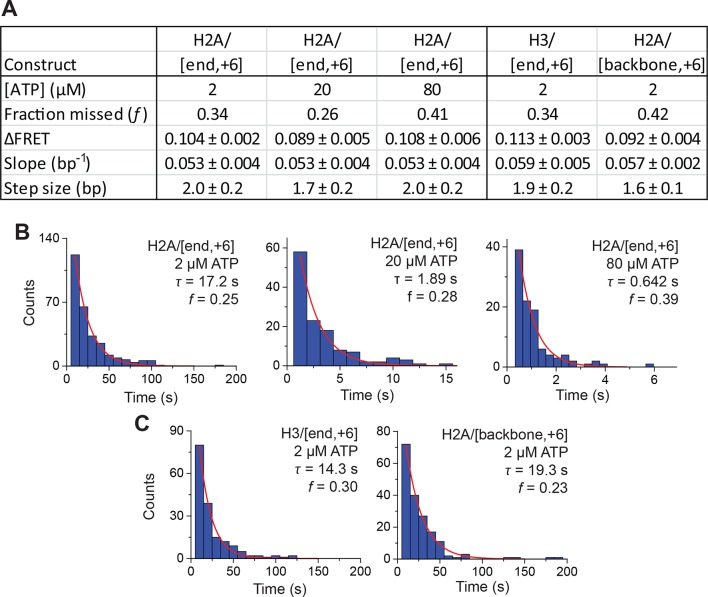
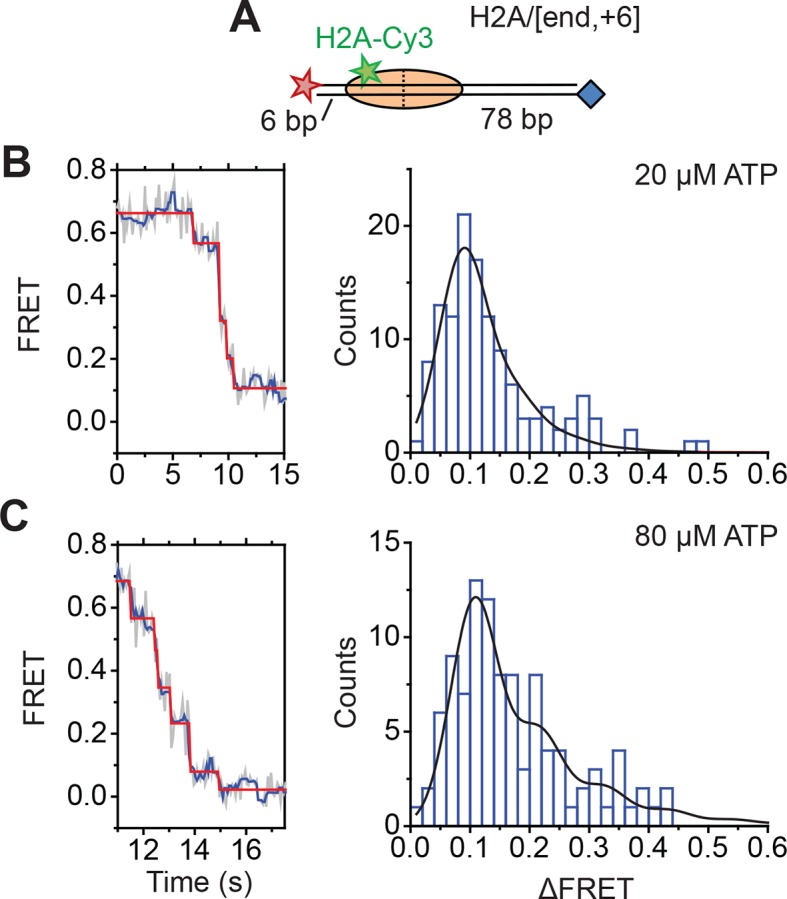
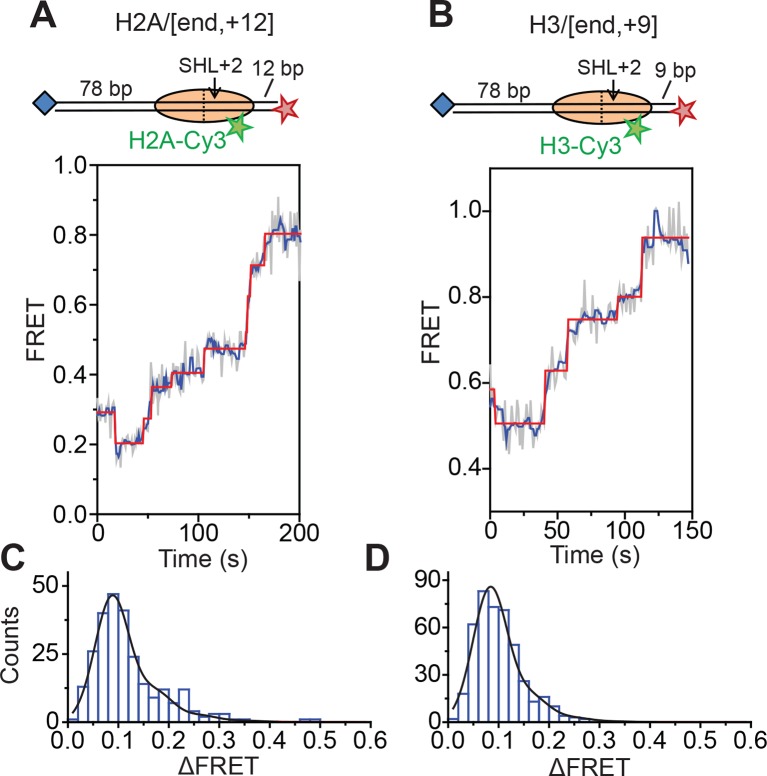
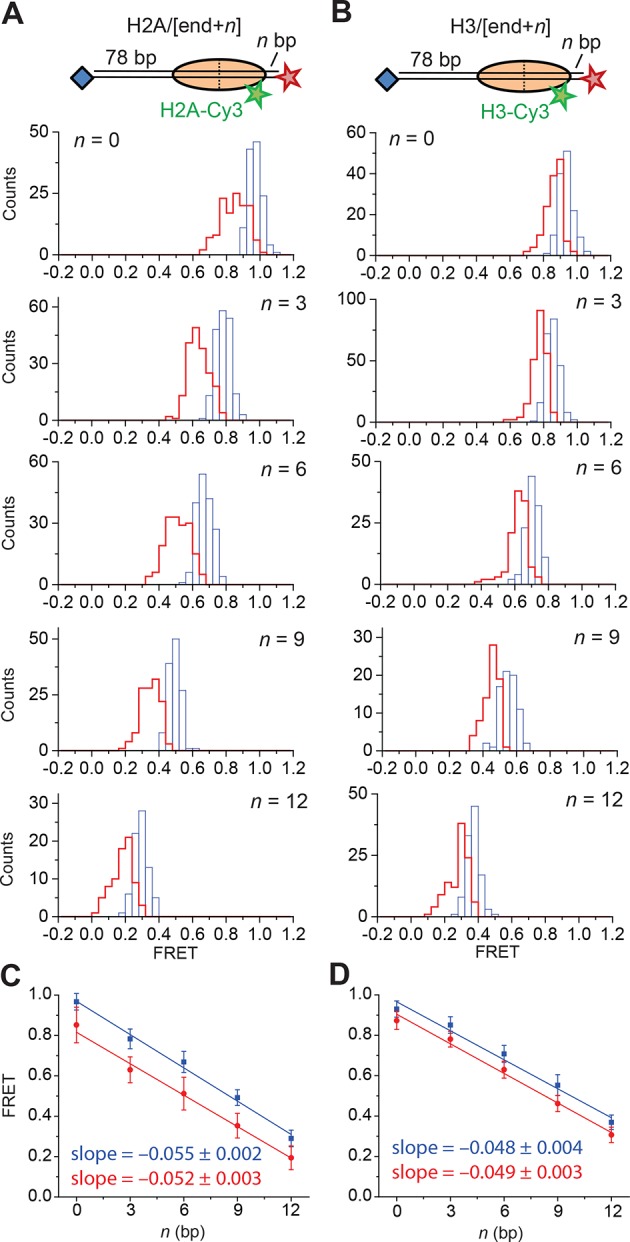
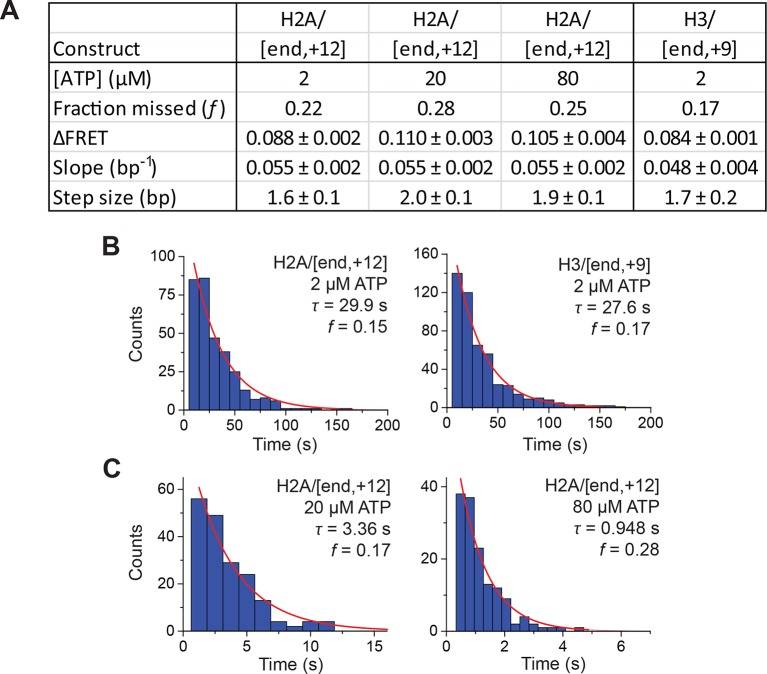
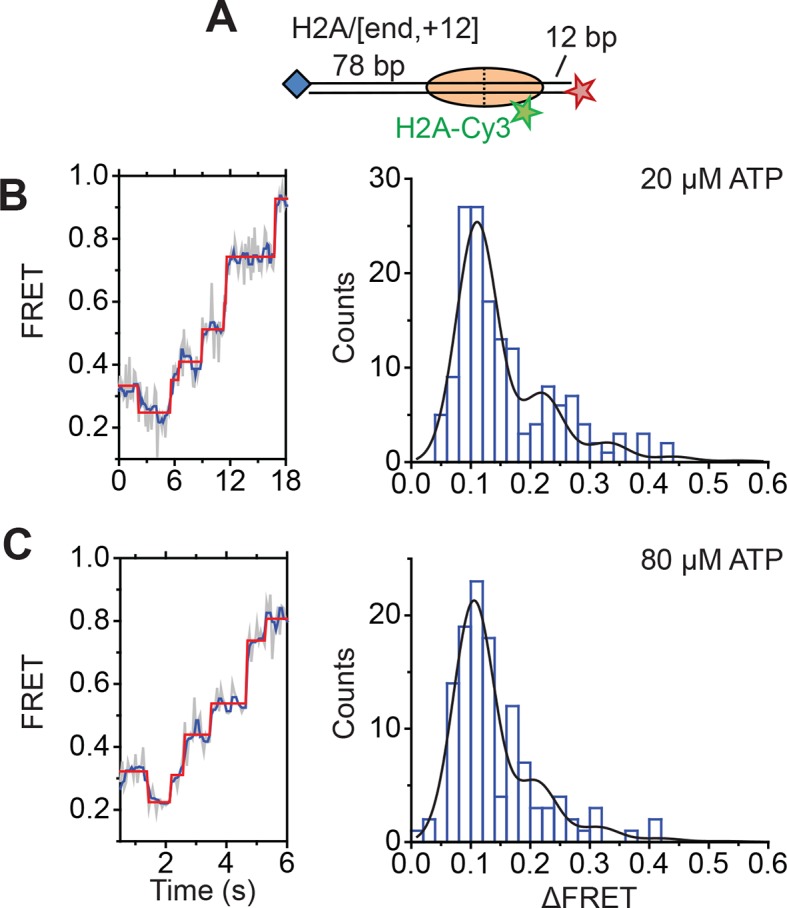
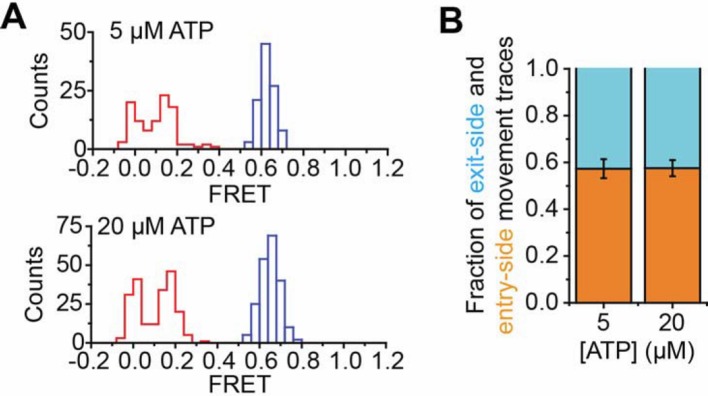
The SWI/SNF-family remodelers regulate chromatin structure by coupling the free energy from ATP hydrolysis to the repositioning and restructuring of nucleosomes, but how the ATPase activity of these enzymes drives the motion of DNA across the nucleosome remains unclear. Here, we used single-molecule FRET to monitor the remodeling of mononucleosomes by the yeast SWI/SNF remodeler, RSC. We observed that RSC primarily translocates DNA around the nucleosome without substantial displacement of the H2A-H2B dimer. At the sites where DNA enters and exits the nucleosome, the DNA moves largely along or near its canonical wrapping path. The translocation of DNA occurs in a stepwise manner, and at both sites where DNA enters and exits the nucleosome, the step size distributions exhibit a peak at approximately 1-2 bp. These results suggest that the movement of DNA across the nucleosome is likely coupled directly to DNA translocation by the ATPase at its binding site inside the nucleosome.

Keywords: FRET; RSC; S. cerevisiae; SWI/SNF; biochemistry; biophysics; chromatin; remodeling; single-molecule; structural biology.


Conflict of interest statement

XZ: Reviewing editor, eLife.

The other authors declare that no competing interests exist.

Figures

Figure 1.
Figure 1.. Single-molecule FRET assay for monitoring nucleosome translocation by RSC.
(A) Diagram depicting the nucleosome substrates before and after remodeling by RSC. The top row depicts the nucleosomes in cartoon form while the bottom row shows the footprint of the histone octamer (tan oval) on the DNA (black lines). (B and C) Representative traces showing the Cy3 intensity (green), Cy5 intensity (red), and FRET value (blue) for exit-side movement (B) and entry-side movement (C). [RSC] = 5 nM, [ATP] = 5 µM. (D) The fraction of exit-side movement (cyan) and entry-side movement (orange) traces observed with 1 nM RSC and 20 µM ATP. Error bars represent the standard error from > 200 nucleosomes. (E–G) Histograms of the distribution of initial (before remodeling, blue) and final (after remodeling, red) FRET values of remodeling traces from nucleosomes lacking any ssDNA gap (E), nucleosomes with a 2-nt ssDNA gap at the SHL–2 site (F), and nucleosomes with a 2-nt ssDNA gap at the SHL+2 site (G). [RSC] = 1 nM, [ATP] = 20 µM. DOI: http://dx.doi.org/10.7554/eLife.10051.003
Figure 1—figure supplement 1.
Figure 1—figure supplement 1.. Remodeling of nucleosomes with a reversed 601 positioning sequence.
(A) Cartoon of the H2A/[end,+6] nucleosome construct (B) Sequence of the top strand of the DNA molecule used for the H2A/[end,+6] nucleosomes with the 601 positioning sequence shown in orange. (C) Sequence of the top strand of the DNA molecule in which the orientation of the 601 positioning sequence (orange) has been reversed. (D) The fraction of exit-side movement (cyan) and entry-side movement (orange) traces observed when remodeling nucleosomes with the DNA containing the 601 sequence from panel B (reproduced from Figure 1D for comparison) or the DNA sequence from panel C containing the reversed 601 positioning sequence. [RSC] = 1 nM, [ATP] = 20 µM. Error bars represent the standard error from > 100 nucleosomes. DOI: http://dx.doi.org/10.7554/eLife.10051.004
Figure 1—figure supplement 2.
Figure 1—figure supplement 2.. Surface anchoring of the nucleosomes does not affect the kinetics of remodeling.
Comparison of the average remodeling kinetics for freely diffusing nucleosomes in the absence (grey, ensemble assay) or presence of ATP (black, ensemble assay), and surface-tethered nucleosomes in the presence of ATP (red, single-molecule assay). The remodeling kinetics were monitored by reading the Cy5 intensity over time and normalizing the initial and steady-state values to 1 and 0, respectively. The Cy5 intensities in the single-molecule assay were determined by summing the Cy5 signals from ~2000 single-nucleosome traces. [RSC] = 6 nM, [ATP] = 20 µM. DOI: http://dx.doi.org/10.7554/eLife.10051.005
Figure 1—figure supplement 3.
Figure 1—figure supplement 3.. Locations of the 2-nt ssDNA gaps in the DNA sequence.
The sequence of the DNA used for the top and bottom strands of the H2A/[end,+6] and H3/[end,+6] nucleosomes is shown with the 601 positioning sequence colored orange. To create a gap at the SHL–2 site, the underlined nucleotides in the top strand were replaced with a 2-nt gap. To create a gap at the SHL+2 site, the underlined nucleotides in the bottom strand were replaced with a 2-nt gap. RSC translocates on DNA with a 3’→5’ polarity (Saha et al., 2005), and the gaps are positioned to prevent translocation in that direction. However, it has been previously shown that gaps in either strand prevent DNA translocation by RSC (Saha et al., 2005). DOI: http://dx.doi.org/10.7554/eLife.10051.006
Figure 1—figure supplement 4.
Figure 1—figure supplement 4.. Effects of 2-nt ssDNA gaps at the SHL ± 2 sites on the direction of nucleosome translocation.
(A and C) Top: cartoon of the H2A/[end+6] nucleosome with a 2-nt ssDNA gap at the SHL–2 site (A) or SHL+2 site (C). Bottom: Representative FRET traces from the remodeling of constructs with a gap at the SHL–2 site (A) and SHL+2 site (C). [RSC] = 1 nM, [ATP] = 5 µM. (B and D) The fraction of traces showing exit-side movement (cyan) and entry-side movement (orange) observed during the remodeling of constructs with a gap at the SHL–2 (B) or SHL+2 (D) sites. Error bars represent the standard error from > 100 nucleosomes per construct. [RSC] = 1nM, [ATP] = 20µM. DOI: http://dx.doi.org/10.7554/eLife.10051.007
Figure 2.
Figure 2.. Single-molecule FRET assay for probing the displacement of the H2A-H2B dimer during RSC-mediated nucleosome remodeling.
(A) Diagram of the H3/[end,+6] nucleosome. (B and C) Representative FRET traces reflecting the exit-side movement (B) and entry-side movement (C) of the H3/[end,+6] nucleosomes. [RSC] = 1 nM, [ATP] = 2 µM. (D) Fraction of traces showing entry-side movement (orange) and exit-side movement (cyan) observed with 1 nM RSC and 20 µM ATP for nucleosomes lacking any ssDNA gap, nucleosomes with a 2-nt ssDNA gap at the SHL–2 site, and nucleosomes with a 2-nt ssDNA gap at the SHL+2 site. Error bars represent the standard error from > 100 nucleosomes per construct. (E) Diagram of the H2A/H2A nucleosomes. (F) Histogram of the FRET values from the H2A/H2A nucleosomes in the absence of RSC (black), after the addition of 6 nM RSC (red), or after the addition of 6 nM RSC and 5 µM ATP (cyan). Histograms were constructed from >200 nucleosomes per condition. DOI: http://dx.doi.org/10.7554/eLife.10051.008
Figure 2—figure supplement 1.
Figure 2—figure supplement 1.. Remodeling of the H2A/H2A construct by RSC.
(A) Top: Cartoon of the H2A/H2A nucleosome construct. Bottom: Representative Cy3 intensity, Cy5 intensity, and FRET traces when H2A/H2A nucleosomes are incubated with 6 nM RSC and 5 µM ATP. (B) The mean ratio of the Cy3 signals before and after remodeling (green) and the mean ratio of the Cy5 signals before and after remodeling (red). Error bars represent the SEM from >100 nucleosomes. DOI: http://dx.doi.org/10.7554/eLife.10051.009
Figure 2—figure supplement 2.
Figure 2—figure supplement 2.. Remodeling of nucleosomes labeled in the globular domain of histone H2B.
(A) Left: diagram of the H2B/H2B nucleosomes. Right: histogram of the FRET values from H2B/H2B nucleosomes before (blue) and after (red) the addition of 6 nM RSC and 5 µM ATP. (B) Cartoon of the H2B/[end,+0] nucleosome construct. (C and D) Representative FRET traces showing H2B/[end,+0] nucleosomes undergoing exit-side movement (C) and entry-side movement (D). [RSC] = 1 nM, [ATP] = 5 µM. (E) Fraction of traces showing entry-side and exit-side movement observed with 1 nM RSC, and 20 µM ATP for nucleosomes lacking any ssDNA gap, nucleosomes with a 2-nt ssDNA gap at the SHL–2 site, and nucleosomes with a 2-nt ssDNA gap at the SHL+2 site. Error bars represent the standard error from > 90 nucleosomes per condition. DOI: http://dx.doi.org/10.7554/eLife.10051.010
Figure 3.
Figure 3.. Assay for probing DNA unwrapping at the nucleosomal edge where DNA exits the nucleosome.
(A) Diagram of the H2A/[backbone,–15] nucleosome construct. (B and C) Representative FRET traces showing exit-side movement (B) and entry-side movement (C). [RSC] = 1 nM, [ATP] = 5 µM. (D) The fraction of entry-side movement (orange) and exit-side movement (cyan) traces observed with 1 nM RSC and 20 µM ATP for nucleosomes lacking any ssDNA gap, nucleosomes with a 2-nt ssDNA gap at the SHL–2 site, and nucleosomes with a 2-nt ssDNA gap at the SHL+2 site. Error bars represent the standard error from >100 nucleosomes per construct. DOI: http://dx.doi.org/10.7554/eLife.10051.011
Figure 3—figure supplement 1.
Figure 3—figure supplement 1.. Assays for probing DNA unwrapping at the nucleosomal edge where DNA enters the nucleosome.
(A–C) Top: cartoons representing the H2A/[end,+6] (A), H2A/[end,+11] (B), and H3/[end,+9] (C) constructs used in each experiment. Bottom: Representative Cy3 intensity, Cy5 intensity, and FRET time traces showing entry-side movement. The region showing the transient FRET decrease is highlighted in yellow. [RSC] = 1 nM, [ATP] = 5 µM. (DF) Histograms showing the starting FRET (blue) and FRET during the transient FRET decrease (orange) for the H2A/[end,+6] (D), H2A/[end,+11] (E), and H3/[end,+9] (F) constructs. (G) The mean ratio of the Cy3 signals before and after the transient FRET decrease (green) and the mean ratio of the Cy5 signals before and after the transient FRET decrease (red) for the H2A/[end,+6] construct. The data for the H2A/H2A constructs from Figure 2—figure supplement 1B are replotted for comparison. Error bars represent the SEM from >100 nucleosomes per construct. DOI: http://dx.doi.org/10.7554/eLife.10051.012
Figure 4.
Figure 4.. DNA exits the nucleosome in a stepwise manner, exhibiting a step size distribution peaked at ~1–2 bp during RSC-mediated remodeling.
Remodeling was monitored for H2A/[end,+6] (A and B), H3/[end,+6] (C and D), and H2A/[backbone,+6] (E and F) nucleosome constructs. (A, C, and E) Top: diagram of the nucleosome construct used. Bottom: Representative exit-side movement traces in the presence of 5 nM RSC and 2 µM ATP at 20°C. Light grey, raw FRET data; blue, 5-point median-filtered data; red, fit by a step-finding algorithm based on Chi-square minimization. (B, D, and F) Histograms of the measured step sizes in FRET change (blue bars) and the fit to the modeled step size distribution shown in Equation 1 (black line). DOI: http://dx.doi.org/10.7554/eLife.10051.013
Figure 4—figure supplement 1.
Figure 4—figure supplement 1.. Step size determination using a hidden Markov model (HMM)-based step-finding algorithm.
(A) The exit-side movement trace from Figure 4A is reproduced showing the steps identified by the HMM-based step-finding algorithm. Light grey, raw FRET data; blue, 5-point median-filtered data; Red, HMM fit. (B) Histogram of the measured step sizes in FRET change (blue bars) identified by the HMM algorithm and the fit to the modeled step size distribution shown in Equation 1 (black line). DOI: http://dx.doi.org/10.7554/eLife.10051.014
Figure 4—figure supplement 2.
Figure 4—figure supplement 2.. Calibration of FRET values as a function of the linker DNA length for constructs monitoring exit-side movement.
(A, C, and E) Distribution of FRET values measured with 5 nM RSC and 2 µM ATP at 20°C for the H2A/[end,+n] (A), H3/[end,+n] (C), and H2A/[backbone,+n] (E) constructs before (blue) and after (red) the first observed step of FRET change. (B, D, and F) Plots of the mean FRET value versus linker DNA length (n) for the H2A/[end,+n] (B), H3/[end,+n] (D), and H2A/[backbone,+n] (F) constructs before (blue) and after (red) the first observed step of FRET change. The mean and standard deviation of each point were obtained by fitting the FRET distributions to a Gaussian curve. The slopes were obtained by linear regression and the error is the standard error. DOI: http://dx.doi.org/10.7554/eLife.10051.015
Figure 4—figure supplement 3.
Figure 4—figure supplement 3.. Analysis of DNA translocation step sizes of exit-side movement.
(A) Table showing the estimated step size ( ± standard error) and fraction of steps missed (f) from fits of the ΔFRET step size histograms in Figure 4 and Figure 4—figure supplement 4 to the stepping model in Equation 1. These ΔFRET values are converted to step sizes in bp by dividing the FRET step sizes by the slopes of the calibration curves in Figure 4—figure supplement 2. (B) Histograms of the observed pause lifetimes for the H2A/[end, +6] construct during RSC-induced remodeling at 2 µM, 20 µM and 80 µM ATP, collected with camera frame rates of 1 Hz, 8 Hz, and 16 Hz, respectively. (C) Histograms of the observed pause lifetimes identified for the H3/[end, +6] and H2A/[backbone, +6] constructs during RSC-induced remodeling at 2 µM ATP. The mean pause lifetime (τ) is estimated by fitting the distribution to an exponential, and the expected fraction of missed events (f) is the fraction of pauses expected to have a pause lifetime < 5 frames (the threshold for detecting a step in the step-size analysis). DOI: http://dx.doi.org/10.7554/eLife.10051.016
Figure 4—figure supplement 4.
Figure 4—figure supplement 4.. Monitoring exit-side DNA motion at higher ATP concentrations.
(A) Cartoon of the H2A/[end,+6] construct used in the experiments. (and C) Analysis of exit-side movement from remodeling of H2A/[end,+6] nucleosomes. Reactions were performed at 20°C in the presence of 5 nM RSC and 20 µM ATP (B) or 5 nM RSC and 80 µM ATP (C). Data were collected at 8 Hz (B) or 16 Hz (C), as opposed to the 1 Hz rate used in the 2 µM ATP experiments. Left: Representative FRET traces. Light grey, raw FRET data; blue, 5-point median-filtered data; red, fit by the step-finding algorithm. Right: Histograms of the measured step sizes in FRET change (blue bars) and the fit to the modeled step size distribution in Equation 1 (black line). DOI: http://dx.doi.org/10.7554/eLife.10051.017
Figure 5.
Figure 5.. DNA enters the nucleosome in a stepwise manner, exhibiting a step size distribution peaked at ~1–2 bp during RSC-mediated remodeling.
Remodeling was monitored for H2A/[end,+12] (A and C), and H3/[end,+9] (B and D) constructs. (A and B) Top: diagram of the nucleosome constructs used. Bottom: Representative entry-side movement traces in the presence of 5 nM RSC and 2 µM ATP at 20°C. Light grey, raw FRET data; blue, 5-point median-filtered data; red, fit by the step-finding algorithm. (C and D) Histograms of the measured step sizes in FRET change (blue bars) and the fit to the modeled step size distribution shown in Equation 1 (black line). DOI: http://dx.doi.org/10.7554/eLife.10051.018
Figure 5—figure supplement 1.
Figure 5—figure supplement 1.. Calibration of FRET values as a function of the linker DNA length for constructs monitoring entry-side movement.
(A and B) Distribution of FRET values before (blue) and after (red) the first observed step of FRET change in the presence of 5 nM RSC and 2µM ATP at 20°C for the H2A/[end,+n] (A) and H3/[end,+n] (B) constructs. (C and D) Plots of the mean FRET versus linker DNA length (n) for the H2A/[end,+n] (C) and H3/[end,+n] (D) constructs before (blue) and after (red) the first observed step of FRET change. The mean and standard deviation for each point were obtained by fitting the FRET distributions to a Gaussian curve. The slopes were obtained by linear regression and the error is the standard error. DOI: http://dx.doi.org/10.7554/eLife.10051.019
Figure 5—figure supplement 2.
Figure 5—figure supplement 2.. Analysis of DNA translocation step sizes of entry-side movement.
(A) Table showing the estimated step size ( ± standard error) and fraction of steps missed (f) from fits of the ΔFRET step size histograms in Figure 5 and Figure 5—figure supplement 3 to the stepping model in Equation 1. These ΔFRET values are converted to step sizes in bp by dividing the FRET step sizes by the slopes of the calibration curves in Figure 5—figure supplement 1. (B) Histograms of the observed pause lifetimes identified by the step-finding algorithm for the H2A/[end, +12] and H3/[end,+9] constructs during RSC-induced remodeling at 2 µM ATP. (C) Histograms of the observed pause lifetimes identified for the H2A/[end, +12] construct during RSC-induced remodeling at 20 and 80 µM ATP. Experiments with 2, 20, and 80 µM ATP were collected with camera frame rates of 1 Hz, 8 Hz, or 16 Hz, respectively. The mean pause lifetime (τ) is estimated by fitting the distribution to an exponential, and the expected fraction of missed events (f) is the fraction of pauses expected to have a pause lifetime < 5 frames (the threshold for detecting a step in the step-size analysis). DOI: http://dx.doi.org/10.7554/eLife.10051.020
Figure 5—figure supplement 3.
Figure 5—figure supplement 3.. Monitoring entry-side DNA motion at higher ATP concentrations.
(A) Cartoon of the H2A/[end,+12] nucleosomes used in the experiments. (B and C) Analysis of entry-side movement from remodeling of H2A/[end,+12] nucleosomes. Reactions were performed at 20°C in the presence of 5 nM RSC and 20 µM ATP (B) or 80 µM ATP (C). Data were collected at 8 Hz (B) or 16 Hz (C), as opposed to the 1 Hz rate used in the 2 µM ATP experiments. Left: Representative FRET traces. Light grey, raw FRET data; blue, 5-point median-filtered data; red, fit by the step-finding algorithm. Right: Histograms of the measured step sizes in FRET change (blue bars) and the fit to the modeled step size distribution in Equation 1 (black line). DOI: http://dx.doi.org/10.7554/eLife.10051.021
Author response image 1. Comparison of remodeling at 5 and 20 µM ATP.
(A) Histogram showing the distribution of FRET values before (blue) and after (red) addition of 1 nM RSC and 5 µM ATP (top) or 1 nM RSC and 20 µM ATP (bottom). The data in the bottom panel are reproduced from Figure 1E for comparison. (B) The fraction of exit-side movement (cyan) and entry-side movement (orange) traces observed with 1 nM RSC and the indicated concentration of ATP on H2A/[end, +6] nucleosomes. Error bars represent the standard error from >100 nucleosomes per construct. The data for the 20 µM ATP condition are reproduced from Figure 1D for comparison. DOI: http://dx.doi.org/10.7554/eLife.10051.022

Similar articles

Cited by

References

    1. Aoyagi S, Narlikar G, Zheng C, Sif S, Kingston RE, Hayes JJ. Nucleosome remodeling by the human SWI/SNF complex requires transient global disruption of histone-DNA interactions. Molecular and Cellular Biology. 2002;22:3653–3662. doi: 10.1128/MCB.22.11.3653-3662.2002. - DOI - PMC - PubMed
    1. Bartholomew B. Regulating the chromatin landscape: structural and mechanistic perspectives. Annual Review of Biochemistry. 2014;83:671–696. doi: 10.1146/annurev-biochem-051810-093157. - DOI - PMC - PubMed
    1. Bazett-Jones DP, Côté J, Landel CC, Peterson CL, Workman JL. The SWI/SNF complex creates loop domains in DNA and polynucleosome arrays and can disrupt DNA-histone contacts within these domains. Molecular and Cellular Biology. 1999;19:1470–1478. doi: 10.1128/MCB.19.2.1470. - DOI - PMC - PubMed
    1. Becker PB, Workman JL. Nucleosome remodeling and epigenetics. Cold Spring Harbor Perspectives in Biology. 2013;5:a017905. doi: 10.1101/cshperspect.a017905. - DOI - PMC - PubMed
    1. Blosser TR, Yang JG, Stone MD, Narlikar GJ, Zhuang X. Dynamics of nucleosome remodelling by individual ACF complexes. Nature. 2009;462:1022–1027. doi: 10.1038/nature08627. - DOI - PMC - PubMed

Publication types

MeSH terms

LinkOut - more resources