. 2016 Mar 22;7(12):14708-26.
doi: 10.18632/oncotarget.7408.

The cancer-testis antigens SPANX-A/C/D and CTAG2 promote breast cancer invasion

Affiliations

The cancer-testis antigens SPANX-A/C/D and CTAG2 promote breast cancer invasion

Erin A Maine et al. Oncotarget. .

Abstract

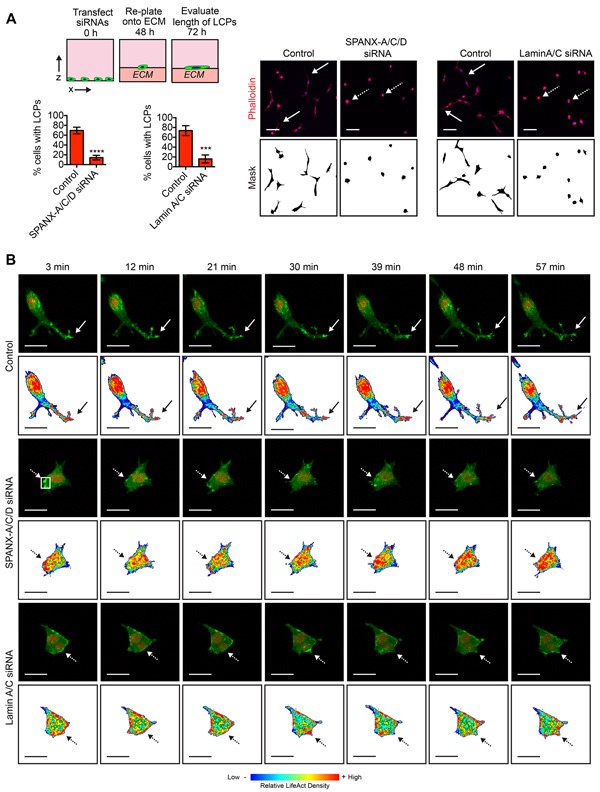
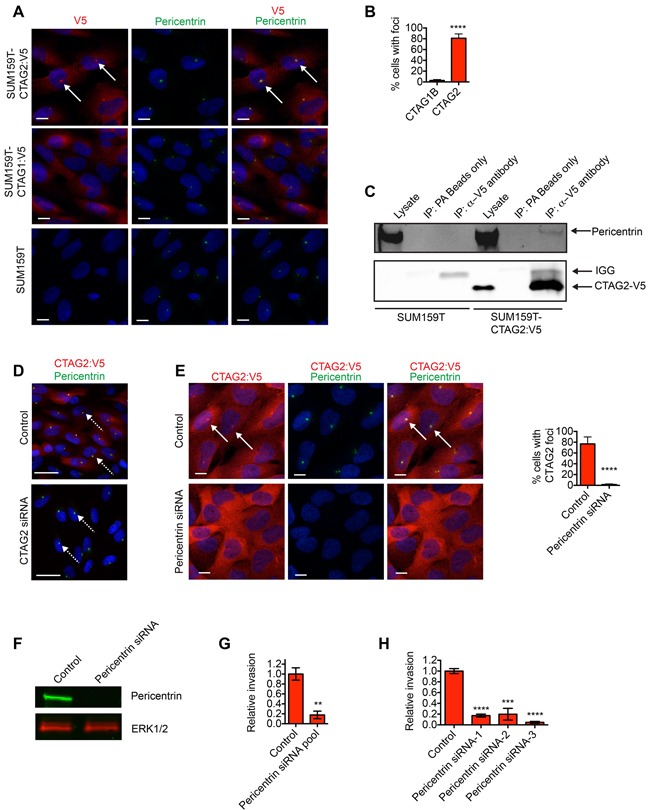
Genes that are normally biased towards expression in the testis are often induced in tumor cells. These gametogenic genes, known as cancer-testis antigens (CTAs), have been extenstively investigated as targets for immunotherapy. However, despite their frequent detection, the degree to which CTAs support neoplastic invasion is poorly understood. Here, we find that the CTA genes SPANX-A/C/D and CTAG2 are coordinately induced in breast cancer cells and regulate distinct features of invasive behavior. Our functional analysis revealed that CTAG2 interacts with Pericentrin at the centrosome and is necessary for directional migration. Conversely, SPANX-A/C/D interacts with Lamin A/C at the inner nuclear membrane and is required for the formation of actin-rich cellular protrusions that reorganize the extracellular matrix. Importantly, SPANX-A/C/D was required for breast cancer cells to spontaneously metastasize to the lung, demonstrating that CTA reactivation can be critical for invasion dependent phenotypes in vivo. Moreover, elevated SPANX-A/C/D expression in breast cancer patient tumors correlated with poor outcome. Together, our results suggest that distinct CTAs promote tumor progression by regulating complementary cellular functions that are integrated together to induce invasive behavior.

Keywords: breast cancer; cancer-testis antigen; extracellular matrix; invasion; metastasis.


Conflict of interest statement

CONFLICTS OF INTEREST

We declare no conflicts of interest.

Figures

Figure 1
Figure 1. CTA expression promotes breast cancer invasion
A. Graphs show the relative invasion of transfected SUM159T cells ≥ 30 μm into the ECM. The number of invasive cells is normalized to the total cell number in the field of view for each condition, which controls for any variations in cell number. Relative invasion equals the normalized invasive value of the cells transfected with the CTA targeting siRNA pool divided by the mean normalized invasion value for “control” cells transfected with a pool of 4 siRNAs that do not target human genes. Mean ± standard deviation (SD) of at least 5 independent experiments is shown. The exact number of independent experiments is indicated above each bar graph. ****p< 0.0001, unpaired Student's t test. Images are representative x-z views of SUM159T invasion into ECM after transfection with the indicated pool of siRNAs. The solid black arrow indicates invading cells. Scale bars, 50 μm. B. Graphs show relative expression of the indicated CTAs as determined by q-PCR in cells transfected as indicated (mean + range, n=2). C. Graphs show the relative invasion of SUM159T cells transfected with individual siRNAs targeting the indicated CTAs ≥30 μm into the ECM. Relative invasion was determined as described for (A). Mean ± SD of 4 biological replicates from 2 independent experiments is shown. * p< 0.05, *** p< 0.001, ****p< 0.0001, unpaired Student's t test. D. Graph shows the relative invasion of transfected 578T cells ≥30 μm into the ECM normalized to the total cell number and compared to control cells as described in (A). Mean ± SD of 4 biological replicates from 2 independent experiments is shown. ****p< 0.0001, unpaired Student's t test. Images are representative x-z views of 578T invasion into the ECM after transfection with the indicated siRNAs. The solid black arrow indicates invading cells. Scale bar, 50 μm.
Figure 2
Figure 2. SPANX-A/C/D interacts with Lamin A/C
A. Cell lysates and associated anti-V5 immunoprecipitates were immunostained with α-V5 and α-Lamin A/C antibodies. Results are representative of 3 independent experiments. B. SUM159T and SUM159T-SPANX-C:V5 cells immunostained with α-V5 antibody and counterstained with Hoechst and phalloidin. Results are representative of 3 independent experiments. Scale bars, 50 μm. C. SUM159T-SPANX-C:V5 cells transfected as indicated were immunostained with α-V5 antibody and counterstained with Hoechst and phalloidin. Arrows indicate punctate localization of SPANXC:V5. Scale bars, 20 μm. Graph shows the percent of cells with ≥ 2 foci of SPANXC:V5 in the nucleus. Mean+ SD of at least 3 fields of view, each containing ≥35 cells, from 2 independent experiments. **p< 0.01, unpaired Student's t test. D. Cell lysates of SUM159T transfected with control or Lamin A/C siRNA pools were immunoblotted with α-Lamin A/C and α-ERK1/2 antibodies. Results are representative of 3 independent experiments. E. Graph shows the relative invasion of transfected SUM159T cells ≥ 30 μm into the ECM. The number of invasive cells is normalized to the total cell number in the field of view for each condition, which controls for any variations in cell number. Relative invasion equals the normalized invasive value of the cells transfected with the siRNA pool targeting Lamin A/C divided by the mean normalized invasion for the “control” cells transfected with a pool of 4 siRNAs that do not target human genes. Mean ± standard deviation (SD) of 4 independent experiments is shown. ****p< 0.0001, unpaired Student's t test. F. Graph shows the relative invasion of SUM159T cells transfected with individual siRNAs targeting Lamin A/C ≥30 μm into the ECM. Relative invasion was determined as described for (E). Mean ± standard error of the mean (SEM) of 4 biological replicates from 2 independent experiments is shown. ****p< 0.0001, unpaired Student's t test. G. Graph shows the relative invasion of SUM159T and SUM159T-SPANX-C cells transfected with control or Lamin A/C targeting siRNAs ≥30 μm into the ECM. Relative invasion was determined as described for (E). Mean ± standard error of the mean (SEM) of 4 biological replicates from 2 independent experiments is shown. ns= not significant, unpaired Student's t test.
Figure 3
Figure 3. SPANX-A/C/D and Lamin A/C are specifically required for LCP formation
A. SUM159T cells transfected with control, SPANX-A/C/D or Lamin A/C siRNA pools were plated onto a layer of ECM for 24 h and stained. Solid white arrows indicate representative cells with LCPs. Dashed white arrows indicate representative cells that fail to form LCPs. Scale bar, 100 μm. Graphs show the percentage of cells with a l/w ratio ≥2, indicating LCP formation. Mean± SD of 6 fields of view, each containing ≥40 cells, from 3 independent experiments for SPANX-A/C/D siRNA transfected cells. Mean+ SD of 4 fields of view, each containing ≥40 cells, from 2 independent experiments for Lamin A/C siRNA transfected cells. ***p< 0.001, ****p< 0.0001, unpaired Student's t test. B. Time lapse images of the SUM159T-LifeACT:GFP-H2B:mCherry cells transfected with control, SPANX-A/C/D or Lamin A/C siRNA pools. Representative images of 16 cells imaged over 2 independent experiments are shown. Also see Supplementary Video S1. The top panels for each condition show LifeACT:GFP (green) and H2B:mCherry (red). Bottom panels for each condition show heat maps depicting relative LifeACT:GFP signal intensity with red indicating strongest signal. Solid arrows identify a representative LCP. Dashed arrows identify regions where F-actin formation is dynamic. Scale bar, 25 μm.
Figure 4
Figure 4. SPANX-C is not sufficient to induce LCP formation or collective invasion
A. SUM159T, SUM159T-SPANXC:V5, SUM159O and SUM159O-SPANXC:V5 cells were plated onto a layer of ECM for 24 h. Cells were then fixed and immunostained with α-V5 antibody and counterstained with Hoechst and phalloidin. Solid white arrows indicate representative cells with LCPs. Dashed white arrows indicate representative cells that fail to form LCPs. Scale bar, 50 μm. Graph shows the percentage of cells with a l/w ratio ≥2, indicating LCP formation. Mean± SD of 4 fields of view, each containing ≥40 cells, from 2 independent experiments. ****p< 0.0001, ns= not significant, unpaired Student's t test. B. Graph shows the relative invasion of cells ≥30 μm into the ECM normalized to the total cell number and compared to SUM159O cells. Mean ± SD of 4 biological replicates from 2 independent experiments is shown. ns= not significant, ****p< 0.0001, unpaired Student's t test. C. Graphs show the relative invasion of SUM159T and SUM159T-Cdc42(Q61L) cells ≥30 μm into the ECM after transfection with control, DOCK10 or SPANX-A/C/D siRNA pools. Mean ± SEM of 4 biological replicates from 2 independent experiments is shown. *p< 0.05, ns= not significant, unpaired Student's t test.
Figure 5
Figure 5. CTAG2 is necessary for directional migration
A. SUM159T cells transfected with the indicated siRNAs were plated onto a layer of ECM for 24 h. Solid white arrows indicate representative cells with LCPs. Dashed white arrows indicate representative cells that fail to form LCPs. Scale bar, 100 μm. Graph shows the percentage of cells with a l/w ratio ≥2, indicating LCP formation. Mean± SD of 4 fields of view, each containing ≥40 cells, from 2 independent experiments. ns= not significant, **p< 0.01, ***p< 0.001, unpaired Student's t test. B. SUM159T-H2B:mCherry cells were transfected with control or CTAG2 siRNA pools for 48 h and then re-plated onto transwell inserts in serum free media. Transfected cells were then allowed to migrate towards serum containing media for 24 h. Representative images of SUM159T-H2B:mCherry cells that migrated to the underside of the transwell insert are shown. Scale bar, 100 μm. Graph shows the number of cells that migrated through the insert divided by the total number of cells on the top and underside of the insert and normalized to the control. Mean ± SEM of 4 independent experiments. ***p< 0.001, unpaired Student's t test. C. The movement of SUM159T-H2B:mCherry cells transfected with control or CTAG2 siRNAs over a 14 h time period in monolayer culture. The color indicates the speed of cell movement in the track. Scale bars, 50 μm. Graph shows the mean cell speed (mean ±SD, n=7 fields of view over 2 independent experiments). ****p< 0.0001, ns= not significant, unpaired Student's t test.
Figure 6
Figure 6. CTAG2 interacts with Pericentrin
A. SUM159T, SUM159T-CTAG2:V5 and SUM159T-CTAG1B:V5 cells immunostained with α-V5 and α-Pericentrin antibodies and counterstained with Hoechst. Scale bar, 10 μm. White arrows indicate representative CTAG:V5 foci that co-localize with Pericentrin. B. Graph shows percentage of cells with foci of CTAG1B or CTAG2 that co-localize with Pericentrin. Mean± SD of 4 fields of view containing at least 20 cells from 2 independent experiments. ****p< 0.0001, unpaired Student's t test. C. Cell lysates and associated α-V5 immunoprecipitates were immunoblotted with α-V5 and α-Pericentrin antibodies. Lysates incubated with protein A sepharose (PA) beads are included as a negative control. Results are representative of 3 independent experiments. D. SUM159T-CTAG2:V5 cells transfected as indicated were immunostained with α-V5 and α-Pericentrin antibodies and counterstained with Hoechst. Dashed white arrows indicate punctate localization of Pericentrin. Scale bar, 25 μm. E. SUM159T-CTAG2:V5 cells transfected as indicated were immunostained with α-V5 and α-Pericentrin antibodies and counterstained with Hoechst. White arrows indicate representative CTAG:V5 foci that co-localize with Pericentrin. Scale bar, 10 μm. Graph shows percentage of cells with foci of CTAG2 that co-localize with Pericentrin. Mean± SD of 4 fields of view containing at least 20 cells from 2 independent experiments. ****p< 0.0001, unpaired Student's t test. F. Cells lysates of SUM159T transfected with control or Lamin A/C siRNA pools were immunoblotted with α-Pericentrin and α-ERK1/2 antibodies. Results are representative of 3 independent experiments. G. Graph shows the relative invasion of SUM159T cells transfected with control or Pericentrin siRNA pools ≥ 30 μm into the ECM. The number of invasive cells is normalized to the total cell number in the field of view for each condition, which controls for any variations in cell number. Relative invasion equals the normalized invasive value of the cells transfected with the siRNA pool targeting Pericentrin divided by the mean normalized invasion for the “control” cells transfected with a pool of 4 siRNAs that do not target human genes. Mean ± SEM of 3 independent experiments is shown. ****p< 0.0001, unpaired Student's t test. H. Graph shows the relative invasion of SUM159T cells transfected with individual siRNAs targeting Pericentrin ≥30 μm into the ECM. Relative invasion was determined as described for (G). Mean ± SEM of 4 biological replicates from 2 independent experiments is shown. *** p< 0.001, ****p< 0.0001, unpaired Student's t test.
Figure 7
Figure 7. SPANX-A/C/D is required for metastasis
A. Relative expression of the indicated CTAs in SUM159T-GFP cells stably expressing shRNAs targeting SPANX-A/C/D or CTAG2 (n=2 mean ± range). B. Graphs show the volumes of tumors formed by SUM159T cells expressing control, CTAG2 and SPANX-A/C/D shRNAs (mean ± SD, n=9 mice/condition). C. Graph shows the weights of tumors formed by SUM159T cells expressing control and SPANX-A/C/D shRNAs (mean ± SD, n=9 mice/condition). P-values were determined by unpaired Student's t test. D. Representative fluorescent images of lungs from mice bearing control and SPANX-A/C/D shRNA expressing SUM159T-GFP primary tumors. Top panels, GFP expression of SUM159T-GFP cells in the lungs immediately after mice were sacrificed (n=9 mice/condition). Solid arrow indicates a macrometastic lesion. Dashed arrows indicate representative micrometastases. Scale bars, 200 μm. Bottom panels show representative images of lungs immunostained with α-GFP antibody and counterstained with Hoechst (n=9 mice/condition). Scale bars, 50 μm. Graphs show the relative number of micrometastases (left) and macrometastases (right) in the in the lungs normalized to the weight of the corresponding primary tumor (n=9 mice/condition). P-values determined by unpaired Student's t test.
Figure 8
Figure 8. Increased SPANX-A/C/D expression correlates with poor breast cancer patient outcome
A. Kaplan-Meier curves showing the distant metastasis free survival of breast cancer patients classified as “SPANX-A/C/D high” and “SPANX-A/C/D low” based on SPANX-A/C/D mRNA expression. Survival differences were compared by log-rank test. B. Kaplan-Meier curves showing the distant metastasis free survival of ER-neg patients classified as “SPANX-A/C/D-high” and “SPANX-A/C/D-low” based on SPANX-A/C/D mRNA expression. Survival differences were compared by log-rank test. Analysis of publicly available data sets was performed using KM-Plotter. C. Model showing how the induction of CTA expression could possibly contribute to the initiation of tumor invasion. Cells expressing CTAs can extend LCPs and migrate into the ECM surrounding primary tumors.

References

    1. Vanharanta S, Massague J. Origins of metastatic traits. Cancer Cell. 2013;24:410–421. - PMC - PubMed
    1. Tomaskovic-Crook E, Thompson EW, Thiery JP. Epithelial to mesenchymal transition and breast cancer. Breast Cancer Res. 2009;11:213. - PMC - PubMed
    1. Nieto MA. The ins and outs of the epithelial to mesenchymal transition in health and disease. Annu Rev Cell Dev Biol. 2011;27:347–376. - PubMed
    1. Lamouille S, Xu J, Derynck R. Molecular mechanisms of epithelial-mesenchymal transition. Nat Rev Mol Cell Biol. 2014;15:178–196. - PMC - PubMed
    1. Wicki A, Lehembre F, Wick N, Hantusch B, Kerjaschki D, Christofori G. Tumor invasion in the absence of epithelial-mesenchymal transition: podoplanin-mediated remodeling of the actin cytoskeleton. Cancer Cell. 2006;9:261–272. - PubMed

MeSH terms