Role of microRNAs in epigenetic silencing of the CHD5 tumor suppressor gene in neuroblastomas
- PMID: 26895110
- PMCID: PMC4941291
- DOI: 10.18632/oncotarget.7434
Role of microRNAs in epigenetic silencing of the CHD5 tumor suppressor gene in neuroblastomas
Abstract
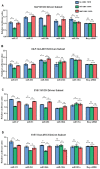
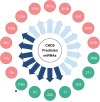
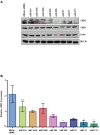
Neuroblastoma (NB), a tumor of the sympathetic nervous system, is the most common extracranial solid tumor of childhood. We and others have identified distinct patterns of genomic change that underlie diverse clinical behaviors, from spontaneous regression to relentless progression. We first identified CHD5 as a tumor suppressor gene that is frequently deleted in NBs. Mutation of the remaining CHD5 allele is rare in these tumors, yet expression is very low or absent, so expression is likely regulated by epigenetic mechanisms. In order to understand the potential role of miRNA regulation of CHD5 protein expression in NBs, we examined all miRNAs that are predicted to target the 3'-UTR using miRanda, TargetScan and other algorithms. We identified 18 miRNAs that were predicted by 2 or more programs: miR-204, -211, -216b, -17, -19ab, -20ab, -93, -106ab, -130ab, -301ab, -454, -519d, -3666. We then performed transient transfections in two NB cell lines, NLF (MYCN amplified) and SY5Y (MYCN non-amplified), with the reporter plasmid and miRNA mimic, as well as appropriate controls. We found seven miRNAs that significantly downregulated CHD5 expression in NB: miR-211, 17, -93, -20b, -106b, -204, and -3666. Interestingly, MYCN upregulates several of the candidates we identified: miR-17, -93, -106b & -20b. This suggests that miRNAs driven by MYCN and other genes represent a potential epigenetic mechanism to regulate CHD5 expression.
Keywords: CHD5; MYCN; miRNA; neuroblastoma; tumor suppressor.
Conflict of interest statement
The authors declare no conflicts of interest.
Figures


Similar articles
-
CHD5, a tumor suppressor gene deleted from 1p36.31 in neuroblastomas.J Natl Cancer Inst. 2008 Jul 2;100(13):940-9. doi: 10.1093/jnci/djn176. Epub 2008 Jun 24. J Natl Cancer Inst. 2008. PMID: 18577749 Free PMC article.
-
Mechanisms of CHD5 Inactivation in neuroblastomas.Clin Cancer Res. 2012 Mar 15;18(6):1588-97. doi: 10.1158/1078-0432.CCR-11-2644. Epub 2012 Jan 31. Clin Cancer Res. 2012. PMID: 22294723 Free PMC article.
-
Retinoic acid-induced CHD5 upregulation and neuronal differentiation of neuroblastoma.Mol Cancer. 2015 Aug 7;14:150. doi: 10.1186/s12943-015-0425-y. Mol Cancer. 2015. PMID: 26245651 Free PMC article.
-
Role of CHD5 in human cancers: 10 years later.Cancer Res. 2014 Feb 1;74(3):652-8. doi: 10.1158/0008-5472.CAN-13-3056. Epub 2014 Jan 13. Cancer Res. 2014. PMID: 24419087 Free PMC article. Review.
-
N-myc and noncoding RNAs in neuroblastoma.Mol Cancer Res. 2012 Oct;10(10):1243-53. doi: 10.1158/1541-7786.MCR-12-0244. Epub 2012 Aug 30. Mol Cancer Res. 2012. PMID: 22936790 Review.
Cited by
-
MYCN in Neuroblastoma: "Old Wine into New Wineskins".Diseases. 2021 Oct 29;9(4):78. doi: 10.3390/diseases9040078. Diseases. 2021. PMID: 34842635 Free PMC article. Review.
-
SNP rs3202538 in 3'UTR region of ErbB3 regulated by miR-204 and miR-211 promote gastric cancer development in Chinese population.Cancer Cell Int. 2017 Sep 13;17:81. doi: 10.1186/s12935-017-0449-z. eCollection 2017. Cancer Cell Int. 2017. PMID: 28924391 Free PMC article.
-
CHD5 gene variant predicts leptomeningeal metastasis after surgical resection of brain metastases of breast cancer.J Neurooncol. 2023 Jul;163(3):657-662. doi: 10.1007/s11060-023-04381-9. Epub 2023 Jul 13. J Neurooncol. 2023. PMID: 37440096
-
Assessment of Circulating Microribonucleic Acids in Patients With Familial Mediterranean Fever.Arch Rheumatol. 2019 Nov 6;35(1):52-59. doi: 10.5606/ArchRheumatol.2020.7414. eCollection 2020 Mar. Arch Rheumatol. 2019. PMID: 32637920 Free PMC article.
-
Clinical significance of chromatin remodeling factor CHD5 expression in gastric cancer.Oncol Lett. 2020 Jan;19(1):1066-1073. doi: 10.3892/ol.2019.11138. Epub 2019 Nov 21. Oncol Lett. 2020. PMID: 31897220 Free PMC article.
References
-
- Bilke S, Chen QR, Westerman F, Schwab M, Catchpoole D, Khan J. Inferring a tumor progression model for neuroblastoma from genomic data. J Clin Oncol. 2005;23:7322–7331. - PubMed
-
- Brodeur GM. Neuroblastoma: biological insights into a clinical enigma. Nat Rev Cancer. 2003;3:203–216. - PubMed
-
- Brodeur GM, Hogarty MD, Mosse YP, Maris JM. Neuroblastoma. In: Pizzo PA, Poplack DG, editors. Principles and Practice of Pediatric Oncology. Philadelphia: Lippincott, Williams and Wilkins; 2011. pp. 886–922.
-
- Mosse YP, Greshock J, Margolin A, Naylor T, Cole K, Khazi D, Hii G, Winter C, Shahzad S, Asziz MU, Biegel JA, Weber BL, Maris JM. High-resolution detection and mapping of genomic DNA alterations in neuroblastoma. Genes Chromosomes Cancer. 2005;43:390–403. - PubMed
MeSH terms
Substances
Grants and funding
LinkOut - more resources
Full Text Sources
Other Literature Sources
Medical
Research Materials
Miscellaneous

