

A Systematic Approach towards Optimizing a Cohabitation Challenge Model for Infectious Pancreatic Necrosis Virus in Atlantic Salmon (Salmo salar L.)
- PMID: 26895162
- PMCID: PMC4760736
- DOI: 10.1371/journal.pone.0148467
A Systematic Approach towards Optimizing a Cohabitation Challenge Model for Infectious Pancreatic Necrosis Virus in Atlantic Salmon (Salmo salar L.)
Abstract
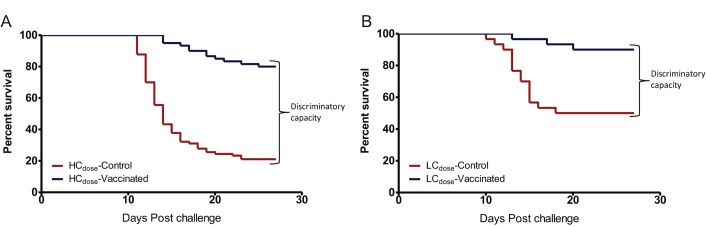
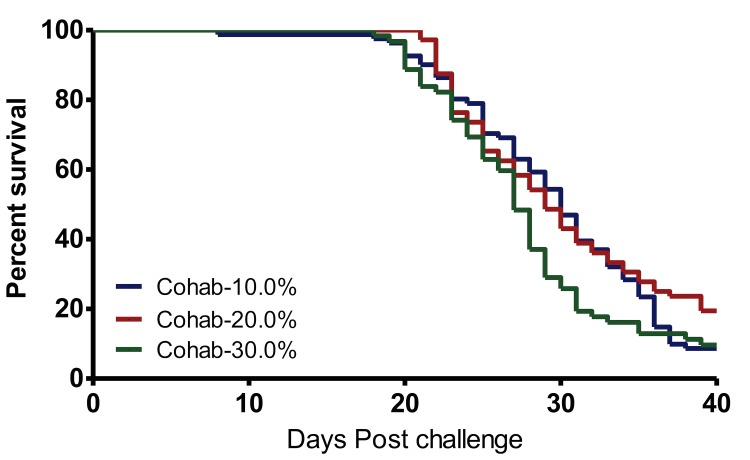
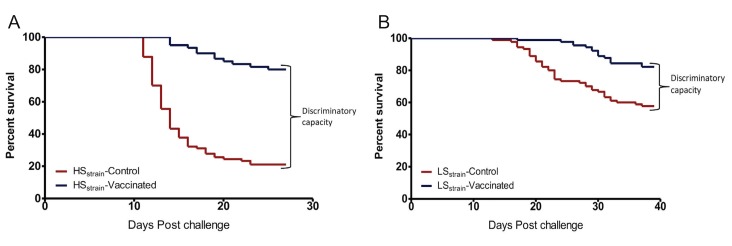
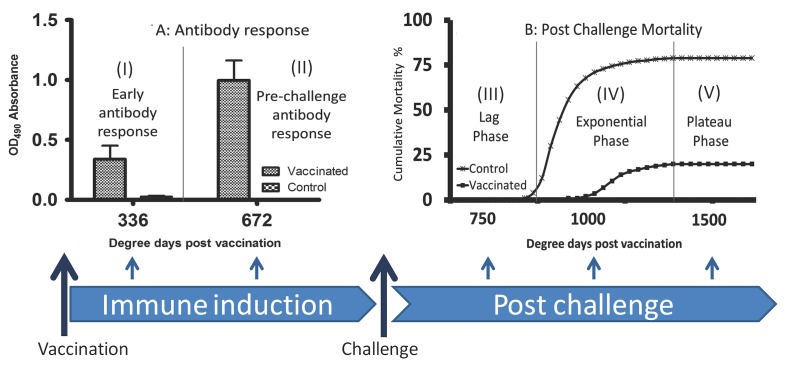
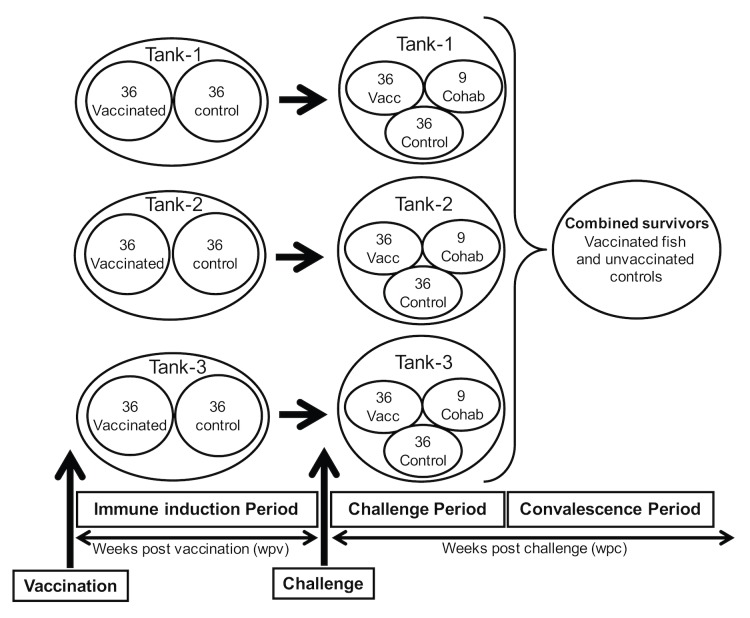
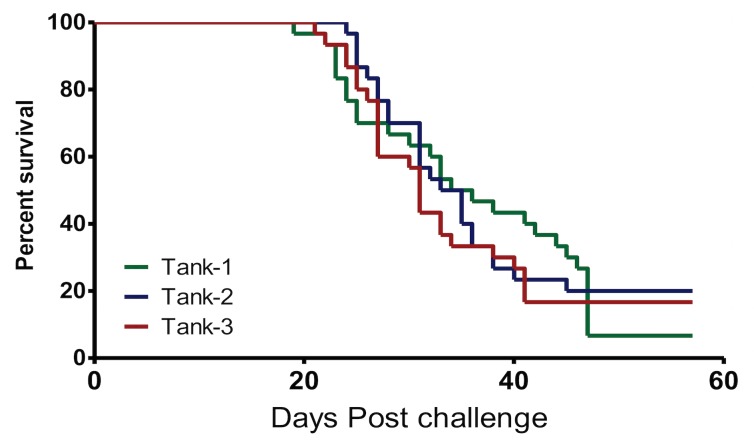
A cohabitation challenge model was developed for use in evaluating the efficacy of vaccines developed against infectious pancreatic necrosis virus (IPNV) in Atlantic salmon (Salmo salar L) using a stepwise approach. The study involved identifying a set of input variables that were optimized before inclusion in the model. Input variables identified included the highly virulent Norwegian Sp strain NVI015-TA encoding the T217A221 motif having the ability to cause >90% mortality and a hazard risk ratio of 490.18 (p<0.000) for use as challenge virus. The challenge dose was estimated at 1x10(7) TCID50/mL per fish while the proportion of virus shedders was estimated at 12.5% of the total number of fish per tank. The model was designed based on a three parallel tank system in which the Cox hazard proportional regression model was used to estimate the minimum number of fish required to show significant differences between the vaccinated and control fish in each tank. All input variables were optimized to generate mortality >75% in the unvaccinated fish in order to attain a high discriminatory capacity (DC) between the vaccinated and control fish as a measure of vaccine efficacy. The model shows the importance of using highly susceptible fish to IPNV in the optimization of challenge models by showing that highly susceptible fish had a better DC of differentiating vaccine protected fish from the unvaccinated control fish than the less susceptible fish. Once all input variables were optimized, the model was tested for its reproducibility by generating similar results from three independent cohabitation challenge trials using the same input variables. Overall, data presented here show that the cohabitation challenge model developed in this study is reproducible and that it can reliably be used to evaluate the efficacy of vaccines developed against IPNV in Atlantic salmon. We envision that the approach used here will open new avenues for developing optimal challenge models for use in evaluating the efficacy of different vaccines used in aquaculture.
Conflict of interest statement
Figures
Similar articles
-
Comparison of vaccine efficacy for different antigen delivery systems for infectious pancreatic necrosis virus vaccines in Atlantic salmon (Salmo salar L.) in a cohabitation challenge model.Vaccine. 2012 Jun 8;30(27):4007-16. doi: 10.1016/j.vaccine.2012.04.039. Epub 2012 Apr 23. Vaccine. 2012. PMID: 22537985
-
Strong genetic influence on IPN vaccination-and-challenge trials in Atlantic salmon, Salmo salar L.J Fish Dis. 2008 Aug;31(8):567-78. doi: 10.1111/j.1365-2761.2008.00929.x. Epub 2008 May 13. J Fish Dis. 2008. PMID: 18482384
-
The kinetics of CD4+ and CD8+ T-cell gene expression correlate with protection in Atlantic salmon (Salmo salar L) vaccinated against infectious pancreatic necrosis.Vaccine. 2013 Apr 8;31(15):1956-63. doi: 10.1016/j.vaccine.2013.02.008. Epub 2013 Feb 17. Vaccine. 2013. PMID: 23422142
-
Immunization with viral antigens: infectious pancreatic necrosis.Dev Biol Stand. 1997;90:191-9. Dev Biol Stand. 1997. PMID: 9270848 Review.
-
Infectious pancreatic necrosis in Atlantic salmon, Salmo salar L.J Fish Dis. 2005 Jul;28(7):383-90. doi: 10.1111/j.1365-2761.2005.00642.x. J Fish Dis. 2005. PMID: 16083443 Review.
Cited by
-
A whole-cell Lactococcus garvieae autovaccine protects Nile tilapia against infection.PLoS One. 2020 Mar 26;15(3):e0230739. doi: 10.1371/journal.pone.0230739. eCollection 2020. PLoS One. 2020. PMID: 32214386 Free PMC article.
-
An Overview of Vaccination Strategies and Antigen Delivery Systems for Streptococcus agalactiae Vaccines in Nile Tilapia (Oreochromis niloticus).Vaccines (Basel). 2016 Dec 13;4(4):48. doi: 10.3390/vaccines4040048. Vaccines (Basel). 2016. PMID: 27983591 Free PMC article. Review.
-
Identification of a New Infectious Pancreatic Necrosis Virus (IPNV) Variant in Atlantic Salmon (Salmo salar L.) that can Cause High Mortality Even in Genetically Resistant Fish.Front Genet. 2021 Nov 26;12:635185. doi: 10.3389/fgene.2021.635185. eCollection 2021. Front Genet. 2021. PMID: 34899819 Free PMC article.
-
Challenges and Solutions to Viral Diseases of Finfish in Marine Aquaculture.Pathogens. 2021 May 30;10(6):673. doi: 10.3390/pathogens10060673. Pathogens. 2021. PMID: 34070735 Free PMC article. Review.
-
Salmonid Antibacterial Immunity: An Aquaculture Perspective.Biology (Basel). 2020 Oct 11;9(10):331. doi: 10.3390/biology9100331. Biology (Basel). 2020. PMID: 33050557 Free PMC article. Review.
References
-
- Jarp J, Gjevre AG, Olsen AB, Bruheim T (1995) Risk-Factors for Furunculosis, Infectious Pancreatic Necrosis and Mortality in Post-Smolt of Atlantic Salmon, Salmo-Salar l. Journal of Fish Diseases 18: 67–78.
-
- Munang'andu HM (2013) Vaccinology of infectious pancreatic necrosis virus: Immunogenicity, signatures of infection and correlates of protective immunity. PhD Thesis, Norwegian School of Veterinary Science, Oslo, Norway.
MeSH terms
Substances
LinkOut - more resources
Full Text Sources
Other Literature Sources
