

Metabolic profiling during HIV-1 and HIV-2 infection of primary human monocyte-derived macrophages
- PMID: 26895248
- PMCID: PMC4834987
- DOI: 10.1016/j.virol.2016.01.023
Metabolic profiling during HIV-1 and HIV-2 infection of primary human monocyte-derived macrophages
Abstract
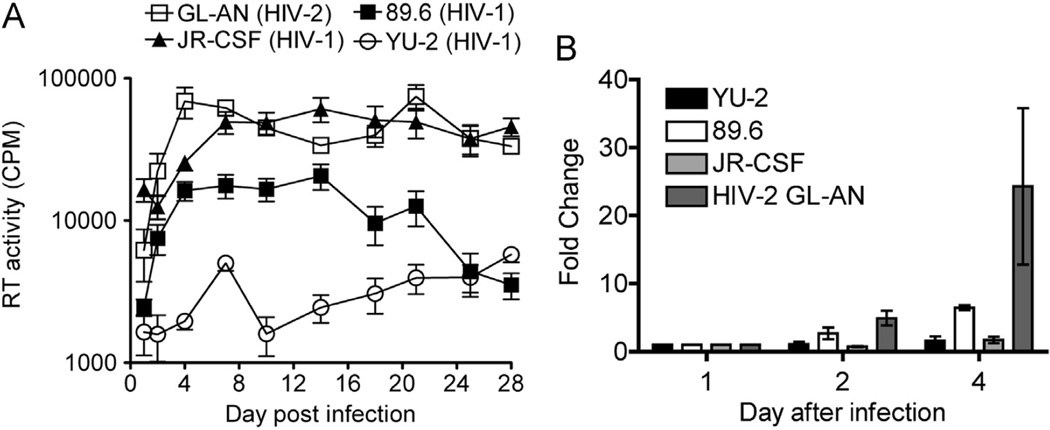
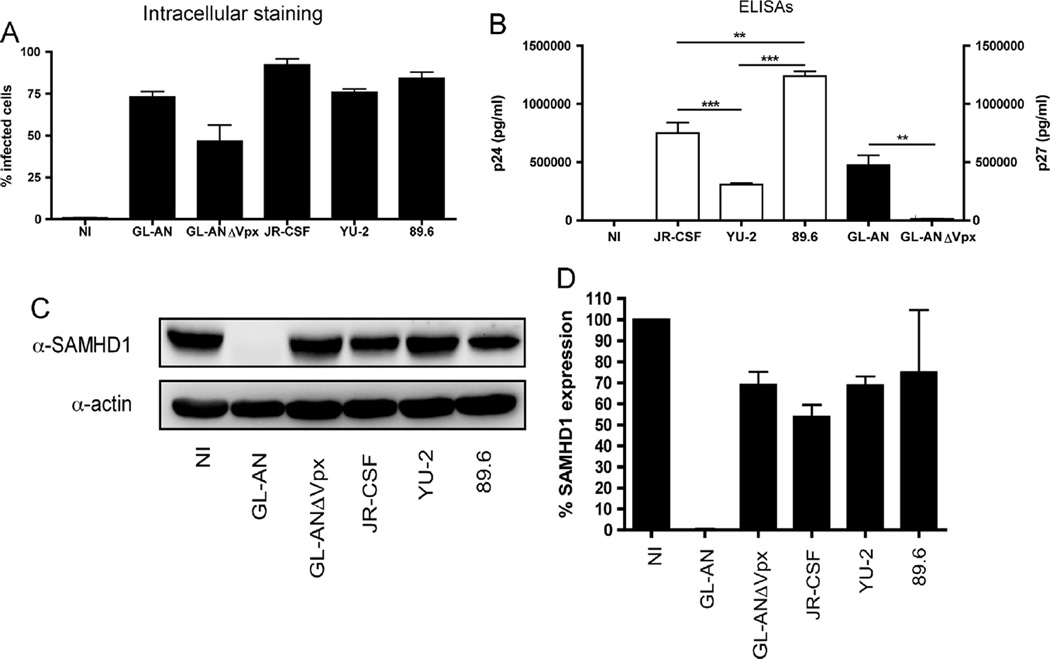
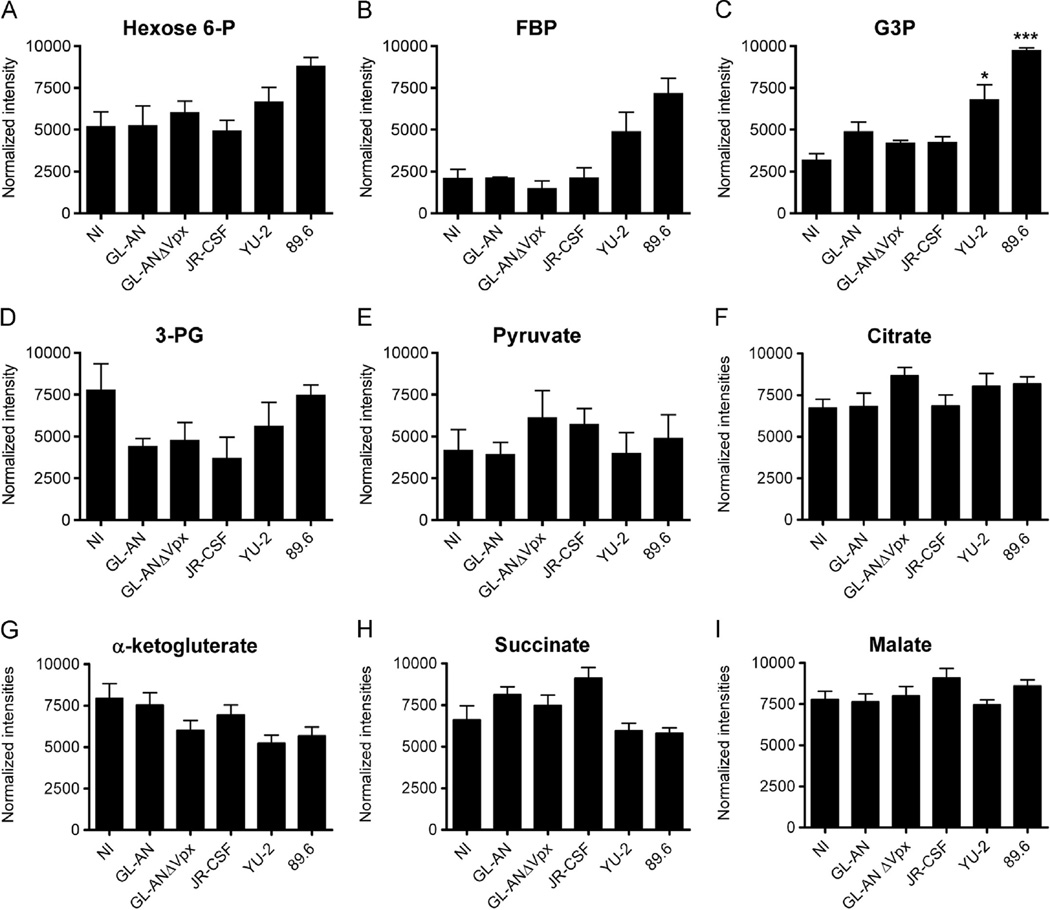
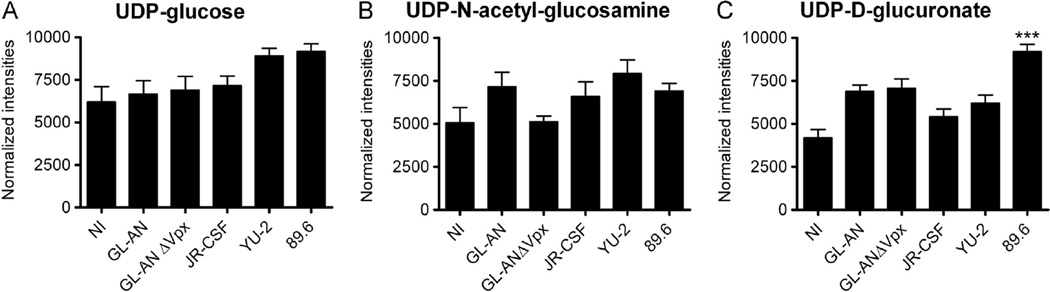
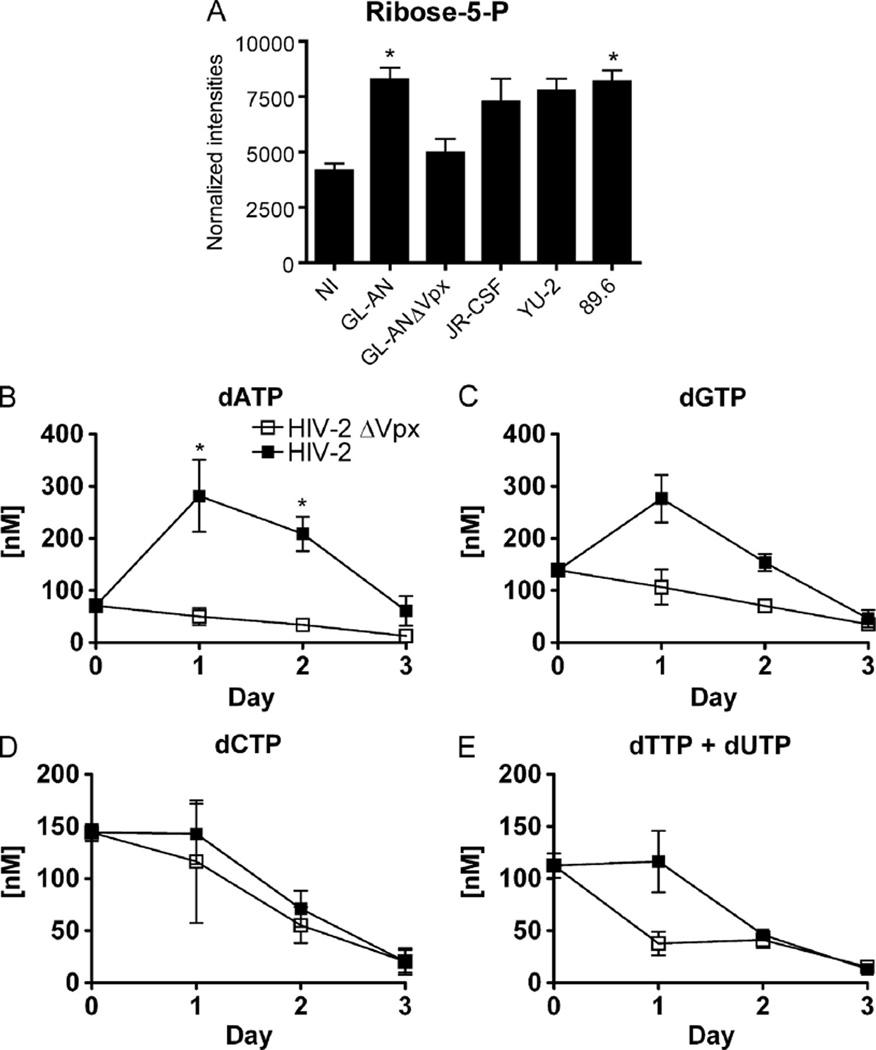
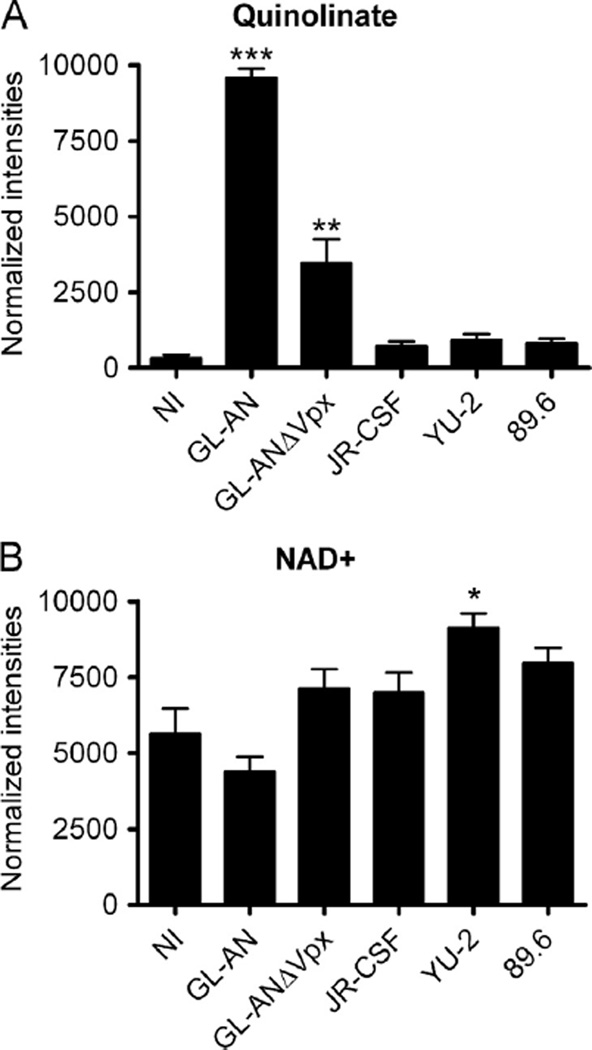
We evaluated cellular metabolism profiles of HIV-1 and HIV-2 infected primary human monocyte-derived macrophages (MDMs). First, HIV-2 GL-AN displays faster production kinetics and greater amounts of virus as compared to HIV-1s: YU-2, 89.6 and JR-CSF. Second, quantitative LC-MS/MS metabolomics analysis demonstrates very similar metabolic profiles in glycolysis and TCA cycle metabolic intermediates between HIV-1 and HIV-2 infected macrophages, with a few notable exceptions. The most striking metabolic change in MDMs infected with HIV-2 relative to HIV-1-infected MDMs was the increased levels of quinolinate, a metabolite in the tryptophan catabolism pathway that has been linked to HIV/AIDS pathogenesis. Third, both HIV-1 and HIV-2 infected MDMs showed elevated levels of ribose-5-phosphate, a key metabolic component in nucleotide biosynthesis. Finally, HIV-2 infected MDMs display increased dNTP concentrations as predicted by Vpx-mediated SAMHD1 degradation. Collectively, these data show differential metabolic changes during HIV-1 and HIV-2 infection of macrophages.
Keywords: Glycolysis; HIV-1; HIV-2; LC–MS/MS; Macrophages; Metabolites; TCA.
Copyright © 2016. Published by Elsevier Inc.
Figures
Similar articles
-
Glutamate metabolism in HIV-1 infected macrophages: Role of HIV-1 Vpr.Cell Cycle. 2016 Sep;15(17):2288-98. doi: 10.1080/15384101.2016.1190054. Epub 2016 May 31. Cell Cycle. 2016. PMID: 27245560 Free PMC article.
-
Cytosolic sulfotransferase 1A1 regulates HIV-1 minus-strand DNA elongation in primary human monocyte-derived macrophages.Virol J. 2016 Feb 24;13:30. doi: 10.1186/s12985-016-0491-9. Virol J. 2016. PMID: 26906565 Free PMC article.
-
Comparison of miRNA Expression Profiles between HIV-1 and HIV-2 Infected Monocyte-Derived Macrophages (MDMs) and Peripheral Blood Mononuclear Cells (PBMCs).Int J Mol Sci. 2020 Sep 22;21(18):6970. doi: 10.3390/ijms21186970. Int J Mol Sci. 2020. PMID: 32971935 Free PMC article.
-
[SAMHD1 − a HIV-1 restriction factor derived from Myeloid lineage monocytes].Dongwuxue Yanjiu. 2012 Oct;33(5):537-41. doi: 10.3724/SP.J.1141.2012.05537. Dongwuxue Yanjiu. 2012. PMID: 23019037 Review. Chinese.
-
Interactions between macrophages and brain microvascular endothelial cells: role in pathogenesis of HIV-1 infection and blood - brain barrier function.J Neurovirol. 1999 Dec;5(6):659-69. doi: 10.3109/13550289909021294. J Neurovirol. 1999. PMID: 10602406 Review.
Cited by
-
Enhanced enzyme kinetics of reverse transcriptase variants cloned from animals infected with SIVmac239 lacking viral protein X.J Biol Chem. 2020 Dec 11;295(50):16975-16986. doi: 10.1074/jbc.RA120.015273. Epub 2020 Oct 2. J Biol Chem. 2020. PMID: 33008888 Free PMC article.
-
Robust Regression Analysis of GCMS Data Reveals Differential Rewiring of Metabolic Networks in Hepatitis B and C Patients.Metabolites. 2017 Oct 8;7(4):51. doi: 10.3390/metabo7040051. Metabolites. 2017. PMID: 28991180 Free PMC article.
-
Metabolomics Analysis of Viral Therapeutics.Methods Mol Biol. 2021;2225:179-197. doi: 10.1007/978-1-0716-1012-1_10. Methods Mol Biol. 2021. PMID: 33108663 Free PMC article.
-
Metabolomics in infectious diseases and drug discovery.Mol Omics. 2021 Jun 14;17(3):376-393. doi: 10.1039/d1mo00017a. Mol Omics. 2021. PMID: 34125125 Free PMC article. Review.
-
Insights into the molecular basis of tick-borne encephalitis from multiplatform metabolomics.PLoS Negl Trop Dis. 2021 Mar 10;15(3):e0009172. doi: 10.1371/journal.pntd.0009172. eCollection 2021 Mar. PLoS Negl Trop Dis. 2021. PMID: 33690602 Free PMC article.
References
-
- Aggarwal A, McAllery S, Turville SG. Revising the role of myeloid cells in HIV pathogenesis. Curr. HIV/AIDS Rep. 2013;10:3–11. - PubMed
-
- Bajad SU, Lu W, Kimball EH, Yuan J, Peterson C, Rabinowitz JD. Separation and quantitation of water soluble cellular metabolites by hydrophilic interaction chromatography-tandem mass spectrometry. J. Chromatogr. A. 2006;1125:76–88. - PubMed
-
- Baldauf HM, Pan X, Erikson E, Schmidt S, Daddacha W, Burggraf M, Schenkova K, Ambiel I, Wabnitz G, Gramberg T, Panitz S, Flory E, Landau NR, Sertel S, Rutsch F, Lasitschka F, Kim B, Konig R, Fackler OT, Keppler OT. SAMHD1 restricts HIV-1 infection in resting CD4(+) T cells. Nat. Med. 2012;18:1682–1689. - PMC - PubMed
Publication types
MeSH terms
Grants and funding
LinkOut - more resources
Full Text Sources
Other Literature Sources
Medical
Miscellaneous
