Distinct lncRNA transcriptional fingerprints characterize progressive stages of multiple myeloma
- PMID: 26895470
- PMCID: PMC4924754
- DOI: 10.18632/oncotarget.7442
Distinct lncRNA transcriptional fingerprints characterize progressive stages of multiple myeloma
Abstract
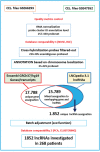
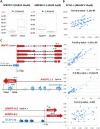
Although many efforts have recently contributed to improve our knowledge of molecular pathogenesis of multiple myeloma (MM), the role and significance of long non-coding RNAs (lncRNAs) in plasma cells (PC) malignancies remains virtually absent. To this aim, we developed a custom annotation pipeline of microarray data investigating lncRNA expression in PCs from 20 monoclonal gammopathies of undetermined significance, 33 smoldering MM, 170 MM, and 36 extra-medullary MMs/plasma cell leukemia patients, and 9 healthy donors. Our study identified 31 lncRNAs deregulated in tumor samples compared to normal controls; among these, the upregulation of MALAT1 appeared associated in MM patients with molecular pathways involving cell cycle regulation, p53-mediated DNA damage response, and mRNA maturation processes. Furthermore, we found 21 lncRNAs whose expression were progressively deregulated trough the more aggressive stages of PC dyscrasia, suggesting a possible role in the progression of the disease. Finally, in the context of molecular heterogeneity of MM, we identified a transcriptional fingerprint in hyperdiploid patients, characterized by the upregulation of lncRNAs/pseudogenes related to ribosomal protein genes, known to be upregulated in this molecular group. Overall, the data provides an important resource for future studies on the functions of lncRNAs in the pathology.
Keywords: MALAT1; expression profiling; lncRNA; multiple myeloma; plasma cell dyscrasia.
Conflict of interest statement
The authors declare no conflicts of interests.
Figures


Similar articles
-
Long non-coding RNA MALAT1 is an inducible stress response gene associated with extramedullary spread and poor prognosis of multiple myeloma.Br J Haematol. 2017 Nov;179(3):449-460. doi: 10.1111/bjh.14882. Epub 2017 Aug 2. Br J Haematol. 2017. PMID: 28770558
-
Transcriptome profiling of lncRNA and co-expression networks in esophageal squamous cell carcinoma by RNA sequencing.Tumour Biol. 2016 Oct;37(10):13091-13100. doi: 10.1007/s13277-016-5227-3. Epub 2016 Jul 23. Tumour Biol. 2016. PMID: 27449043
-
Focusing on long non-coding RNA dysregulation in newly diagnosed multiple myeloma.Life Sci. 2018 Mar 1;196:133-142. doi: 10.1016/j.lfs.2018.01.025. Epub 2018 Feb 3. Life Sci. 2018. PMID: 29459023
-
The role of long non-coding RNAs in multiple myeloma.Eur J Haematol. 2019 Jul;103(1):3-9. doi: 10.1111/ejh.13237. Epub 2019 May 29. Eur J Haematol. 2019. PMID: 30985973 Review.
-
Aberrant lncRNA Expression in Multiple Myeloma.Oncol Res. 2018 Jun 11;26(5):809-816. doi: 10.3727/096504017X15123872205507. Epub 2017 Dec 4. Oncol Res. 2018. PMID: 29212572 Free PMC article. Review.
Cited by
-
Hypoxia-inducible KDM3A addiction in multiple myeloma.Blood Adv. 2018 Feb 27;2(4):323-334. doi: 10.1182/bloodadvances.2017008847. Blood Adv. 2018. PMID: 29444873 Free PMC article.
-
Long non-coding RNA NEAT1 shows high expression unrelated to molecular features and clinical outcome in multiple myeloma.Haematologica. 2019 Feb;104(2):e72-e76. doi: 10.3324/haematol.2018.201301. Epub 2018 Sep 13. Haematologica. 2019. PMID: 30213829 Free PMC article. No abstract available.
-
Targeting the MALAT1/PARP1/LIG3 complex induces DNA damage and apoptosis in multiple myeloma.Leukemia. 2018 Oct;32(10):2250-2262. doi: 10.1038/s41375-018-0104-2. Epub 2018 Mar 22. Leukemia. 2018. PMID: 29632340 Free PMC article.
-
MALAT1: a druggable long non-coding RNA for targeted anti-cancer approaches.J Hematol Oncol. 2018 May 8;11(1):63. doi: 10.1186/s13045-018-0606-4. J Hematol Oncol. 2018. PMID: 29739426 Free PMC article. Review.
-
MALAT1 Long Non-Coding RNA: Functional Implications.Noncoding RNA. 2020 Jun 3;6(2):22. doi: 10.3390/ncrna6020022. Noncoding RNA. 2020. PMID: 32503170 Free PMC article. Review.
References
-
- Kuehl WM, Bergsagel PL. Multiple myeloma: evolving genetic events and host interactions. Nat Rev Cancer. 2002;2:175–187. - PubMed
-
- Kyle RA, Rajkumar SV. Monoclonal gammopathies of undetermined significance: a review. Immunol.Rev. 2003;194:112–139. - PubMed
-
- Palumbo A, Anderson K. Multiple myeloma. N Engl J Med. 2011;364:1046–1060. - PubMed
-
- Birney E, Stamatoyannopoulos JA, Dutta A, Guigo R, Gingeras TR, Margulies EH, Weng Z, Snyder M, Dermitzakis ET, Thurman RE, Kuehn MS, Taylor CM, Neph S, et al. Identification and analysis of functional elements in 1% of the human genome by the ENCODE pilot project. Nature. 2007;447:799–816. - PMC - PubMed
MeSH terms
Substances
LinkOut - more resources
Full Text Sources
Other Literature Sources
Medical
Research Materials
Miscellaneous

