

Small-area spatio-temporal analyses of bladder and kidney cancer risk in Nova Scotia, Canada
- PMID: 26895703
- PMCID: PMC4761137
- DOI: 10.1186/s12889-016-2767-9
Small-area spatio-temporal analyses of bladder and kidney cancer risk in Nova Scotia, Canada
Abstract
Background: Bladder and kidney cancers are the ninth and twelfth most common type of cancer worldwide, respectively. Internationally, rates vary ten-fold, with several countries showing rising incidence. This study describes the spatial and spatio-temporal variations in the incidence risk of these diseases for Nova Scotia, a province located in Atlantic Canada, where rates for bladder and kidney cancer exceed those of the national average by about 25% and 35%, respectively.
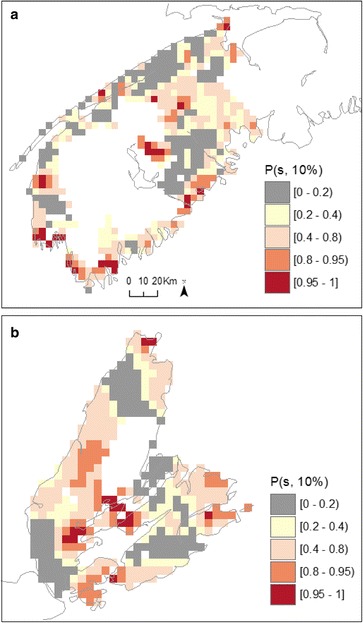
Methods: Cancer incidence in the 311 Communities of Nova-Scotia was analyzed with a spatial autoregressive model for the case counts of bladder and kidney cancers (3,232 and 2,143 total cases, respectively), accounting for each Community's population and including variables known to influence risk. A spatially-continuous analysis, using a geostatistical Local Expectation-Maximization smoothing algorithm, modeled finer-scale spatial variation in risk for south-western Nova Scotia (1,810 bladder and 957 kidney cases) and Cape Breton (1,101 bladder, 703 kidney).
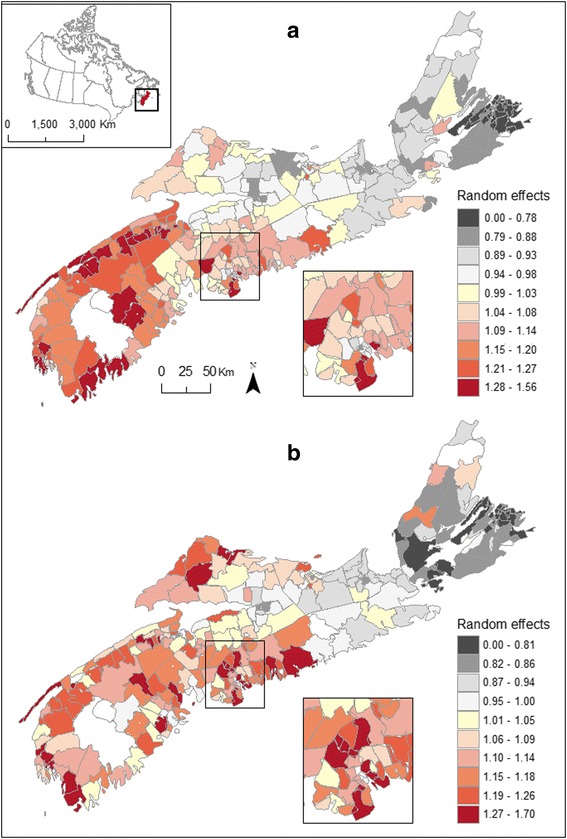
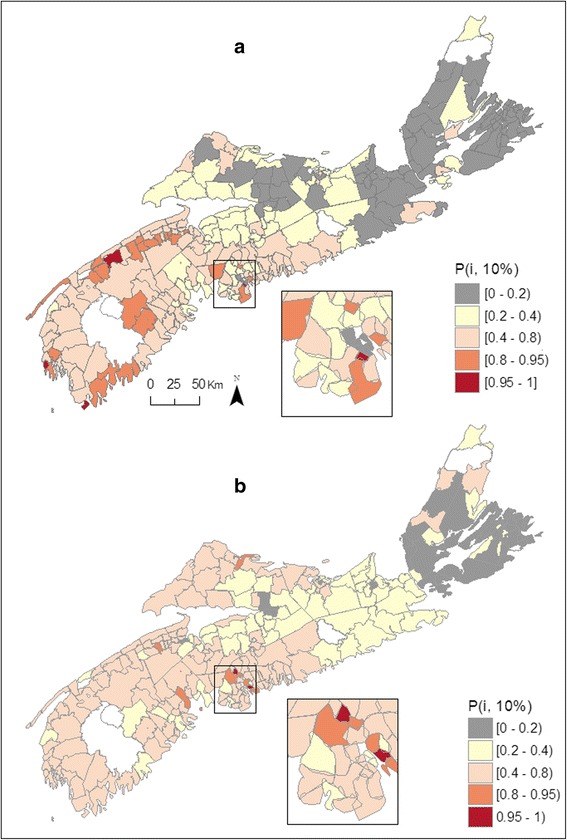
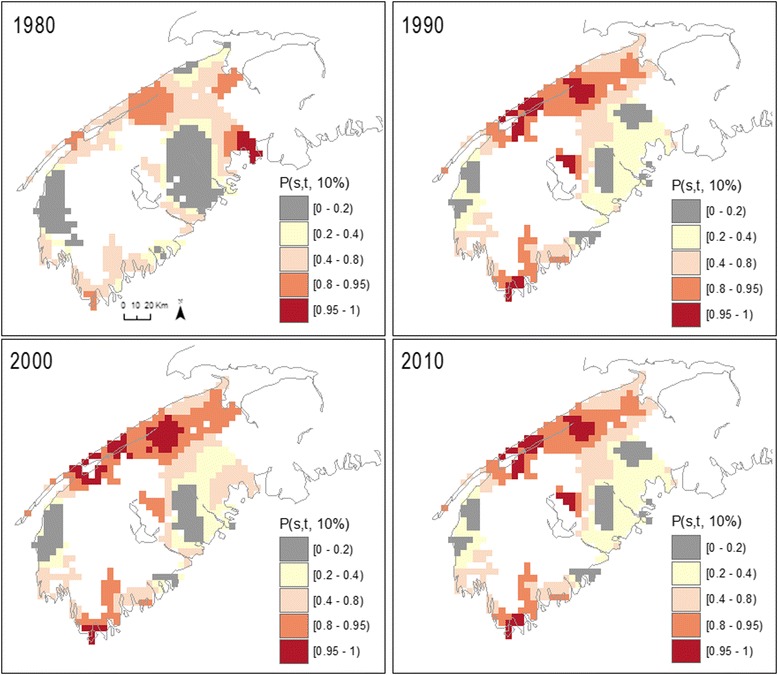
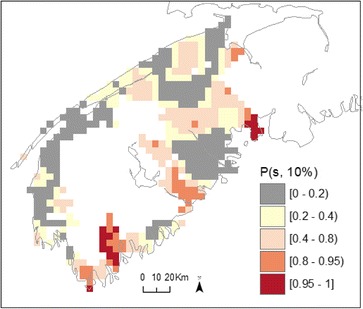
Results: Evidence of spatial variations in the risk of bladder and kidney cancer was demonstrated using both aggregated Community-level mapping and continuous-grid based localized mapping; and these were generally stable over time. The Community-level analysis suggested that much of this heterogeneity was not accounted for by known explanatory variables. There appears to be a north-east to south-west increasing gradient with a number of south-western Communities have risk of bladder or kidney cancer more than 10% above the provincial average. Kidney cancer risk was also elevated in various northeastern communities. Over a 12 year period this exceedance translated in an excess of 200 cases. Patterns of variations in risk obtained from the spatially continuous smoothing analysis generally mirrored those from the Community-level autoregressive model, although these more localized risk estimates resulted in a larger spatial extent for which risk is likely to be elevated.
Conclusions: Modelling the spatio-temporal distribution of disease risk enabled the quantification of risk relative to expected background levels and the identification of high risk areas. It also permitted the determination of the relative stability of the observed patterns over time and in this study, pointed to excess risk potentially driven by exposure to risk factors that act in a sustained manner over time.
Figures


Similar articles
-
The Nova Scotia Community Cancer Matrix: A geospatial tool to support cancer prevention.Soc Sci Med. 2023 Aug;330:116038. doi: 10.1016/j.socscimed.2023.116038. Epub 2023 Jun 21. Soc Sci Med. 2023. PMID: 37390806
-
Estimating the risk of bladder and kidney cancer from exposure to low-levels of arsenic in drinking water, Nova Scotia, Canada.Environ Int. 2018 Jan;110:95-104. doi: 10.1016/j.envint.2017.10.014. Epub 2017 Oct 31. Environ Int. 2018. PMID: 29089168
-
Trends in the incidence of bladder cancer in Nova Scotia: a twenty-year perspective.Can J Urol. 2003 Jun;10(3):1880-4. Can J Urol. 2003. PMID: 12892574
-
[SENTIERI - Epidemiological Study of Residents in National Priority Contaminated Sites. Sixth Report].Epidemiol Prev. 2023 Jan-Apr;47(1-2 Suppl 1):1-286. doi: 10.19191/EP23.1-2-S1.003. Epidemiol Prev. 2023. PMID: 36825373 Italian.
-
Global Burden of Urologic Cancers, 1990-2013.Eur Urol. 2017 Mar;71(3):437-446. doi: 10.1016/j.eururo.2016.10.008. Epub 2016 Oct 28. Eur Urol. 2017. PMID: 28029399 Review.
Cited by
-
Associations between Neighborhood Walkability, Physical Activity, and Chronic Disease in Nova Scotian Adults: An Atlantic PATH Cohort Study.Int J Environ Res Public Health. 2020 Nov 20;17(22):8643. doi: 10.3390/ijerph17228643. Int J Environ Res Public Health. 2020. PMID: 33233809 Free PMC article.
-
Small area disease mapping of cancer incidence in British Columbia using Bayesian spatial models and the smallareamapp R Package.Front Oncol. 2022 Oct 19;12:833265. doi: 10.3389/fonc.2022.833265. eCollection 2022. Front Oncol. 2022. PMID: 36338766 Free PMC article.
References
-
- Kidney cancer statistics | World Cancer Research Fund International [http://www.wcrf.org/int/cancer-facts-figures/data-specific-cancers/kidne...]
-
- Janković S, Radosavljević V. Risk factors for bladder cancer. Tumori. 2007;93:4–12. - PubMed
Publication types
MeSH terms
Grants and funding
LinkOut - more resources
Full Text Sources
Other Literature Sources
Medical
