. 2016 Jul;65(7):1892-903.
doi: 10.2337/db15-1428. Epub 2016 Feb 19.

Brain Insulin Signaling Is Increased in Insulin-Resistant States and Decreases in FOXOs and PGC-1α and Increases in Aβ1-40/42 and Phospho-Tau May Abet Alzheimer Development

Affiliations

Brain Insulin Signaling Is Increased in Insulin-Resistant States and Decreases in FOXOs and PGC-1α and Increases in Aβ1-40/42 and Phospho-Tau May Abet Alzheimer Development

Mini Sajan et al. Diabetes. 2016 Jul.

Abstract

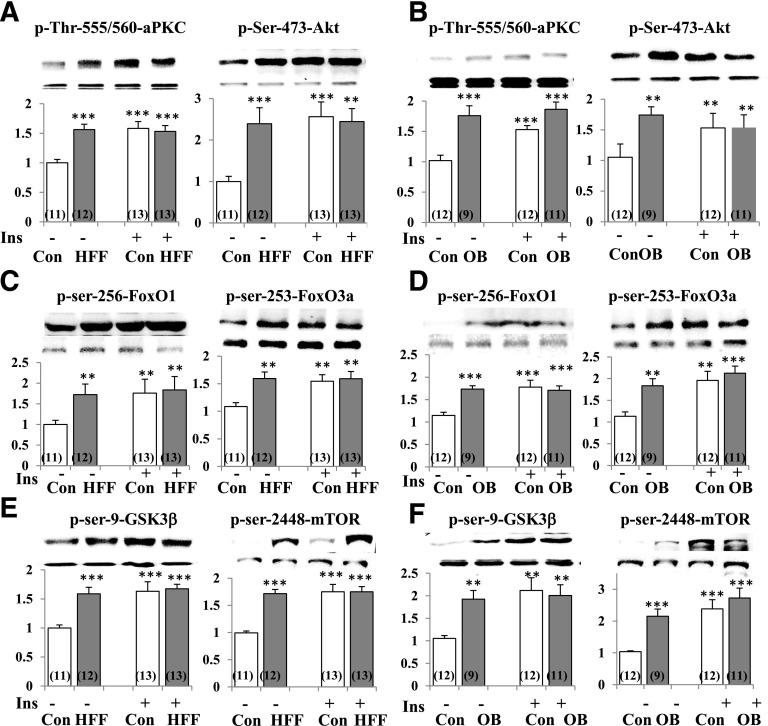
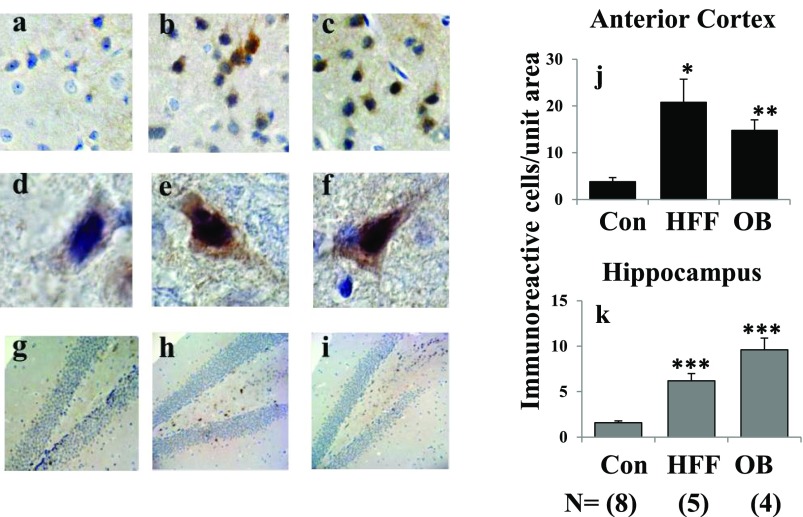
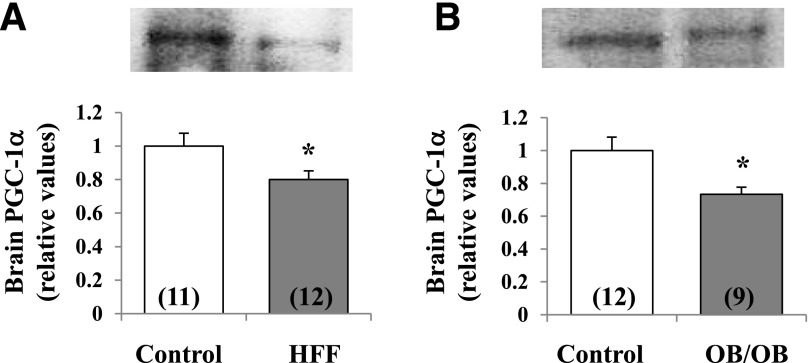
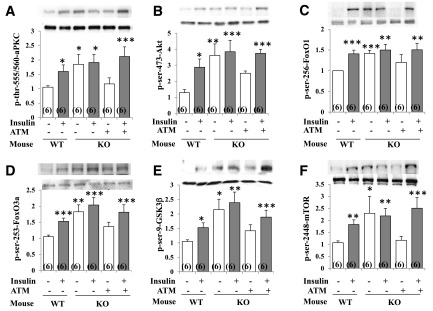
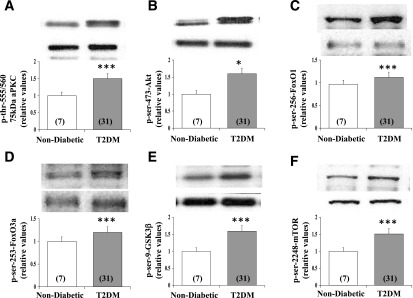
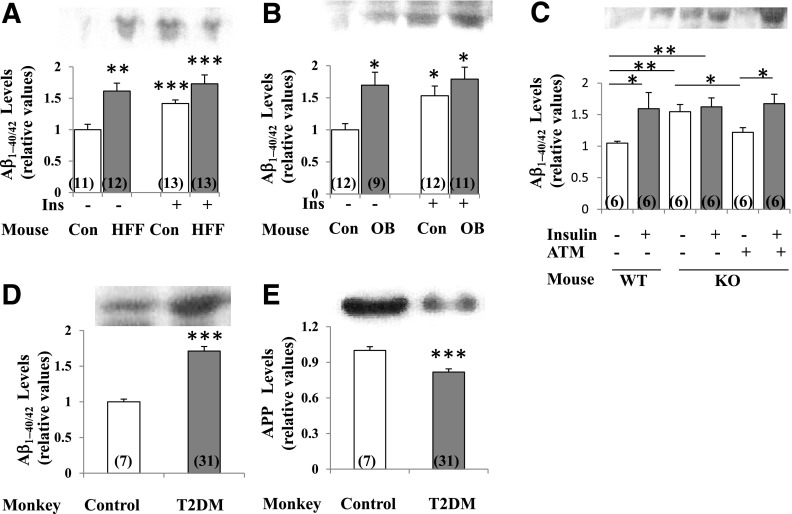
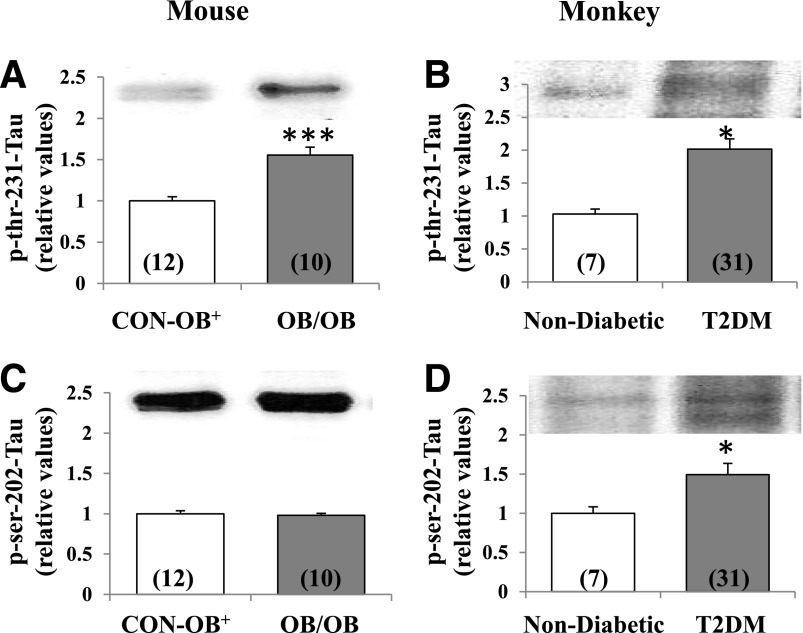
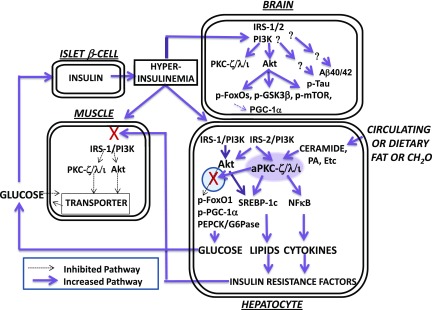
Increased coexistence of Alzheimer disease (AD) and type 2 diabetes mellitus (T2DM) suggests that insulin resistance abets neurodegenerative processes, but linkage mechanisms are obscure. Here, we examined insulin signaling factors in brains of insulin-resistant high-fat-fed mice, ob/ob mice, mice with genetically impaired muscle glucose transport, and monkeys with diet-dependent long-standing obesity/T2DM. In each model, the resting/basal activities of insulin-regulated brain protein kinases, Akt and atypical protein kinase C (aPKC), were maximally increased. Moreover, Akt hyperactivation was accompanied by hyperphosphorylation of substrates glycogen synthase kinase-3β and mammalian target of rapamycin and FOXO proteins FOXO1, FOXO3A, and FOXO4 and decreased peroxisome proliferator-activated receptor γ coactivator-1α (PGC-1α) expression. Akt hyperactivation was confirmed in individual neurons of anterocortical and hippocampal regions that house cognition/memory centers. Remarkably, β-amyloid (Aβ1-40/42) peptide levels were as follows: increased in the short term by insulin in normal mice, increased basally in insulin-resistant mice and monkeys, and accompanied by diminished amyloid precursor protein in monkeys. Phosphorylated tau levels were increased in ob/ob mice and T2DM monkeys. Importantly, with correction of hyperinsulinemia by inhibition of hepatic aPKC and improvement in systemic insulin resistance, brain insulin signaling normalized. As FOXOs and PGC-1α are essential for memory and long-term neuronal function and regeneration and as Aβ1-40/42 and phospho-tau may increase interneuronal plaques and intraneuronal tangles, presently observed aberrations in hyperinsulinemic states may participate in linking insulin resistance to AD.


Figures

Figure 1
Figure 1
Resting/basal and insulin-stimulated phosphorylation/activity of aPKC and Akt (A and B) and phosphorylation of Akt substrates FOXO1, FOXO3a (C and D), GSK3β, and mTOR (E and F) in brains of control (Con), HFF, and ob/ob (OB) mice. Where indicated, mice were treated with insulin (Ins) (1 unit/kg bw i.p.) 15 min before being killed. Representative blots of phosphoproteins (top bands) and unaltered total protein levels (bottom bands) are shown. Portrayed values of phosphoprotein levels are mean ± SEM of (N) mice. **P < 0.01 and ***P < 0.001 for comparison of HFF or OB values to control values (ANOVA).
Figure 2
Figure 2
Phosphorylation/activation of Akt in anterior cortical and hippocampal regions of brains of control (Con) (panels a, d, and g), HFF (panels b, e, and h), and ob/ob (OB) (panels c, f, and i) mice. Pictures show representative examples of (brown) immunostaining of p-Ser-473-Akt: top row, ×10 magnification, anterocortical sagittal sections; middle row, ×60 magnification, anterocortical neurons; and bottom row, ×10 magnification, hippocampus. Portrayed values are mean ± SEM of (N) mice and reflect relative staining of p-Ser-473-Akt per standard area of anterior cortex (j) and hippocampus (k). *P < 0.05, **P < 0.01, and ***P < 0.001 for HFF or ob/ob vs. Con mice (ANOVA).
Figure 3
Figure 3
Diminished levels of PGC-1α in brains of HFF (A) and ob/ob (B) mice. Portrayed values are mean ± SEM of (N) mice. *P < 0.05 for comparison of HFF or OB control mice (ANOVA).
Figure 4
Figure 4
Effects of liver-selective aPKC inhibitor ATM on resting/basal and insulin-stimulated phosphorylation/activity of aPKC and Akt and phosphorylation of Akt substrates FOXO1, FOXO3a, GSK3β, and mTOR in brains of wild-type (WT) control and Het-MλKO (KO) mice. Where indicated, ad libitum–fed mice were treated with insulin (1 unit/kg bw i.p.) 15 min before being killed. Where indicated, Het-MλKO mice were injected once daily for 8 days with aPKC inhibitor ATM (60 mg/kg bw s.c.), which reversed hyperinsulinemia (21). Portrayed values of phosphoproteins are reported as the mean ± SEM of 6 mice. *P < 0.05, **P < 0.01, and ***P < 0.001 (ANOVA) for comparison of values of indicated groups vs. values of the WT control group.
Figure 5
Figure 5
Resting/basal and insulin-stimulated phosphorylation/activity of the 75-kDa aPKC (largely PKC-ι) (A) and Akt (B) and phosphorylation of Akt substrates FOXO1 (C), FOXO3a (D), GSK3β (E), and mTOR (F) in brains of nondiabetic and T2DM monkeys. Portrayed values of phosphoprotein levels are the mean ± SEM of (N) monkeys. *P < 0.05 and ***P < 0.001 for comparison of T2DM and nondiabetic monkeys (ANOVA).
Figure 6
Figure 6
Levels of Aβ1–40/42 peptides in brains of HFF mice (A), ob/ob mice (B), Het-MλKO (KO) mice (C), and T2DM monkeys (D); levels of APP levels in brains of monkeys (E); reversal of basal increases in Aβ1–40/42 peptides by treatment of hepatic aPKC with liver-selective aPKC inhibitor ATM (60 mg/kg bw/day) and reversal of hyperinsulinemia (21) (C); and effects of 15-min insulin treatment (1 unit/kg bw) on Aβ1–40/42 peptide levels in mouse models (AC). Representative blots for 5- to 10-kDa Aβ1–40/42 and 120-kDa APP are shown. Portrayed values of Aβ1–40/42 and APP are the mean ± SEM of (N) mice or monkeys. *P < 0.05, **P < 0.01, and ***P < 0.001 (ANOVA) for comparison of HFF mice, ob/ob mice, or T2DM monkeys to respective controls. Con, control mice; Ins, insulin; OB, ob/ob mice; WT, wild type.
Figure 7
Figure 7
Resting/basal phosphorylation of Thr-231-tau and Ser-202-tau in brains of lean control ob+ (CON-OB+) vs. ob/ob (OB/OB) mice (A and C), and nondiabetic vs. T2DM monkeys (B and D). Portrayed values of phosphoprotein levels are the mean ± SEM of (N) mice or monkeys. *P < 0.05 and ***P < 0.001 (ANOVA) for comparison of ob/ob mice or T2DM monkeys with lean ob+ control mice or nondiabetic monkeys.
Figure 8
Figure 8
Hyperactivation of insulin-dependent signaling factors in brain of mice with DIO and systemic insulin resistance. Note that lipid- and carbohydrate-rich diets provoke increases in hepatic ceramide, which potently activates hepatic aPKC, which thereupon selectively inhibits hepatic Akt-dependent FOXO1 phosphorylation within a subcellular compartment (defined by the presence of scaffolding protein WD40/ProF) shared by Akt and aPKC. As a result, there are increases in hepatic FOXO1 and PGC-1α activity and subsequent expression and abundance of PGC-1α and gluconeogenic enzymes, PEPCK and G6Pase. With increased release of glucose from liver, hyperinsulinemia ensues and stimulates “open” (unblocked) insulin-regulated pathways. Thus, in early stages (as depicted here and further reviewed in the study by Sajan et al. [16]), hyperinsulinemia provokes increases in hepatic Akt activity and further increases in hepatic aPKC activity. These increases in the activities of hepatic Akt and aPKC, in turn, provoke increases in the expression and abundance of hepatic lipogenic enzymes and proinflammatory factors, and these, and/or other liver-derived factors, impair insulin signaling to IRS-1, IRS-1–dependent phosphatidylinositol 3-kinase (PI3K), Akt, and aPKC in muscle, thereby impairing glucose transport and glycogen synthesis therein. In later stages (not depicted here), the activation of hepatic IRS-1, IRS-1–dependent PI3K, and Akt diminishes (also secondary to, or abetted by, excessive aPKC activity), but, in contrast, the activation of hepatic IRS-2 and IRS-2–dependent PI3K remains intact and contributes to continued hyperactivation of hepatic aPKC. In human hepatocytes, these abnormalities are further heightened by the fact that the expression and abundance of the primate-specific aPKC, PKC-ι, is strongly autostimulated by aPKC itself through a positive-feedback loop that is intensified by insulin and ceramide, thus creating a vicious cycle within the liver. As a result of hyperinsulinemia, the activities of Akt and aPKC are increased in brain, and phosphorylation of FOXO family members and other Akt substrates are similarly increased. As a result of increases in brain FOXO phosphorylation, FOXO activity is diminished, and this leads to decreases in brain PGC-1α activity and levels. Tau phosphorylation is also increased in brains of insulin-resistant mice and monkeys, but the responsible protein kinase remains uncertain. Although not depicted here (but described in the text), tissue-selective inhibition of hepatic aPKC can reverse abnormalities in liver, muscle, and brain. NFκB, nuclear factor-κB; PA, phosphatidic acid.

References

    1. Ford ES, Giles WH, Dietz WH. Prevalence of the metabolic syndrome among US adults: findings from the third National Health and Nutrition Examination Survey. JAMA 2002;287:356–359 - PubMed
    1. Cukierman T, Gerstein HC, Williamson JD. Cognitive decline and dementia in diabetes—systematic overview of prospective observational studies. Diabetologia 2005;48:2460–2469 - PubMed
    1. Ott A, Stolk RP, Hofman A, van Harskamp F, Grobbee DE, Breteler MMB. Association of diabetes mellitus and dementia: the Rotterdam Study. Diabetologia 1996;39:1392–1397 - PubMed
    1. Janson J, Laedtke T, Parisi JE, O’Brien P, Petersen RC, Butler PC. Increased risk of type 2 diabetes in Alzheimer disease. Diabetes 2004;53:474–481 - PubMed
    1. Frölich L, Blum-Degen D, Bernstein HG, et al. . Brain insulin and insulin receptors in aging and sporadic Alzheimer’s disease. J Neural Transm (Vienna) 1998;105:423–438 - PubMed

MeSH terms