. 2016 Apr 15;291(16):8549-64.
doi: 10.1074/jbc.M115.674200. Epub 2016 Feb 19.

Glia Maturation Factor-γ Regulates Monocyte Migration through Modulation of β1-Integrin

Affiliations

Glia Maturation Factor-γ Regulates Monocyte Migration through Modulation of β1-Integrin

Wulin Aerbajinai et al. J Biol Chem. .

Abstract

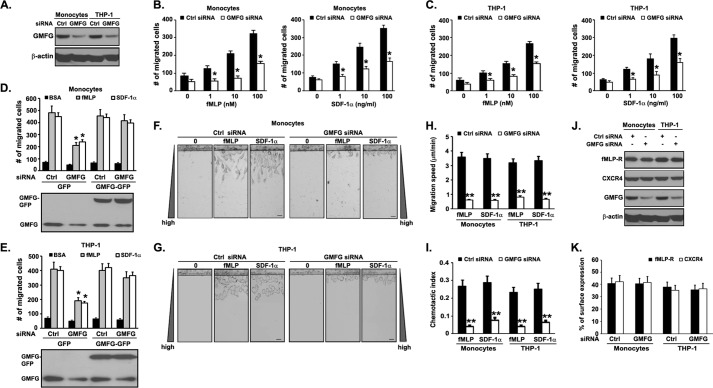
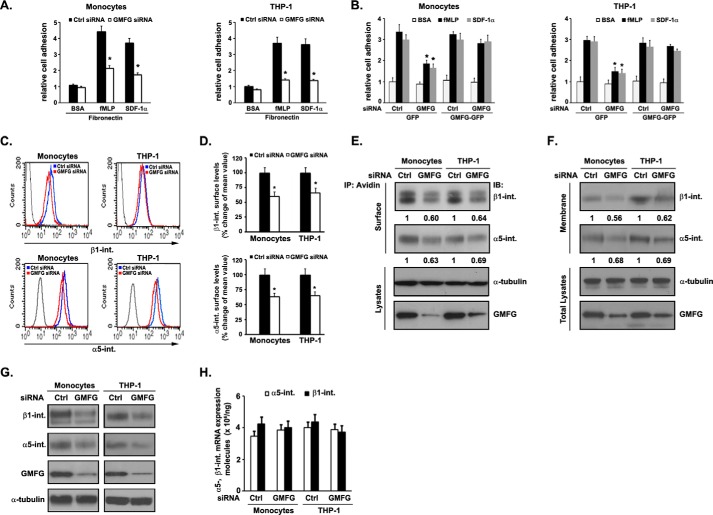
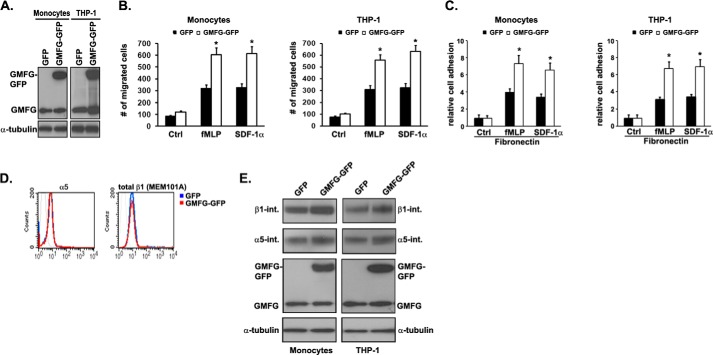
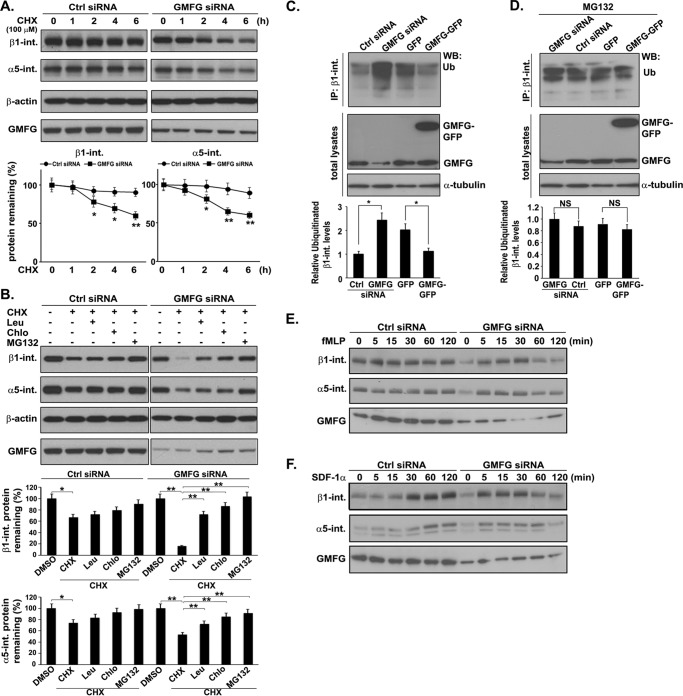
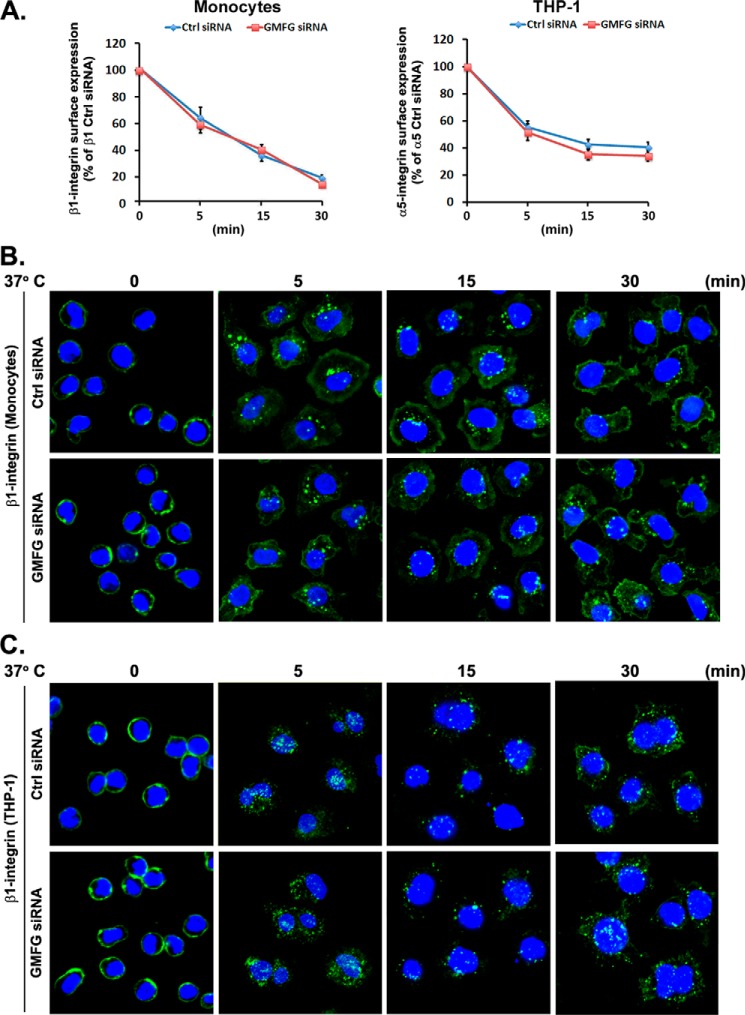
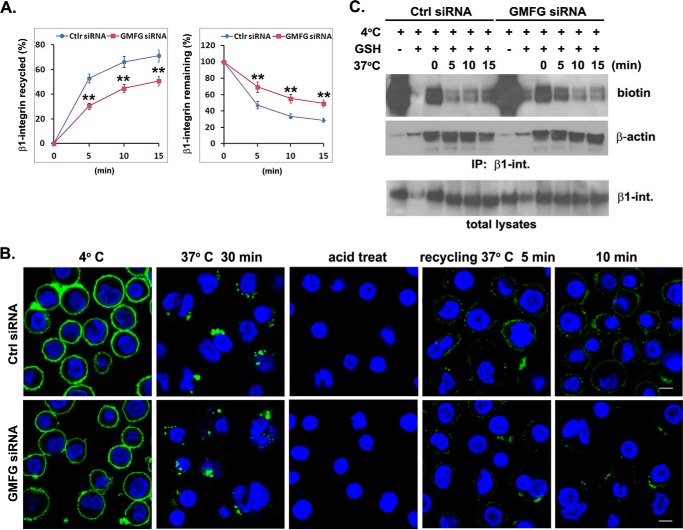
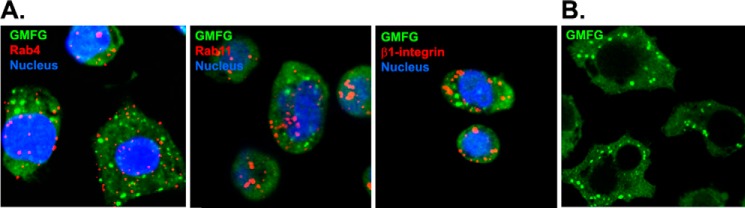
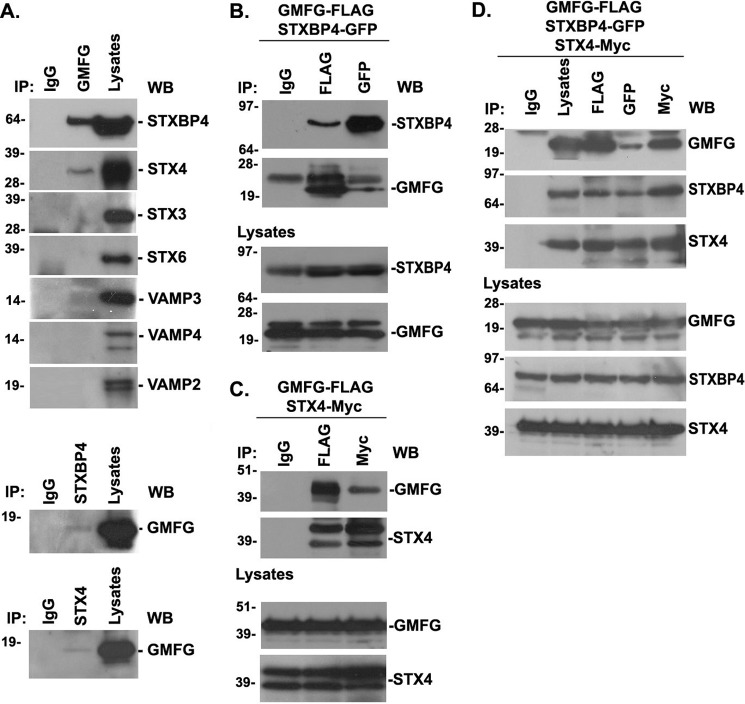
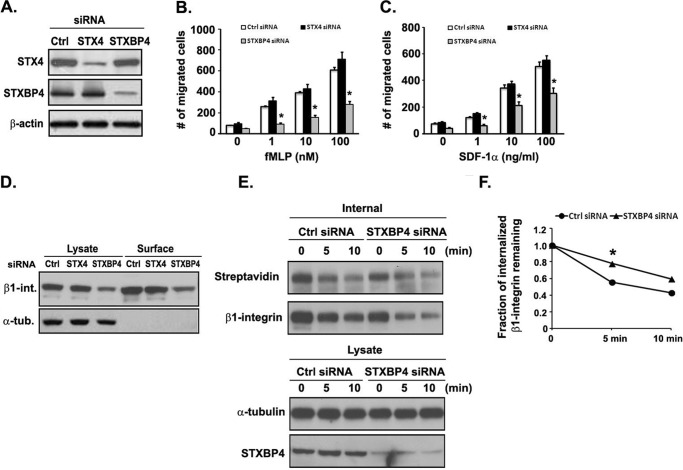
Monocyte migration requires the dynamic redistribution of integrins through a regulated endo-exocytosis cycle, but the complex molecular mechanisms underlying this process have not been fully elucidated. Glia maturation factor-γ (GMFG), a novel regulator of the Arp2/3 complex, has been shown to regulate directional migration of neutrophils and T-lymphocytes. In this study, we explored the important role of GMFG in monocyte chemotaxis, adhesion, and β1-integrin turnover. We found that knockdown of GMFG in monocytes resulted in impaired chemotactic migration toward formyl-Met-Leu-Phe (fMLP) and stromal cell-derived factor 1α (SDF-1α) as well as decreased α5β1-integrin-mediated chemoattractant-stimulated adhesion. These GMFG knockdown impaired effects could be reversed by cotransfection of GFP-tagged full-length GMFG. GMFG knockdown cells reduced the cell surface and total protein levels of α5β1-integrin and increased its degradation. Importantly, we demonstrate that GMFG mediates the ubiquitination of β1-integrin through knockdown or overexpression of GMFG. Moreover, GMFG knockdown retarded the efficient recycling of β1-integrin back to the plasma membrane following normal endocytosis of α5β1-integrin, suggesting that the involvement of GMFG in maintaining α5β1-integrin stability may occur in part by preventing ubiquitin-mediated degradation and promoting β1-integrin recycling. Furthermore, we observed that GMFG interacted with syntaxin 4 (STX4) and syntaxin-binding protein 4 (STXBP4); however, only knockdown of STXBP4, but not STX4, reduced monocyte migration and decreased β1-integrin cell surface expression. Knockdown of STXBP4 also substantially inhibited β1-integrin recycling in human monocytes. These results indicate that the effects of GMFG on monocyte migration and adhesion probably occur through preventing ubiquitin-mediated proteasome degradation of α5β1-integrin and facilitating effective β1-integrin recycling back to the plasma membrane.

Keywords: Arp2/3 complex; adhesion; cell migration; endocytosis; glia maturation factor-gamma (GMFG); integrin; ubiquitylation (ubiquitination).


Figures

FIGURE 1.
FIGURE 1.
GMFG knockdown reduces chemotaxis in human monocytes. A, knockdown efficiency of GMFG siRNA in monocytes or THP-1 cells. Cells were transfected with a control negative siRNA (Ctrl) or GMFG siRNA, and lysates were examined by Western blotting. β-Actin was used as a loading control. B and C, Transwell migration assays were performed on 5-μm pore filters coated with 10 μg/ml FN in primary human monocytes (B) or THP-1 cells (C) transfected with control negative siRNA (Ctrl siRNA) or GMFG siRNA in response to vehicle alone (0.1% BSA) or increasing concentrations of fMLP (1–100 nm) or SDF-1α (1–100 ng/ml). The number of migrated cells was quantitated after 3 h, as described under “Experimental Procedures.” D and E, Transwell migration assays were performed in human monocytes or THP-1 cells cotransfected with control negative siRNA (Ctrl siRNA) or GMFG siRNA and GFP vector or GFP-GMFG vector in response to vehicle alone (0.1% BSA) or fMLP (100 nm) or SDF-1α (100 ng/ml). The number of migrated cells was quantitated after 3 h, as described under “Experimental Procedures.” F–I, EZ-TAXIScan chemotaxis toward fMLP (100 nm) or SDF-1α (100 ng/ml) in human monocytes or THP-1 cells transfected with control negative siRNA or GMFG siRNA. F and G, representative images of migrating cells in a gradient of fMLP or SDF-1α after 3 h. Scale bars, 20 μm. Data are representative of three experiments. H and I, migration speed and chemotactic index were quantified from the captured images during the course of the EZ-TAXIScan chemotaxis assay, as described under “Experimental Procedures.” J, cell surface expression of fMLP receptor (fMLP-R) or chemokine receptor CXCR4 in control negative siRNA- or GMFG siRNA-transfected human monocytes or THP-1 cells. Cells were stained with polyclonal anti-fMLP receptor or anti-CXCR4 antibodies for 1 h at 4 °C. After washing, the cells were labeled with Alexa Fluor 488-conjugated goat anti-rabbit secondary antibody and subjected to flow cytometry analysis. K, Western blotting analysis of GMFG, fMLP receptor, and chemokine receptor CXCR4 expression in whole-cell lysates from monocytes or THP-1 cells transfected with control negative siRNA or GMFG siRNA. β-Actin was used as a loading control. Data represent the mean ± S.D. (error bars) from three independent experiments. *, p < 0.05 compared with control siRNA-transfected cells. **, p < 0.01 compared with control siRNA-transfected cells.
FIGURE 2.
FIGURE 2.
GMFG knockdown decreases chemoattractant-stimulated cell adhesion to FN and cell surface expression of α5β1-integrin in human monocytes. Human monocytes or THP-1 cells were transfected with control negative siRNA (Ctrl siRNA) or GMFG siRNA for 48 h. A, siRNA-transfected human monocytes or THP-1 cells were subjected to adhesion assays on 10 μg/ml FN-coated wells (in triplicate samples) in the absence (Ctrl) or presence of fMLP (100 nm) or SDF-1α (100 ng/ml). Values were calculated as -fold increase over levels in unstimulated cells treated with control negative siRNA. Each assay was performed in triplicate. Data represent the mean ± S.D. (error bars). *, p < 0.05 compared with control siRNA-transfected cells. B, human monocytes or THP-1 cells were cotransfected with control negative siRNA or GMFG siRNA and GFP vector or GFP-GMFG vector and then subjected to an in vitro adhesion assay on 10 μg/ml FN-coated wells (in triplicate samples) in the absence or presence of 100 nm fMLP or 100 ng/ml SDF-1α. Values were calculated as -fold increase over levels in unstimulated cells treated with control negative siRNA. Data represent three independent experiments and are expressed as the mean ± S.D. *, p < 0.05 compared with control negative siRNA-transfected cells. C, representative flow cytometry results for cell surface expression of β1-integrin (top panels) or α5-integrin (bottom panels) in siRNA-transfected human monocytes or THP-1 cells. Cells were labeled with antibodies to β1-integrin (both the active and inactive forms, MEM101A) or α5-integrin (NKI-SAM1) for 1 h at 4 °C, followed by incubation with Alexa Fluor 488-conjugated goat anti-mouse secondary antibody, and then subjected to flow cytometry analysis. D, quantification of integrin cell surface expression flow cytometry results as in C. Data represent the mean fluorescence intensity ± S.D. of three independent experiments. *, p < 0.05 compared with control siRNA-transfected cells. E, cell surface-biotinylated β1-integrin or α5-integrin in siRNA-transfected human monocytes or THP-1 cells. Surface-biotinylated proteins were precipitated using avidin beads, followed by Western blotting analysis with β1-integrin (MAB2000) or α5-integrin (4705P, Cell Signaling) antibodies (top panels). 20% input total cell lysates were analyzed by Western blotting analysis of α-tubulin or GMFG (bottom panels). α-Tubulin was used as a loading control. The densitometric analysis of the relative quantification of β1- and α5-integrin signal intensities (normalized to control siRNA-transfected integrin signal set at 1) is shown below each blot. F, plasma membrane expression of β1- or α5-integrin in siRNA-transfected monocytes or THP-1 cells. The plasma membrane fraction of cells was isolated and then subjected to Western blotting analysis with β1-integrin (MAB2000) or α5-integrin (4705P, Cell Signaling) antibodies (top panels). 20% input total cell lysates were analyzed by Western blotting analysis of α-tubulin or GMFG (bottom panels). α-Tubulin was used as a loading control. The densitometric analysis of the relative quantification of β1- and α5-integrin signal intensities (normalized to control siRNA-transfected integrin signal set at 1) is shown below each blot. G, Western blotting analysis of β1-integrin, α5-integrin, and GMFG expression in whole-cell lysates from siRNA-transfected monocytes or THP-1 cells. α-Tubulin was used as a loading control. H, quantitative PCR analysis of the expression of α5-integrin and β1-integrin transcripts in control siRNA- or GMFG siRNA-transfected human monocytes or THP-1 cells. Data represent the mean ± S.D. of three independent experiments. IP, immunoprecipitation.
FIGURE 3.
FIGURE 3.
GMFG overexpression enhances chemoattractant-stimulated cell migration and adhesion to FN. Human monocytes or THP-1 cells were transfected with GFP vector or GFP-tagged GMFG plasmid for 48 h. A, Western blotting analysis of expression of GMFG or GMFG-GFP in monocytes or THP-1 cells. α-Tubulin was used as a loading control. B, Transwell migration assays were performed on 5-μm pore filters coated with 10 μg/ml FN in transfected primary human monocytes or THP-1 cells in the absence (Ctrl) or presence of fMLP (100 nm) or SDF-1α (100 ng/ml). The number of migrated cells was quantitated after 3 h, as described under “Experimental Procedures.” Data represent the mean ± S.D. (error bars). *, p < 0.05 compared with control GFP-transfected cells. C, transfected human monocytes or THP-1 cells were subjected to adhesion assays on 10 μg/ml FN-coated wells (in triplicate samples) in the absence or presence of fMLP (100 nm) or SDF-1α (100 ng/ml). The number of attached cells was quantitated after 15 min, as described under “Experimental Procedures.” Data represent the mean ± S.D. *, p < 0.05 compared with control GFP-transfected cells. D, representative flow cytometry results for cell surface expression of α5- or β1-integrins in GFP- or GMFG-GFP-transfected human monocytes. Monocytes were incubated with antibodies to α5-integrin or β1-integrin (both the active and inactive forms, MEM101A) for 1 h at 4 °C. After washing, the cells were labeled with Alexa Fluor 488-conjugated goat anti-mouse secondary antibody and subjected to flow cytometry analysis. E, Western blotting analysis of α5-integrin or β1-integrin in whole-cell lysates from GFP- or GMFG-GFP-transfected monocytes or THP-1 cells. α-Tubulin was used as a loading control.
FIGURE 4.
FIGURE 4.
GMFG knockdown enhances degradation of α5- and β1-integrin in human monocytes. A and B, α5-integrin and β1-integrin degradation in GMFG knockdown cells. Human monocytes were transfected with control negative siRNA (Ctrl siRNA) or GMFG siRNA for 48 h. siRNA-transfected cells were treated with 100 μm cycloheximide (CHX) for the indicated time periods (A) or with cycloheximide (100 μm) for 6 h in the presence of DMSO, the lysosomal inhibitors leupeptin (Leu; 500 μg/ml) or chloroquine (Chlo; 10 μm), or the proteasomal inhibitor MG132 (10 μm), as indicated. Relative quantification of degradation of β1- and α5-integrin is shown in the bottom panels. The signal intensities of β1- and α5-integrin were standardized to the signal intensity of β-actin and normalized to 100% at time 0. Data represent the mean ± S.D. (error bars) of three independent experiments. *, p < 0.05 compared with control siRNA-transfected cells. **, p < 0.01 compared with control siRNA-transfected cells. B, total cell lysates were subjected to Western blotting analysis using anti-α5- and β1-integrin antibody. β-Actin was used as a loading control. Relative quantification of degradation of β1- and α5-integrin is shown in the lower panels. Data represent the mean ± S.D. of three independent experiments. *, p < 0.05 compared with control siRNA-transfected cells. **, p < 0.01 compared with control siRNA-transfected cells. C and D, THP-1 cells were transfected with control negative siRNA or GMFG siRNA and GFP vector or GFP-GMFG vector for 48 h and then treated with DMSO (C) or 10 μm MG132 for an additional 2 h (D). The cell lysates were immunoprecipitated with anti-β1-integrin antibody, and ubiquitinated β1-integrin was detected by Western blotting using anti-ubiquitin antibody. Relative quantification of ubiquitinated β1-integrin levels is shown in the bottom panels. Data represent the mean ± S.D. of three independent experiments. *, p < 0.05 compared with control siRNA-transfected cells. NS, no statistical significance. E and F, stability of α5- and β1-integrin after fMLP (E) or SDF-1α (F) stimulation of GMFG knockdown cells. siRNA-transfected human monocytes were treated with fMLP (100 nm) or SDF-1α (100 ng/ml) for the indicated time periods. Total cell lysates were subjected to Western blotting analysis using anti-α5- and β1-integrin antibody. GMFG was used as a loading control.
FIGURE 5.
FIGURE 5.
GMFG knockdown does not affect β1-integrin endocytosis. Human monocytes or THP-1 cells were transfected with control negative siRNA(Ctrl siRNA) or GMFG siRNA. Forty-eight h after transfection, cell surface β1-integrin was labeled with anti-β1-integrin antibody at 4 °C for 1 h, followed by incubation of cells at 37 °C for the indicated time periods to induce internalization. A, analysis of β1-integrin internalization in siRNA-transfected human monocytes or THP-1 cells by flow cytometry. Surface-labeled cells were stained with Alexa Fluor 488-conjugated secondary antibody at 4 °C, followed by quantification of surface-remaining β1-integrin. Results are shown as the percentage of the integrin surface expression observed in control negative siRNA-transfected cells before internalization (i.e. the 0-min time point was set at 100%). Data represent the mean ± S.D. (error bars) of three experiments. B and C, analysis of β1-integrin internalization in siRNA-transfected human monocytes (B) or THP-1 cells (C) by immunofluorescence. Cells with surface-labeled β1-integrin were incubated at 37 °C for the indicated time periods to induce internalization, followed by stripping of surface-bound antibody by acid washing. Cells were then fixed, permeabilized, and stained with Alexa Fluor 488-conjugated secondary antibody at 4 °C. Nuclear DNA was labeled with DAPI (blue). Scale bars, 100 μm.
FIGURE 6.
FIGURE 6.
GMFG knockdown inhibits efficient β1-integrin recycling to the cell surface of human monocytes. A and B, human monocytes were transfectedwith control negative siRNA (Ctrl siRNA) or GMFG siRNA. Forty-eight h after transfection, cell surface β1-integrin was labeled with anti-β1-integrin antibody at 4 °C, followed by incubation of cells at 37 °C for 30 min to induce internalization. Cells were then acid-washed to remove the remaining surface-bound labeled integrin antibody, and the internalized β1-integrin was chased back to the cell surface at 37 °C for the indicated time periods. A, antibody-based assay of β1-integrin recycling. Cells were stained with Alexa Fluor 488-conjugated secondary antibody at 4 °C, followed by quantification of surface β1-integrin by flow cytometry. Data represent the mean ± S.D. (error bars) of three experiments. **, p < 0.01 compared with control siRNA-transfected cells. B, immunofluorescence-based assay of β1-integrin recycling. Cells were stained with Alexa Fluor 488-conjugated secondary antibody without permeabilization to examine β1-integrin trafficking back to the cell surface. Nuclear DNA was labeled with DAPI (blue). Scale bar, 100 μm. C, biotinylation-based assay of β1-integrin recycling. Monocytes transfected with control negative siRNA or GMFG siRNA were surface-labeled with 0.5 mg/ml sulfo-NHS-SS-biotin at 4 °C for 1 h, and then internalization was induced at 37 °C for 30 min. Cells were exposed to GSH solution at 4 °C to remove surface biotin and then chased at 37 °C for the indicated time periods to allow recycling, followed by a second reduction with glutathione. Biotinylated cell surface proteins remaining inside the cells were immunoprecipitated using an anti-β1-integrin antibody and subsequently detected by Western blotting analysis using an anti-biotin or anti-β-actin antibody. Samples of the total lysates are shown in the bottom panel; each sample corresponds to 5% of the cell lysate used in each immunoprecipitation. The blots are representative of three independent experiments. β-Actin was used as a loading control.
FIGURE 7.
FIGURE 7.
The localization of GMFG in human monocytes. Human monocytes were seeded on FN-coated chambered coverglass for 20 min. Attached cells were fixed with 4% paraformaldehyde, permeabilized with 0.1% Triton X-100, and stained with the indicated antibodies. A, confocal images show endogenous GMFG (green), Rab4 or Rab11 (red) (rapid and slow recycling markers), or β1-integrin (red) and nuclear DNA (blue; DAPI) in human monocytes. B, confocal images show GMFG distribution in human monocytes. Scale bar, 10 μm.
FIGURE 8.
FIGURE 8.
GMFG interacts with STXBP4 and STX4 in human monocytes. A, endogenous GMFG was immunoprecipitated (IP) from THP-1 cells, and precipitates were analyzed by Western blotting (WB) using anti-STXBP4, anti-STX, or anti-VAMP antibodies as indicated (top panel). Endogenous STXBP4 and STX4 were immunoprecipitated from THP-1 cells, and precipitates were analyzed by Western blotting using anti-GMFG antibody (bottom panel). Samples of the total lysate are shown in the right lane, and nonspecific mouse IgG was used as a negative control. B and C, HEK-293T cells were cotransfected with FLAG-tagged GMFG and GFP-tagged STXBP4 (B) or FLAG-tagged GMFG and Myc-tagged STX4 (C). Forty-eight h after transfection, cells were harvested and immunoprecipitated with anti-FLAG, anti-GFP, or anti-Myc antibodies, and precipitates were analyzed by Western blotting with anti-GMFG, anti-STXBP4, or anti-STX4 antibodies. Samples of the total lysates are shown in the bottom panel; each sample corresponds to 5% of the cell lysate used in each immunoprecipitation. D, HEK-293T cells were cotransfected with FLAG-tagged GMFG, GFP-tagged STXBP4, and Myc-tagged STX4. Forty-eight h after transfection, cells were harvested and immunoprecipitated with anti-FLAG, anti-GFP, or anti-Myc antibodies and analyzed by Western blotting with anti-GMFG, anti-STXBP4, or anti-STX4 antibodies. Samples of the total lysates are shown in the bottom panel; each sample corresponds to 5% of the cell lysate used in each immunoprecipitation.
FIGURE 9.
FIGURE 9.
Knockdown of STXBP4 inhibits human monocyte migration and is correlated with inefficient β1-integrin recycling to the cell surface. A, knockdown efficiency of STXBP4 and STX4 siRNA in THP-1 cells. Cells were transfected with a control negative siRNA (Ctrl), STX4 siRNA, or STXBP4 siRNA, and lysates were examined by Western blotting. β-Actin was used as a loading control. B and C, Transwell migration assays were performed on 5-μm pore filters coated with 10 μg/ml FN in THP-1 cells transfected with control negative siRNA (Ctrl siRNA), STXBP4 siRNA, or STX4 siRNA in response to vehicle alone (0.1% BSA) or increasing concentrations of fMLP (1–100 nm) or SDF-1α (1–100 ng/ml). The number of migrated cells was quantitated after 3 h, as described under “Experimental Procedures.” Data represent the mean ± S.D. (error bars) of at least three independent experiments. *, p < 0.05 compared with control siRNA-transfected cells. D, THP-1 cells transfected with the indicated siRNAs were surface-labeled with 0.5 mg/ml sulfo-NHS-SS-biotin at 4 °C for 1 h. Surface-biotinylated proteins were then isolated using streptavidin beads, followed by Western blotting analysis of β1-integrin. α-Tubulin was used as a loading control. E, biotinylation-based assay of β1-integrin recycling. THP-1 cells transfected with the indicated siRNAs were biotinylated and allowed to internalize surface proteins for 30 min at 37 °C. Surface biotin was removed by reduction (glutathione solution), and internalized proteins were chased at 37 °C for the indicated time periods to allow recycling back to the surface. Surface biotin was reduced again, and cells were lysed. Top, biotinylated cell surface proteins remaining inside the cells were immunoprecipitated using an anti-β1-integrin antibody and subsequently detected by Western blotting analysis using streptavidin-HRP or β1-integrin antibody. Bottom, samples of the total lysates; each sample corresponds to 5% of the cell lysate used in each immunoprecipitation. Shown is a representative Western blot of one experiment (n = 3). α-Tubulin was used as a loading control. F, quantification of β1-integrin recycling determined by densitometry signal as in E. The fraction of internalized β1-integrin remaining was quantified from the signal intensity of internalized protein at each time point relative to control siRNA-transfected cells that had not been placed at 37 °C after the first surface reduction.

Similar articles

Cited by

References

    1. Ley K., Laudanna C., Cybulsky M. I., and Nourshargh S. (2007) Getting to the site of inflammation: the leukocyte adhesion cascade updated. Nat. Rev. Immunol. 7, 678–689 - PubMed
    1. Wong C. H., Heit B., and Kubes P. (2010) Molecular regulators of leucocyte chemotaxis during inflammation. Cardiovasc. Res. 86, 183–191 - PubMed
    1. Herter J., and Zarbock A. (2013) Integrin regulation during leukocyte recruitment. J. Immunol. 190, 4451–4457 - PubMed
    1. Steeber D. A., and Tedder T. F. (2000) Adhesion molecule cascades direct lymphocyte recirculation and leukocyte migration during inflammation. Immunol. Res. 22, 299–317 - PubMed
    1. Chuluyan H. E., Schall T. J., Yoshimura T., and Issekutz A. C. (1995) IL-1 activation of endothelium supports VLA-4 (CD49d/CD29)-mediated monocyte transendothelial migration to C5a, MIP-1α, RANTES, and PAF but inhibits migration to MCP-1: a regulatory role for endothelium-derived MCP-1. J. Leukoc. Biol. 58, 71–79 - PubMed

Publication types

MeSH terms

LinkOut - more resources