. 2016 Apr 22;291(17):9060-72.
doi: 10.1074/jbc.M115.710533. Epub 2016 Feb 19.

Synchrotron Infrared and Deep UV Fluorescent Microspectroscopy Study of PB1-F2 β-Aggregated Structures in Influenza A Virus-infected Cells

Affiliations

Synchrotron Infrared and Deep UV Fluorescent Microspectroscopy Study of PB1-F2 β-Aggregated Structures in Influenza A Virus-infected Cells

Christophe Chevalier et al. J Biol Chem. .

Abstract

PB1-F2 is a virulence factor of influenza A virus (IAV) whose functions remain misunderstood. The different roles of PB1-F2 may be linked to its structural polymorphism and to its propensity to assemble into oligomers and amyloid fibers in the vicinity of the membrane of IAV-infected cells. Here, we monitored the impact of PB1-F2 on the biochemical composition and protein structures of human epithelial pulmonary cells (A549) and monocytic cells (U937) upon IAV infection using synchrotron Fourier-transform infrared (FTIR) and deep UV (DUV) microscopies at the single-cell level. Cells were infected with a wild-type IAV and its PB1-F2 knock-out mutant for analyses at different times post-infection. IR spectra were recorded in each condition and processed to evaluate the change in the component band of the spectra corresponding to the amide I (secondary structure) and the CH stretching region (membrane). The IR spectra analysis revealed that expression of PB1-F2 in U937 cells, but not in A549 cells, results in the presence of a specific β-aggregate signature. Furthermore, the lipid membrane composition of U937 cells expressing PB1-F2 was also altered in a cell type-dependent manner. Using DUV microscopy and taking advantage of the high content of tryptophan residues in the sequence of PB1-F2 (5/90 aa), we showed that the increase of the autofluorescent signal recorded in monocytic cells could be correlated with the IR detection of β-aggregates. Altogether, our results constitute an important step forward in the understanding of the cell type-dependent function of PB1-F2.

Keywords: Fourier transform IR (FTIR); amyloid; fluorescence imaging; influenza virus; membrane; microscopy; oligomerization; synchrotron radiation experiment.


Figures

FIGURE 1.
FIGURE 1.
SOLEIL synchrotron FTIR and DUV set up and experiments. A, A549 or U937 cells were infected with IAV virus expressing (WT) or not PB1-F2 (F2), fixed at various times post-infection and collected prior to observation by IR or DUV microscopy. B, the image shows the Continuum XL microscope (Thermo Fisher Scientific) used for FTIR microspectroscopic analysis performed on the SMIS beamline. C, transmission image representing IAV-infected A549 cells observed with the Continuum XL microscope before recording the IR spectra. Each annotated red cross corresponds to the acquisition of one single cell IR spectrum. D, recorded IR spectra in the 3500–1000 cm−1 region. Spectra were standardized and pre-treated before multivariate statistical analysis. E, the image shows the Telemos full field microscope used to record the Trp fluorescence of IAV-infected cells in the DUV with the DISCO beamline. F, transmission image in bright field microscopy (left image) and DUV fluorescent microscopy (right image) of IAV-infected U937 cells are presented.
FIGURE 2.
FIGURE 2.
Infrared spectra preprocessing procedure. Top left, raw spectra, top right, filtered spectra (to remove background disturbed spectra), and bottom, 2nd derivative Savitzky-Golay spectra (9 pts, 2 order) and unit vector normalized. A close-up view on CH stretching and the Amide I region are shown in the bottom panel.
FIGURE 3.
FIGURE 3.
Synchrotron IR microspectroscopy comparison between the secondary structure contents of mock, WT-, and F2-infected U937 cells at 8 h post-infection within the amide I region. A, score plot of PCA from the 1700–1600 cm−1 band IR spectra. The explained variance for PC1 and PC2 is 54 and 13%, respectively. Marked data with the pink triangle correspond to U937 cells infected with WT virus, gray circle to cells infected with F2, and white square to mock-infected cells. B, loading plot linking the variable space and principal component subspace (PC2). PCA score plots show that the WT and F2-mock groups separate along PC2. Compared with mock and F2 groups, the WT group shows higher IR intensity at 1631–1693 cm−1 bands attributed to aggregated β-sheet structures and at the 1678 cm−1 band assigned to turns structures. PC, principal component.
FIGURE 4.
FIGURE 4.
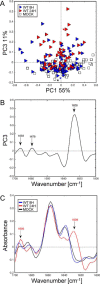
Synchrotron IR microspectroscopy comparison between the secondary structure content of mock and WT-infected U937 cells at 8 and 24 h post-infection within the amide I region. A, score plot of PCA from the 1700–1600 cm−1 band IR spectra. The explained variance for PC1 and PC3 is 55 and 11%, respectively. Marked data with the white square corresponds to mock-infected cells and blue and red triangles correspond to cells infected with WT virus at 8 and 24 h post-infection, respectively. B, loading plot linking the variable space and principal component subspace (PC3). PCA score plots show that the WT and mock groups separate along PC3. Compared with the mock group, WT groups show higher IR intensity at 1628–1693 cm−1 bands attributed to aggregated β-sheet structures. C, marked points second derivative spectra: mock-infected cells (black line) and WT-infected cells at 8 (blue line) and 24 h (red line) post-infection in the range 1700–1600 cm−1. A progressive shift from 1643 cm−1 (unordered β-sheet structure) to 1628 cm−1 was observed in a time-dependent manner for WT-infected cells 2nd derivative spectra compared with mock-infected cells. PC, principal component.
FIGURE 5.
FIGURE 5.
Synchrotron IR microspectroscopy comparison between secondary structure content of mock, WT, and F2-infected A549 cells at 24 h post-infection within the amide I region. A, score plot of PCA from the 1720–1580 cm−1 band IR spectra. The explained variance for PC1 and PC2 is 37 and 18%, respectively. Marked data with a red triangle correspond to A549 cells infected with WT virus, black circle to cells infected with PB1-F2 knocked out virus, and white square to mock-infected cells. B, loading plot linking the variable space and principal component subspace (PC1). PCA score plots show that the WT and F2 groups separate from the mock group along PC1. Compared with the mock group, WT and F2 groups show higher IR intensity at 1631 cm−1 bands attributed to β-sheet structures and at the 1653 cm−1 band assigned to α-helical structures. PC, principal component.
FIGURE 6.
FIGURE 6.
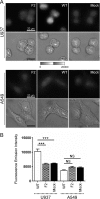
Synchrotron deep UV microspectroscopy comparison of fluorescence intensity between mock, WT, and F2-infected cells at 8 h post-infection within the 300–380 nm emission range. A, U937 (top panel) and A549 (bottom panel) cells were infected and observed at 8 h post-infection. For each condition, WT, F2, and mock-infected cells, the fluorescent image obtained by the DUV fluorescent microscope within the 300–380 nm emission range (top) and its corresponding image obtained by transmission microscopy (bottom) are presented. Cells were observed with a ×100 objective. The greyscale was the same for all the fluorescent images. Bars = 20 μm. B, comparison of the fluorescence intensity measured in mock, WT, and F2-infected cells. Fluorescence intensity were quantified using ImageJ software and normalized to the surface area of the cells. Data are expressed as mean ± S.E. by an analysis of variance test. ***, p < 0.001, NS, not significant.
FIGURE 7.
FIGURE 7.
Visualization of cytopathic effect provoked by IAV infection at 24 h post-infection. U937 and A549 IAV-infected cells show a strong cytopathic effect compared with HeLa cells. Cells were observed by transmission microscopy in the bright field using a ×100 objective. Bars = 20 μm.
FIGURE 8.
FIGURE 8.
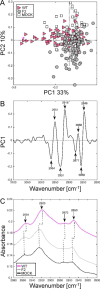
Synchrotron IR microspectroscopy comparison of mock, WT, and F2-infected U937 cells at 8 h post-infection within the CH region. A, score plot of PCA from the 3100–2800 cm−1 band IR spectra. The explained variance for PC1 and PC2 is 33 and 10%, respectively. Marked data with pink triangles correspond to U937 cells infected with WT virus, gray circle to cells infected with F2 virus, and white square to mock-infected cells. B, loading plot linking the variable space and principal component subspace (PC1). PCA score plots show that the WT and F2-mock groups separate along PC1. C, mean IR spectra of mock-infected cells (black line), WT (pink line), and F2-infected cells (gray line) at 8 h post-infection in the 2980–2800 cm−1 range. A shift for the principal peaks corresponding to CH2-CH3 stretching (2954, 2920, and 2850 cm−1) associated to perturbation of membrane fluidity was observed for WT-infected cells spectra compared with mock and F2-infected cells. PC, principal component.
FIGURE 9.
FIGURE 9.
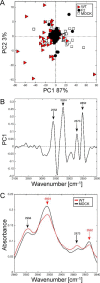
Synchrotron IR microspectroscopy comparison of mock, WT, and F2-infected A549 cells at 24 h post-infection within the CH region. A, score plot of PCA from the 3100–2800 cm−1 band IR spectra. The explained variance for PC1 and PC2 is 87 and 3%, respectively. Marked data with a red triangle correspond to A549 cells infected with WT virus, black circles to cells infected with F2 virus, and white squares to mock-infected cells. B, loading plot linking the variable space and principal component subspace (PC1). PCA score plots show that the WT and F2-mock groups separate along PC1. C, mean IR spectra of mock-infected cells (black line) and WT-infected cells (red line) at 24 h post-infection in the 2980–2840 cm−1 range. The bands assigned to CH3 symmetric/asymmetric (2958 and 2873 cm−1, respectively) were more intense for WT-infected cells than for mock-infected cells. The contrary was observed for bands assigned to CH2 symmetric/asymmetric (2924 and 2852 cm−1, respectively). PC, principal component.

Similar articles

Cited by

References

    1. World Health Organization (2014) Global Influenza Surveillance and Response System (GISRS), http://www.who.int/influenza/gisrs_laboratory/en
    1. Kawaoka Y. (ed) (2006) Influenza Virology: Current Topics, Caister Academic Press, Wymondham
    1. Wise H. M., Foeglein A., Sun J., Dalton R. M., Patel S., Howard W., Anderson E. C., Barclay W. S., and Digard P. (2009) A complicated message: identification of a novel PB1-related protein translated from influenza A virus segment 2 mRNA. J. Virol. 83, 8021–8031 - PMC - PubMed
    1. Pasricha G., Mishra A. C., and Chakrabarti A. K. (2013) Comprehensive global amino acid sequence analysis of PB1F2 protein of influenza A H5N1 viruses and the influenza A virus subtypes responsible for the 20th-century pandemics. Influenza Other Respir. Viruses 7, 497–505 - PMC - PubMed
    1. Zell R., Krumbholz A., Eitner A., Krieg R., Halbhuber K. J., and Wutzler P. (2007) Prevalence of PB1-F2 of influenza A viruses. J. Gen. Virol. 88, 536–546 - PubMed

Publication types

MeSH terms