

Genetic analysis of intestinal polyp development in Collaborative Cross mice carrying the Apc (Min/+) mutation
- PMID: 26896154
- PMCID: PMC4761170
- DOI: 10.1186/s12863-016-0349-6
Genetic analysis of intestinal polyp development in Collaborative Cross mice carrying the Apc (Min/+) mutation
Erratum in
-
Erratum to: Genetic analysis of intestinal polyp development in Collaborative Cross mice carrying the Apc Min/+ mutation.BMC Genet. 2016 Nov 24;17(1):147. doi: 10.1186/s12863-016-0456-4. BMC Genet. 2016. PMID: 27884112 Free PMC article. No abstract available.
Abstract
Background: Colorectal cancer is an abnormal tissue development in the colon or rectum. Most of CRCs develop due to somatic mutations, while only a small proportion is caused by inherited mutations. Familial adenomatous polyposis is an inherited genetic disease, which is characterized by colorectal polyps. It is caused by inactivating mutations in the Adenomatous polyposis coli gene. Mice carrying and non-sense mutation in Adenomatous polyposis coli gene at site R850, which designated Apc (R850X/+) (Min), develop intestinal adenomas, while the bulk of the disease is in the small intestine. A number of genetic modifier loci of Min have been mapped, but so far most of the underlying genes have not been identified. In our previous studies, we have shown that Collaborative Cross mice are a powerful tool for mapping loci responsible for phenotypic variation. As a first step towards identification of novel modifiers of Min, we assessed the phenotypic variation between 27 F1 crosses between different Collaborative cross mice and C57BL/6-Min lines.
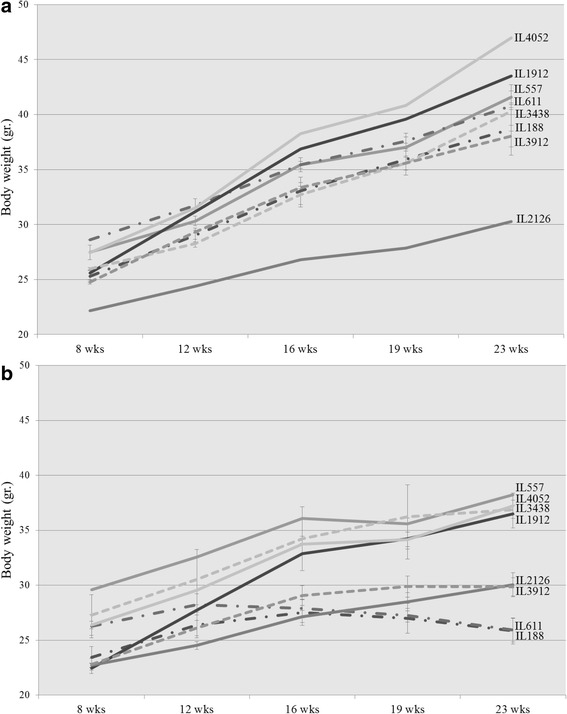
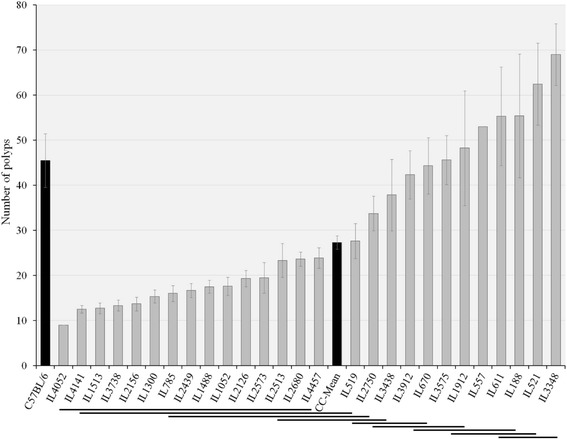
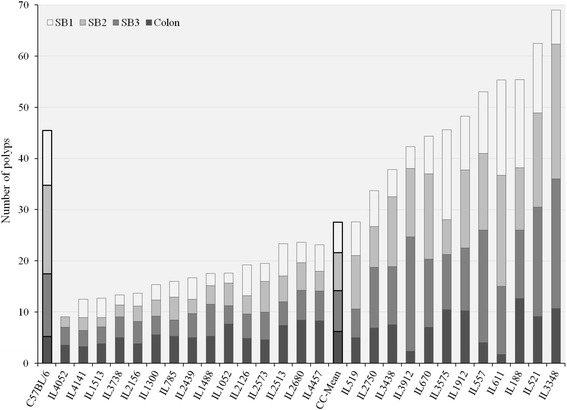
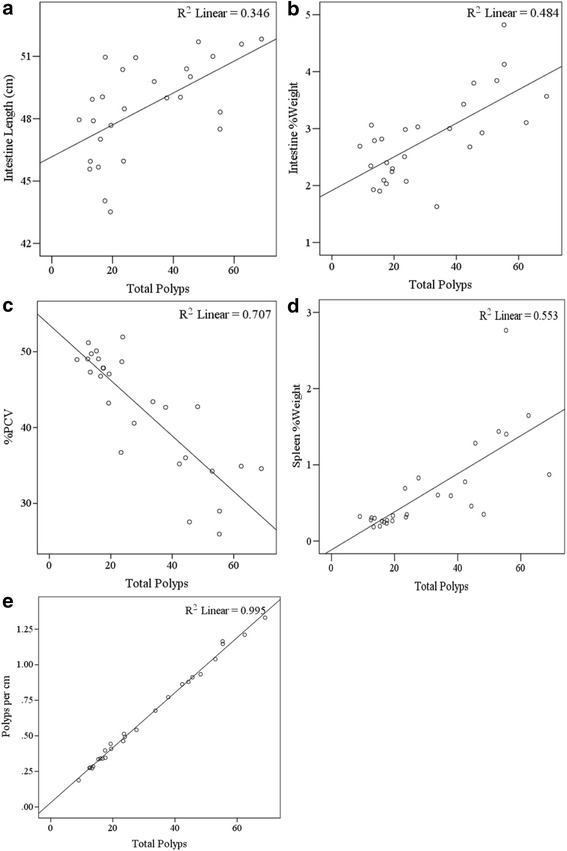
Results: Here, C57BL/6-Min male mice were mated with females from 27 Collaborative cross lines. F1 offspring were terminated at 23 weeks old and multiple phenotypes were collected: polyp counts, intestine length, intestine weight, packed cell volume and spleen weight. Additionally, in eight selected F1 Collaborative cross-C57BL/6-Min lines, body weight was monitored and compared to control mice carry wildtype Adenomatous polyposis coli gene. We found significant (p < 0.05) phenotypic variation between the 27 F1 Collaborative cross-C57BL/6-Min lines for all the tested phenotypes, and sex differences with traits; Colon, body weight and intestine length phenotypes, only. Heritability calculation showed that these phenotypes are mainly controlled by genetic factors.
Conclusions: Variation in polyp development is controlled, an appreciable extent, by genetic factors segregating in the Collaborative cross population and suggests that it is suited for identifying modifier genes associated with Apc (Min/+) mutation, after assessing sufficient number of lines for quantitative trait loci analysis.
Figures
Similar articles
-
Genetic mapping of novel modifiers for ApcMin induced intestinal polyps' development using the genetic architecture power of the collaborative cross mice.BMC Genomics. 2021 Jul 22;22(1):566. doi: 10.1186/s12864-021-07890-x. BMC Genomics. 2021. PMID: 34294033 Free PMC article.
-
Identification of five novel modifier loci of Apc(Min) harbored in the BXH14 recombinant inbred strain.Carcinogenesis. 2012 Aug;33(8):1589-97. doi: 10.1093/carcin/bgs185. Epub 2012 May 24. Carcinogenesis. 2012. PMID: 22637734 Free PMC article.
-
Identification of the modifier of Min 2 (Mom2) locus, a new mutation that influences Apc-induced intestinal neoplasia.Genome Res. 2002 Jan;12(1):88-97. doi: 10.1101/gr.206002. Genome Res. 2002. PMID: 11779834 Free PMC article.
-
Understanding phenotypic variation in rodent models with germline Apc mutations.Cancer Res. 2013 Apr 15;73(8):2389-99. doi: 10.1158/0008-5472.CAN-12-4607. Epub 2013 Apr 11. Cancer Res. 2013. PMID: 23580574 Free PMC article. Review.
-
Apc mice: models, modifiers and mutants.Pathol Res Pract. 2008;204(7):479-90. doi: 10.1016/j.prp.2008.03.004. Epub 2008 Jun 5. Pathol Res Pract. 2008. PMID: 18538487 Review.
Cited by
-
Modeling the quantitative nature of neurodevelopmental disorders using Collaborative Cross mice.Mol Autism. 2018 Dec 13;9:63. doi: 10.1186/s13229-018-0252-2. eCollection 2018. Mol Autism. 2018. PMID: 30559955 Free PMC article.
-
Host Genetics Background Affects Intestinal Cancer Development Associated with High-Fat Diet-Induced Obesity and Type 2 Diabetes.Cells. 2024 Oct 31;13(21):1805. doi: 10.3390/cells13211805. Cells. 2024. PMID: 39513912 Free PMC article.
-
Genetic Network Complexity Shapes Background-Dependent Phenotypic Expression.Trends Genet. 2018 Aug;34(8):578-586. doi: 10.1016/j.tig.2018.05.006. Epub 2018 Jun 11. Trends Genet. 2018. PMID: 29903533 Free PMC article. Review.
-
Genetic mapping of novel modifiers for ApcMin induced intestinal polyps' development using the genetic architecture power of the collaborative cross mice.BMC Genomics. 2021 Jul 22;22(1):566. doi: 10.1186/s12864-021-07890-x. BMC Genomics. 2021. PMID: 34294033 Free PMC article.
-
Exploration of different quantitative polymerase chain reaction-based genotyping methods to distinguish Apcmin/+ mice from wildtype mice.PLoS One. 2025 Feb 4;20(2):e0317038. doi: 10.1371/journal.pone.0317038. eCollection 2025. PLoS One. 2025. PMID: 39903728 Free PMC article.
References
-
- Barrett J, Jiwa M, Rose P, Hamilton W. Pathways to the diagnosis of colorectal cancer: an observational study in three UK cities. Fam Pract. 2005;14:9–15. - PubMed
Publication types
MeSH terms
Grants and funding
LinkOut - more resources
Full Text Sources
Other Literature Sources
Molecular Biology Databases
Research Materials
