. 2016 Apr;283(8):1488-503.
doi: 10.1111/febs.13686. Epub 2016 Mar 6.

Structural studies reveal an important role for the pleiotrophin C-terminus in mediating interactions with chondroitin sulfate

Affiliations

Structural studies reveal an important role for the pleiotrophin C-terminus in mediating interactions with chondroitin sulfate

Eathen Ryan et al. FEBS J. 2016 Apr.

Abstract

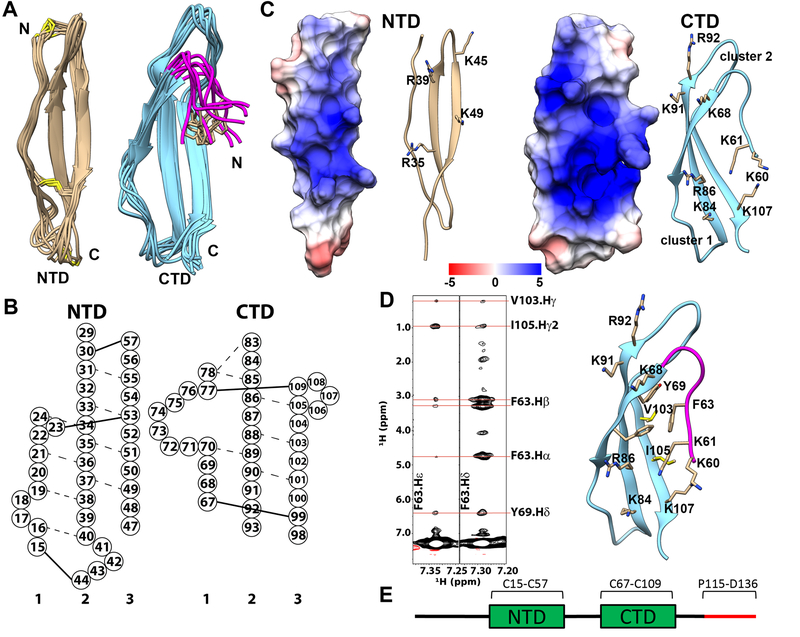
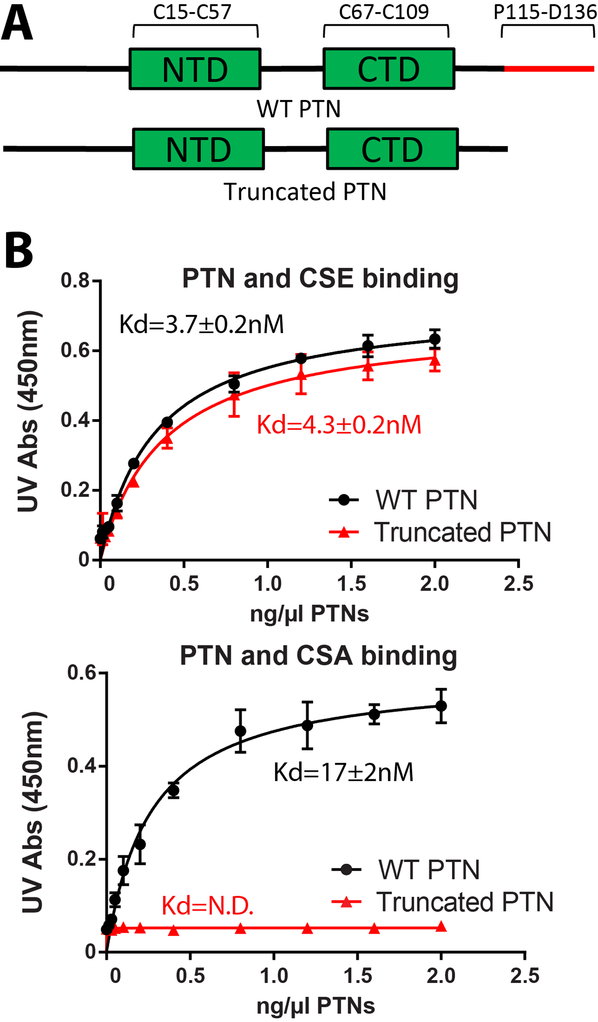
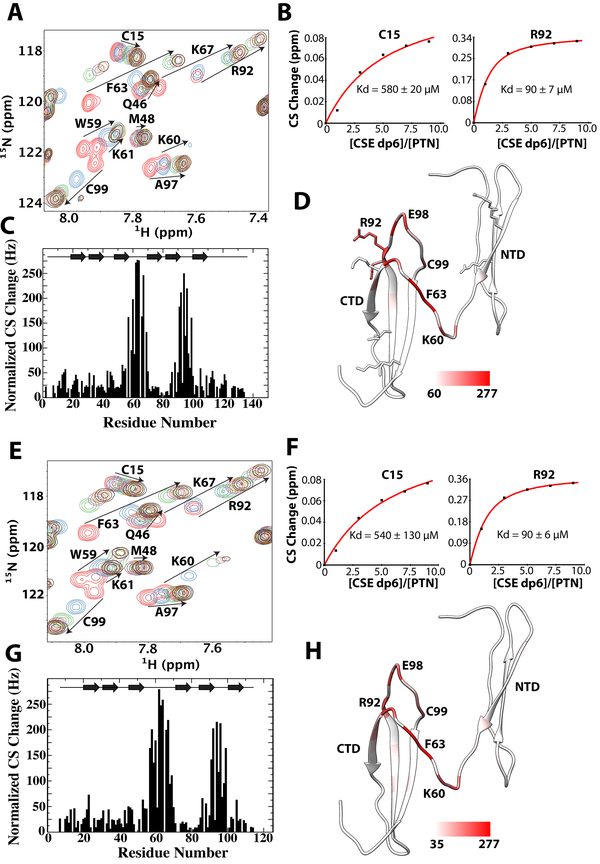
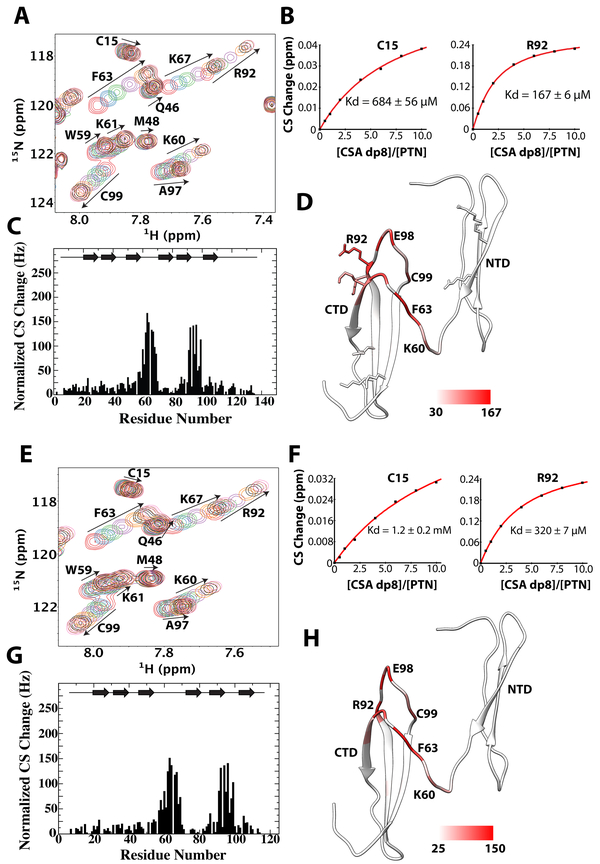
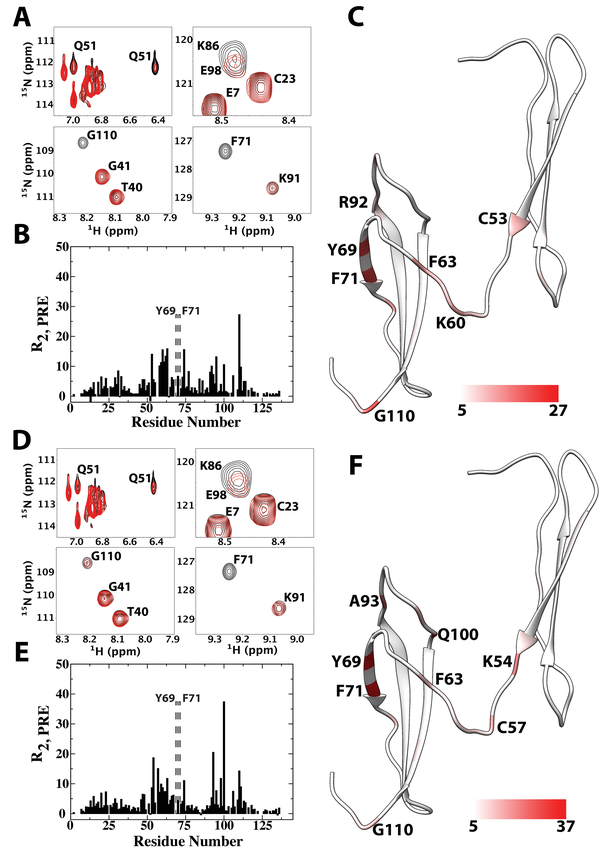
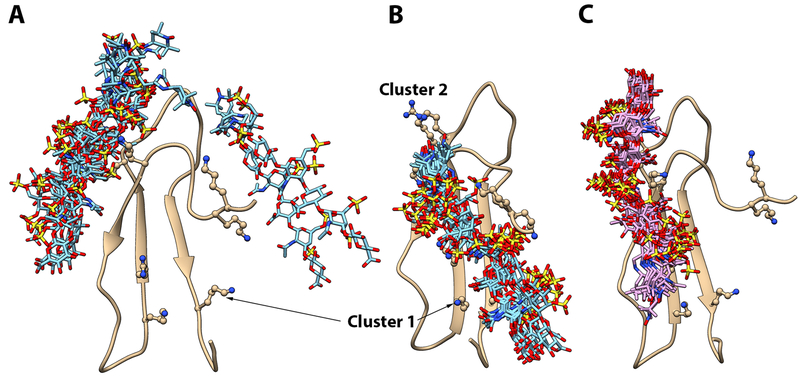
Pleiotrophin (PTN) is a potent glycosaminoglycan-binding cytokine that is important in neural development, angiogenesis and tissue regeneration. Much of its activity is attributed to its interactions with the chondroitin sulfate (CS) proteoglycan, receptor type protein tyrosine phosphatase ζ (PTPRZ). However, there is little high resolution structural information on the interactions between PTN and CS, nor is it clear why the C-terminal tail of PTN is necessary for signaling through PTPRZ, even though it does not contribute to heparin binding. We determined the first structure of PTN and analyzed its interactions with CS. Our structure shows that PTN possesses large basic surfaces on both of its structured domains and also that residues in the hinge segment connecting the domains have significant contacts with the C-terminal domain. Our analysis of PTN-CS interactions showed that the C-terminal tail of PTN is essential for maintaining stable interactions with chondroitin sulfate A, the type of CS commonly found on PTPRZ. These results offer the first possible explanation of why truncated PTN missing the C-terminal tail is unable to signal through PTPRZ. NMR analysis of the interactions of PTN with CS revealed that the C-terminal domain and hinge of PTN make up the major CS-binding site in PTN, and that removal of the C-terminal tail weakened the affinity of the site for CSA but not for other high sulfation density CS.

Database: Coordinates of the ensemble of ten PTN structures have been deposited in RCSB under accession number 2n6f. Chemical shifts assignments and structural constraints have been deposited in BMRB under accession number 25762.

Keywords: NMR; cytokine; glycosaminoglycan-binding protein; glycosaminolgycan.


Figures

Figure 1.
Figure 1.
Structure of PTN. A) Superimpositions of NTD and CTD/hinge from the ensemble of 10 lowest energy structures. Disulfide bonds are represented in yellow. Hinge segment is shown in magenta. Side chain of F63 is shown in beige. B) Schematic depiction of the β-sheet structures of PTN. Residues are represented by circles labeled with residue numbers. Dashed lines represent observed NOE between amide protons. Solid lines represent disulfide bonds. C) Electrostatic potential mapping of NTD and CTD/hinge. The surface depiction of these domains are shown in the same orientation as the ribbon diagrams to their right. The unit of potential is in kT/e. D) Left: strips from aromatic 13C-edited NOESY showing NOE cross peaks between aromatic protons of residue F63 in the hinge and Y69, V103, I105 in CTD. Right: structural details of interactions between hinge and CTD. E) Schematic of the PTN sequence. The C-terminal tail is shown in red.
Figure 2.
Figure 2.
CSA and CSE ELISA of wild type and truncated PTN. A) CSE ELISA of wild type and C-terminal truncated PTN. Both proteins bound CSE with high affinity. B) CSA ELISA of wild type and C-terminal truncated PTN. Only wild type PTN bound CSA with measurable affinity. Error bars represent standard deviations among three independent experiments (n=3).
Figure 3.
Figure 3.
Titration of wild type and C-terminal truncated PTN with CSE dp6 A) 15N-edited HSQC overlay of wild type PTN at different concentrations of CSE dp6. Residues with large chemical shift changes are labeled and their movements are illustrated with arrows. B) Normalized CSE dp6-induced chemical shift changes of amide proton and nitrogen for each residue in wild type PTN. Schematic illustration of PTN’s secondary structure is shown on the top of the plot. C) Binding curves of residues C15 (NTD) and R92 (CTD) used to calculate the CSE dp6 binding Kd of each domain. D) Magnitudes of chemical shift perturbation mapped onto the ribbon diagram of PTN. Coloring scale is shown on the bottom. E) 15N-edited HSQC overlay of C-terminal truncated PTN (residues 1 to 114) at different concentrations of CSE dp6. F) Normalized CSE dp6-induced chemical shift changes of amide proton and nitrogen for each residue in truncated PTN. G) Binding curves of residues C15 (NTD) and R92 (CTD) used to calculate the CSE dp6 binding Kd of each domain. H) Magnitudes of chemical shift perturbation mapped onto the ribbon diagram of PTN. Coloring scale is shown on the bottom.
Figure 4.
Figure 4.
Titration of wild type and C-terminal truncated PTN with CSA dp8. A) 15N-edited HSQC overlay of wild type PTN at different concentrations of CSA dp8. Residues with large chemical shift changes are labeled and their movements are illustrated with arrows. B) Normalized CSA dp8-induced chemical shift changes for each residue in wild type PTN. Schematic illustration of PTN’s secondary structure is shown on the top of the plot. C) Binding curves of residues C15 (NTD) and R92 (CTD) used to calculate the CSA dp8 binding Kd of each domain. D) Magnitudes of chemical shift perturbation mapped onto the ribbon diagram of PTN. Coloring scale is shown on the bottom. E) 15N-edited HSQC overlay of C-terminal truncated PTN (residues 1 to 114) at different concentrations of CSA dp8. F) Normalized CSA dp8-induced chemical shift changes of amide proton and nitrogen for each residue in C-terminal truncated PTN. G) Binding curves of residues C15 (NTD) and R92 (CTD) used to calculate the CSA dp8 binding Kd of each domain. H) Magnitudes of chemical shift perturbation mapped onto the ribbon diagram of PTN. Coloring scale is shown on the bottom.
Figure 5.
Figure 5.
PRE perturbation on wild type PTN by TEMPO-labeled CSE-dp6 and CSA dp8. A) Sections from 15N-edited HSQC overlays of PTN in the presence of oxidized (red) and reduced (black) TEMPO-labeled CSE dp6. B) Quantitative R2,PRE values experienced by backbone amide protons in the presence of TEMPO-labeled CSE dp6. Residues whose amide proton signals are only visible after reduction of TEMPO are indicated by dashed rectangular boxes and labeled. C) TEMPO-labeled CSE dp6 R2,PRE values mapped onto the ribbon diagram of PTN. Coloring scale is shown on the bottom. D) Sections from 15N-edited HSQC overlays of PTN in the presence of oxidized (red) and reduced (black) TEMPO-labeled CSA dp8. E) Quantitative R2,PRE values experienced by backbone amide protons in the presence of TEMPO-labeled CSA dp8. Residues whose amide proton signals are only visible after reduction of TEMPO are indicated by dashed rectangular boxes and labeled. F) TEMPO-labeled CSA dp8 R2,PRE values mapped onto the ribbon diagram of PTN. Coloring scheme is shown on the bottom.
Figure 6.
Figure 6.
Models of CTD-CSE dp6 complex. A) Ensemble of 10 lowest energy models of CTD-CSE dp6 complex constructed using unfiltered experimental data. B) Ensemble of 10 lowest energy models of CTD-CSE dp6 complex after adding cluster 1 residues as active residues and using PRE distance constraints to cluster 2 only. C) Ensemble of 10 lowest energy models of CTD-CSE dp6 complex after using PRE distance constraints to cluster 1 only. In each ensemble, protein is superimposed and ribbon diagram of only one copy is shown. TEMPO-labeled CSE dp6 ligand is shown in the bond representation and basic amino acids in clusters 1 and 2 are shown in the ball-and-stick representation.

Similar articles

Cited by

References

    1. Yeh HJ, He YY, Xu J, Hsu CY & Deuel TF (1998) Upregulation of pleiotrophin gene expression in developing microvasculature, macrophages, and astrocytes after acute ischemic brain injury, J Neurosci. 18, 3699–707. - PMC - PubMed
    1. Li YS, Milner PG, Chauhan AK, Watson MA, Hoffman RM, Kodner CM, Milbrandt J & Deuel TF (1990) Cloning and expression of a developmentally regulated protein that induces mitogenic and neurite outgrowth activity, Science. 250, 1690–4. - PubMed
    1. Silos-Santiago I, Yeh HJ, Gurrieri MA, Guillerman RP, Li YS, Wolf J, Snider W & Deuel TF (1996) Localization of pleiotrophin and its mRNA in subpopulations of neurons and their corresponding axonal tracts suggests important roles in neural-glial interactions during development and in maturity, J Neurobiol. 31, 283–96. - PubMed
    1. Himburg HA, Harris JR, Ito T, Daher P, Russell JL, Quarmyne M, Doan PL, Helms K, Nakamura M, Fixsen E, Herradon G, Reya T, Chao NJ, Harroch S & Chute JP (2012) Pleiotrophin regulates the retention and self-renewal of hematopoietic stem cells in the bone marrow vascular niche, Cell Rep. 2, 964–75. - PMC - PubMed
    1. Hatziapostolou M, Delbe J, Katsoris P, Polytarchou C, Courty J & Papadimitriou E (2005) Heparin affin regulatory peptide is a key player in prostate cancer cell growth and angiogenicity, Prostate. 65, 151–8. - PubMed

Publication types

LinkOut - more resources