

Upstream ORFs are prevalent translational repressors in vertebrates
- PMID: 26896445
- PMCID: PMC4818764
- DOI: 10.15252/embj.201592759
Upstream ORFs are prevalent translational repressors in vertebrates
Abstract
Regulation of gene expression is fundamental in establishing cellular diversity and a target of natural selection. Untranslated mRNA regions (UTRs) are key mediators of post-transcriptional regulation. Previous studies have predicted thousands of ORFs in 5'UTRs, the vast majority of which have unknown function. Here, we present a systematic analysis of the translation and function of upstream open reading frames (uORFs) across vertebrates. Using high-resolution ribosome footprinting, we find that (i)uORFs are prevalent within vertebrate transcriptomes, (ii) the majority show signatures of active translation, and (iii)uORFs act as potent regulators of translation and RNA levels, with a similar magnitude to miRNAs. Reporter experiments reveal clear repression of downstream translation by uORFs/oORFs. uORF number, intercistronic distance, overlap with the CDS, and initiation context most strongly influence translation. Evolution has targeted these features to favor uORFs amenable to regulation over constitutively repressive uORFs/oORFs. Finally, we observe that the regulatory potential of uORFs on individual genes is conserved across species. These results provide insight into the regulatory code within mRNA leader sequences and their capacity to modulate translation across vertebrates.
Keywords: gene regulation; ribosome profiling; translation; uORFs.
© 2016 The Authors.
Figures
- A
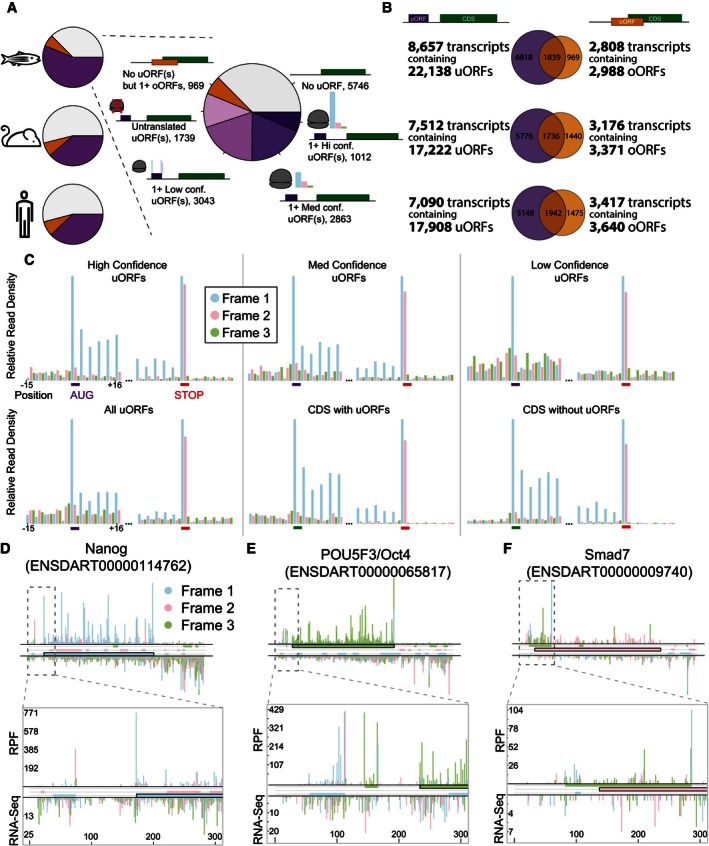
Classification of the protein‐coding transcriptome in zebrafish, human, and mouse reveals that
uORF s are widespread and translated. Transcripts containing at least oneuORF are marked in purple, transcripts containing nouORF s but at least oneoORF are marked in orange, and transcripts lacking both are gray. In zebrafish, three different translation thresholds were applied to classify translateduORF s, and each transcript then classified by its highest confidenceuORF : low confidence (dark pink):RPF RPKM > 0; medium confidence (light purple):ORF score > 0; and high confidence (dark purple):ORF score > 6.044. - B
uORF s andoORF s are widespread throughout the embryonic transcriptome, with a majority ofoORF ‐containing transcripts also containing at least oneuORF .uORF ‐containing (purple) andoORF ‐containing (orange) transcripts were counted in mouse, human, and zebrafish, and the overlap is shown by Venn diagrams. - C
Metagene analysis reveals features of active translation in
uORF s classified as translated. Metagene plots display normalized ribosome‐protected fragment density surroundinguORF start and stop codons, colored according to the frame relative to theORF being translated.CDS regions with and withoutuORF s are also shown for comparison. Note the clear phasing of ribosome‐protected fragments within high‐ and medium‐confidenceuORF s, and the characteristic start and stopRPF peaks across all classes ofuORF s. - D–F
Ribosome profiling reveals in‐frame translation of
uORF s/oORF s in key developmental regulators.RPF ‐line plots show the positional distribution of 28 and 29 ntRPF s (above axes) andmRNA ‐seq reads (below axes) in the whole gene (below) and first 300 nt (inset above) of Nanog (D),POU 5F3 (E), and Smad7 (F). All putativeORF s (DistalAUG ‐Stop) are colored by respective frame (blue, pink and green boxes), as are reads according to their P‐site. Note the agreement betweenORF color andRPF color, consistent with a strong in‐frame distribution of reads within individual transcripts.

- A, B
Most
uORF s are not conserved at the peptide sequence level. Pie charts depict coding potential (phyloCSF score) of (A) all potentialuORF s and (B) translateduORF s.uORF s with a phyloCSF score ≥ 50 were considered conserved,uORF s were considered weakly conserved if their phyloCSF score was positive but less than the conservation threshold of 50. - C
Translated
uORF s are enriched in conserved peptides. Enrichment plot indicates log‐odds ratio of conserveduORF s in the set of translateduORF s versus alluORF s. - D
uORF‐containing transcripts are translationally repressed at 5 hpf. Cumulative distribution of translation efficiency in expressed (> 0.5
RPKM )uORF ‐containing transcripts versus transcripts lackinguORF s. Transcripts containingoORF s are excluded from this plot. Control transcripts (0uORF s) have a codingCDS (GlobalORF score > 6.044) but nouORF in their 5′TL . Two‐sided Wilcoxon P‐values are provided for eachuORF set compared to the control. - E
Translation is significantly repressed in oORF‐containing transcripts. Cumulative distribution of translation efficiency at 5 hpf in expressed (> 0.5
RPKM )oORF ‐containing transcripts versus transcripts lackingoORF s. Transcripts containinguORF s are excluded from this set. Control transcripts (0oORF s) have a codingCDS (GlobalORF score > 6.044) but nouORF in theirTLS . Two‐sided Wilcoxon P‐value is provided for theoORF set compared to the control. - F
miR‐430 is a widespread developmental translation repressor. Cumulative distribution of translation efficiency at 5 hpf in expressed (> 0.5
RPKM ) miR‐430 site‐containing transcripts (single or multiple 7/8‐mers) versus transcripts which lack a miR‐430 site in their 3′UTR . Two‐sided Wilcoxon P‐value is provided for the miR‐430 set compared to the control. - G
uORF s are associated with lowerRNA levels. Cumulative distribution of translation efficiency at 5 hpf in expressed (> 0.5RPKM )uORF ‐containing transcripts versus transcripts lackinguORF s. Transcripts containingoORF s are excluded from this plot. Control transcripts (0uORF s) have a codingCDS (GlobalORF score > 6.044) but nouORF in their 5′UTR . Two‐sided Wilcoxon P‐values are provided for eachuORF set compared to the control. - H
oORF s are associated with lowerRNA levels. Cumulative distribution of translation efficiency at 5 hpf in expressed (> 0.5RPKM )oORF ‐containing transcripts versus transcripts lackingoORF s. Transcripts containinguORF s are excluded from this set. Control transcripts (0oORF s) have a codingCDS (GlobalORF score > 6.044) but nouORF in their 5′UTR . Two‐sided Wilcoxon P‐value is provided for theoORF set compared to the control. - I
miR‐430 targets
RNA s for degradation by 5 hpf. Cumulative distribution of translation efficiency at 5 hpf in expressed (> 0.5RPKM ) miR‐430 site‐containing transcripts (single or multiple 7/8‐mers) versus transcripts which lack a miR‐430 site in their 3′UTR . Two‐sided Wilcoxon P‐value is provided for the miR‐430 set compared to the control.

- A, B
Pie charts depict coding potential (phylo
CSF score) of (A) humanuORF s and (B) mouseuORF s.uORF s with a phyloCSF score ≥ 50 were considered conserved, anduORF s were considered weakly conserved if their phyloCSF score was positive but less than the conservation threshold of 50. - C
Legend displaying the color codes for various types of substitutions in the representative multiple alignments. Amino acid substitutions are considered conservative if they have a positive
BLOSUM 62 score. - D–I
Representative human
uORF alignments (across 29 mammals) are shown for a (D) conserveduORF , (E) weakly conserveduORF , and (F) non‐conserveduORF . Representative zebrafishuORF alignments (across 5 teleosts) are shown for a (G) conserveduORF , (H) weakly conserveduORF , and (I) non‐conserveduORF .
- A–D
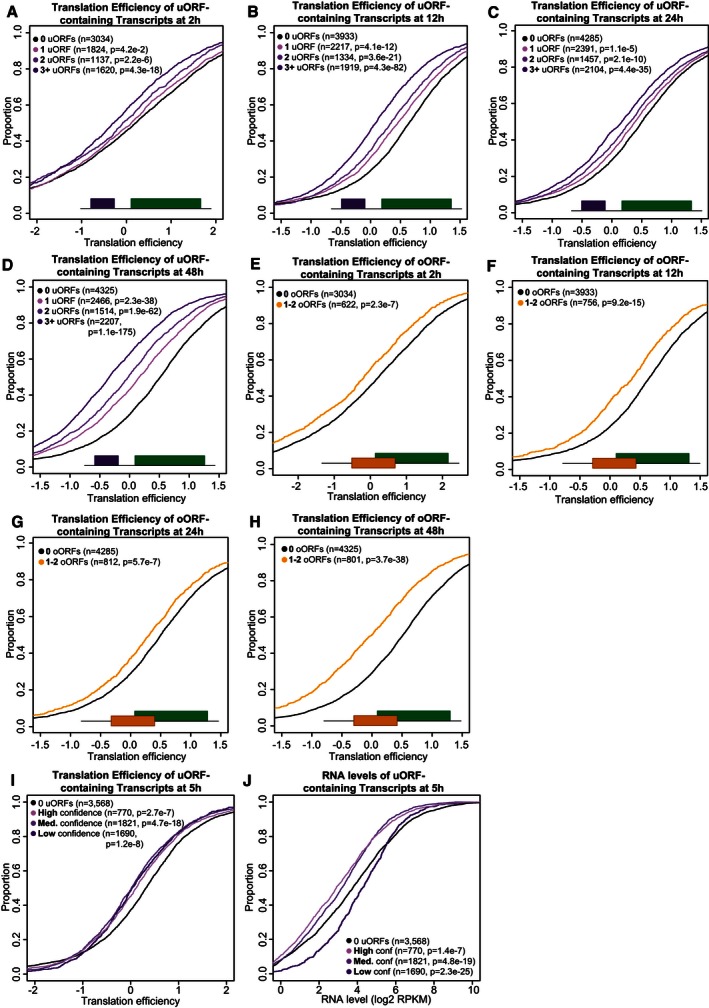
Cumulative plots show translation efficiency of
CDS s with varying numbers ofuORF s for expressed transcripts at (A) 2 hpf, (B) 12 hpf, (C) 24 hpf, and (D) 48 hpf. P‐values are calculated versus transcripts lackinguORF s using a Wilcoxon rank‐sum test with continuity correction. - E–H
Additional cumulative plots show translation efficiency of
CDS s with or withoutoORF s for expressed transcripts at (E) 2 hpf, (F) 12 hpf, (G) 24 hpf, and (H) 48 hpf. - I, J
Further cumulative plots display translation efficiency of
CDS s (I) orRNA expression (J) at 5 hpf in zebrafish transcripts with at least one high‐, medium‐, or low‐confidenceuORF versus a control set lackinguORF s.
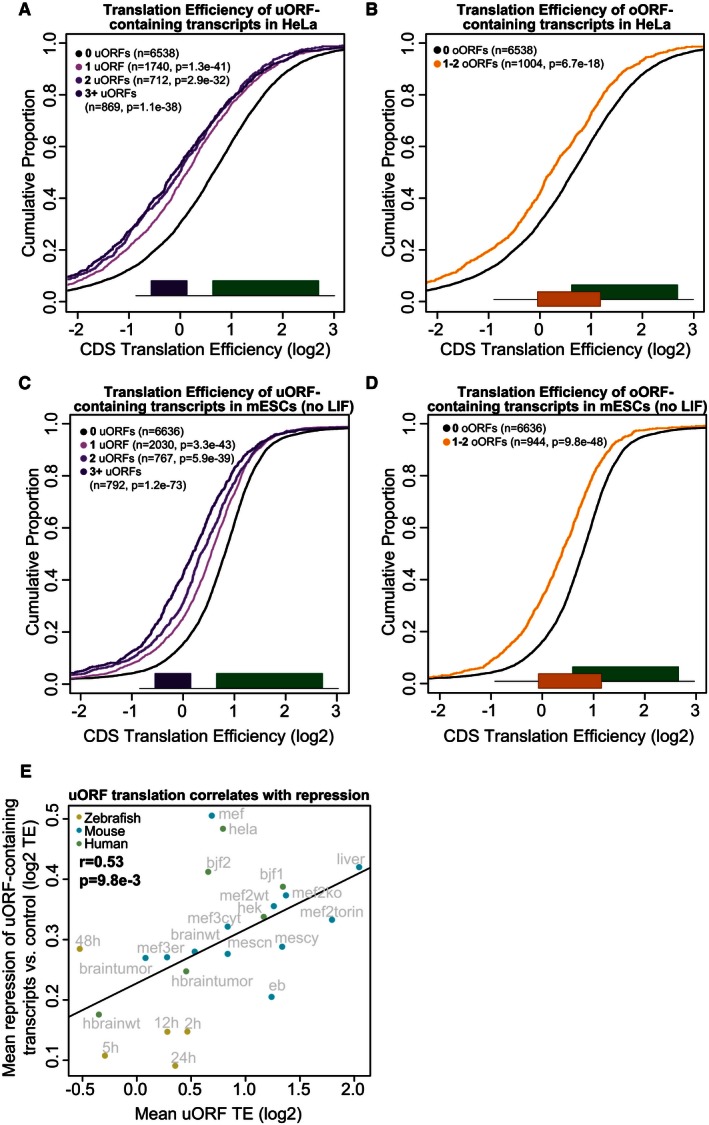
uORF‐containing transcripts are repressed in HeLa cells. Plot displays the cumulative distribution of translation efficiency in expressed (> 0.5
RPKM ) transcripts containing 1, 2, or > 2uORF s versus transcripts lackinguORF s. Transcripts containingoORF s are excluded from this set. Two‐sided Wilcoxon P‐values are provided for eachuORF set compared to the control.oORF‐containing transcripts are repressed in HeLa cells. Plot displays the cumulative distribution of translation efficiency in expressed (> 0.5
RPKM )oORF ‐containing transcripts versus transcripts lackingoORF s. Transcripts containinguORF s are excluded from this set. Two‐sided Wilcoxon P‐value is provided for theoORF set compared to the control.uORF‐containing transcripts are repressed in murine embryonic stem cells. Plot displays the cumulative distribution of translation efficiency in expressed (> 0.5
RPKM ) transcripts containing 1, 2, or > 2uORF s versus transcripts lackinguORF s. Transcripts containingoORF s are excluded from this set. Two‐sided Wilcoxon P‐values are provided for eachuORF set compared to the control.oORF‐containing transcripts are repressed in murine embryonic stem cells. Plot displays the cumulative distribution of translation efficiency in expressed (> 0.5
RPKM )oORF ‐containing transcripts versus transcripts lackingoORF s. Transcripts containinguORF s are excluded from this set. Two‐sided Wilcoxon P‐value is provided for theoORF set compared to the control.uORF translation is correlated withCDS repression. Scatterplot displays the per‐sample mean repression ofuORF ‐containing transcripts versus the mean translation efficiency ofuORF s in single‐uORF transcripts. Repression is determined by calculating the difference between the meanTE ofCDS s inuORF ‐containing transcripts versus the meanTE ofCDS s in transcripts lackinguORF s/oORF s in theirTLS . Only expressed transcripts (> 0.5RNA RPKM across samples per organism) were counted. Labels indicate the sample name. For more information on individual samples, see Table EV3.
- A, B
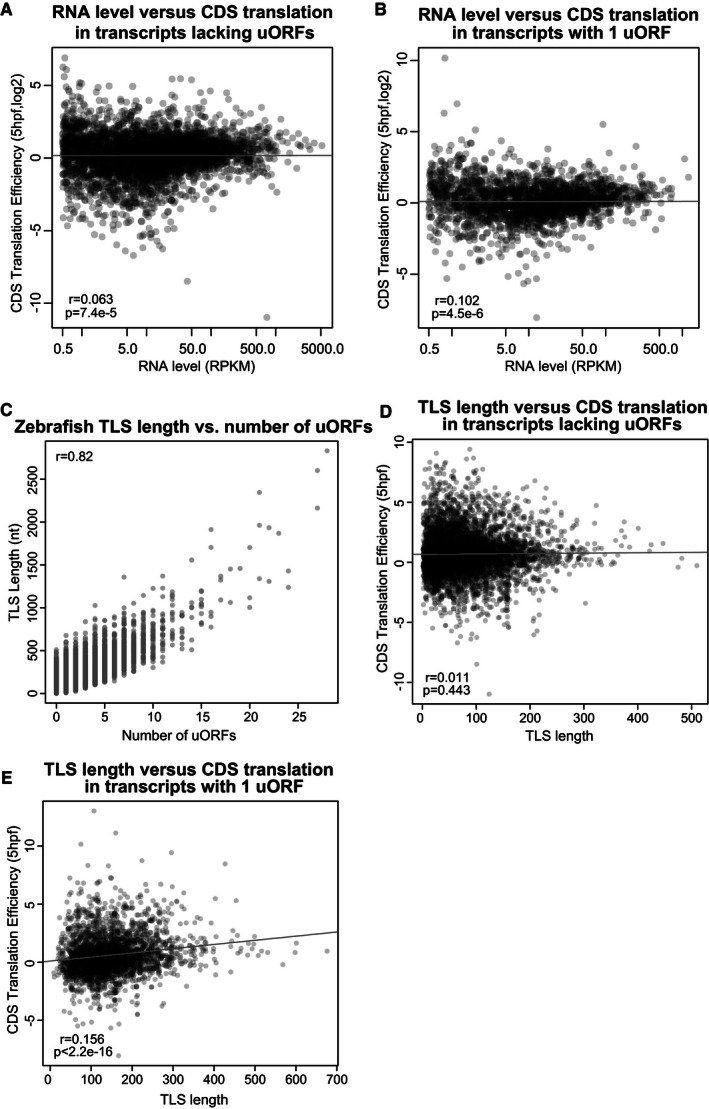
Scatterplots show the relationship between
RNA level andCDS translation efficiency (zebrafish, 5 hpf) controlling for the number ofuORF s by selecting (A) transcripts lackinguORF s (Pearson's r = 0.063, P = 7.4e‐5) and (B) transcripts containing a singleuORF (Pearson's r = 0.102, P = 4.5e‐6). - C
TLS length and number ofuORF s are well correlated in zebrafish (Pearson's r = 0.82). - D, E
Scatterplots show the relationship between
TLS length andCDS translation efficiency (zebrafish, 5 hpf) controlling for the number ofuORF s by selecting (D) transcripts lackinguORF s (Pearson's r = 0.011, P = 0.443) and (E) transcripts containing a singleuORF (Pearson's r = 0.156, P < 2.2e‐16).
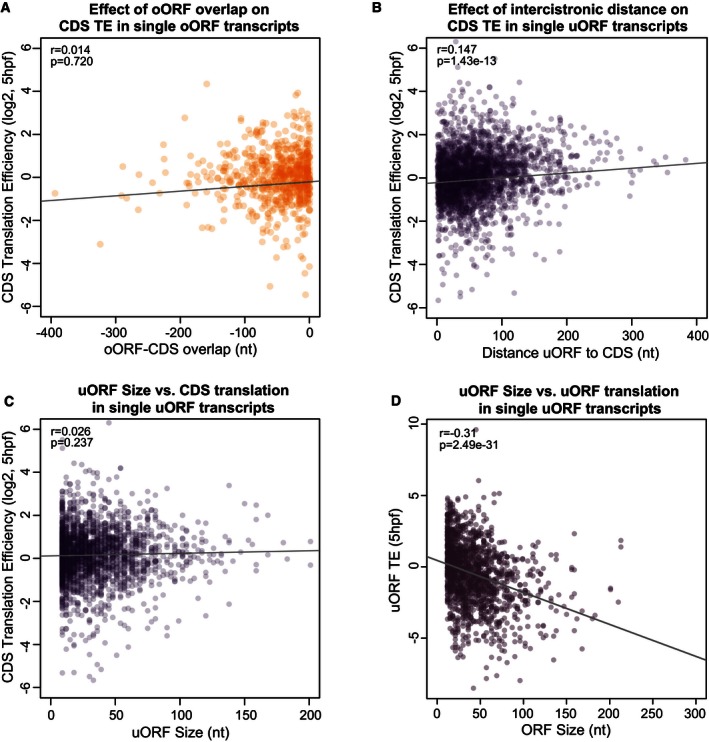
- A–D
Scatterplots present the effect of various
uORF sequence features on translation in zebrafish at 5 hpf. (A) Points indicate the translation efficiency ofCDS s in expressed,oORF ‐containing transcripts which lackuORF s. The x‐axis indicates the relative position of theCDS AUG to theoORF stop codon, with more negative numbers indicating larger overlap. The amount of overlap is not significantly correlated with CDS TE (Pearson's r = 0.014, P = 0.720). (B, C) Points indicate the translation efficiency ofCDS s in expressed, single‐uORF ‐containing transcripts which lackoORF s, versus (B) intercistronic distance (Pearson's r = 0.147, P = 1.43e‐13) and (C)uORF size (Pearson's r = 0.026, P = 0.237). (D)uORF size is inversely correlated withuORF translation efficiency (Pearson's r = −0.31, P = 2.49e‐31).
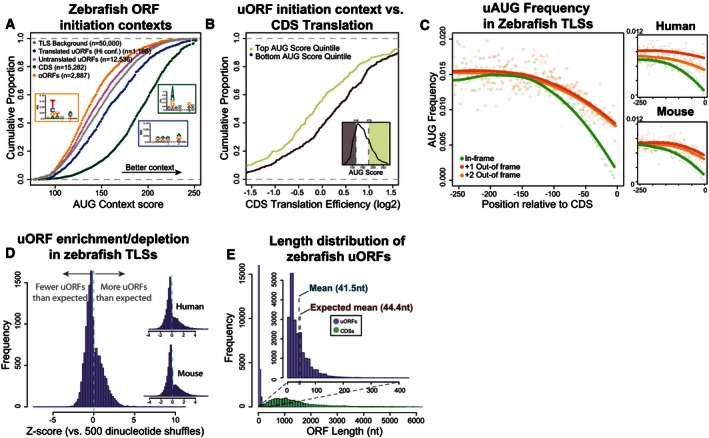
uORF initiation contexts display signatures of selection. Plot displays cumulative distribution ofAUG context scores calculated using nucleotide scoring matrices (Grzegorski et al, 2014) across multiple classes ofORF s (translateduORF s (high confidence), untranslateduORF s,CDS ORF s, andTLS background), with a higher score indicating better initiation context.TLS background represents the distribution of scores of a randomly sampled set of 50,000 sequences from zebrafish 5′UTR s. Insets display sequence logos forCDS s, translateduORF s, andoORF s.uORF initiation context influences repression of downstream translation. Plot displays cumulative distribution of translation efficiency in transcripts with singleuORF s in favorable initiation contexts (top quintile of alluORF s) versus unfavorable contexts (bottom quintile of alluORF s). Inset displays where these quintiles lie on the distribution of alluORF AUG scores.AUG frequency is lower proximal to theCDS start codon. Plot displaysAUG frequency (as a fraction of all codons), split by frame relative to theCDS start codon. Points show frequencies at individual codon positions and loess regression lines display the overall trend.Vertebrate
TLS s contain feweruORF s than expected. Histograms show the distribution of z‐scores in zebrafish, mouse, and humanTLS s, with positive z‐scores indicatinguORF enrichment and negative z‐scores indicatinguORF depletion, relative to sequence‐shuffledTLS s.uORF s are shorter than expected by chance. Histogram showing length distribution of alluORF s versus canonical protein‐coding regions, with inset providing a closer look atuORF s (bin size 10 nt). Vertical dotted lines indicate the observed mean length of endogeneousuORF s and the mean length ofuORF s obtained by sequence shuffling of zebrafishTLS s, which differ significantly (two‐sided P < 4.5e‐308).

- A
Cumulative plots show the distribution of initiation context scores in zebrafish for
uORF s,oORF s, 3′UTR ORF s (dORF s), andCDS , further broken down by their translation classification. TheTLS background is calculated by scoring the nucleotide context around 50,000 randomly selectedTLS positions. - B
uORF AUG scores are significantly correlated withuORF translation in single‐uORF transcripts at 5 hpf in zebrafish (Pearson's r = 0.30, P < 2.2e‐16). - C
uORF AUG scores are inversely correlated with downstreamCDS translation in single‐uORF transcripts (Pearson's r = −0.094, P = 5.15e‐5). - D, E
Cumulative plots show the distribution of initiation context scores in (D) mouse and (E) human, for
uORF s,oORF s, 3′UTR ORF s (dORF s), andCDS . TheTLS background is calculated by scoring the nucleotide context around 50,000 randomly selectedTLS positions in each species.

Schematic displays
uORF /oORF configurations for reporter experiments.GFP reporters contained variableuORF configurations: nouORF s, 1uORF , 3uORF s, 1oORF , or 1uORF in weak initiation context.TLS length (104 nt) and polyA tail length (60A) were constant across all reporters, andTLS sequence differed only by single nucleotide changes at eachuORF start codon (or two single nucleotide changes in the weak context reporter). Constructs (100 pg) were coinjected with dsRed (150 pg) into 1‐cell‐stage embryos and quantified at 24 hpf.Fluorescent microscopy images of representative embryos expressing each
GFP reporter and the dsRed control 24 h post‐injection.uORF s andoORF s repress downstream translation as predicted by analysis of endogeneous transcripts. Repression is observed in reporters withuORF ‐/oORF ‐containingTLS s, but the effect is weaker for auORF with a bad initiation context. Group pictures can be found in Appendix Fig S2.Bar plot displays fluorescence quantification of 24‐h embryos injected with each reporter.
GFP fluorescence intensity was normalized to dsRed intensity in each embryo with robust dsRed expression, then mean fluorescence for each reporter was scaled relative to the no‐uORF reporter (the number of embryos measured for each reporter is displayed below the x‐axis). Error bars display ±SEM . Reporter fluorescence was compared using unpaired two‐tailed Student's t‐test and was significant for all comparisons: **P < 0.01—nouORF s versus 1 weak contextuORF (P = 2.98e‐3); ****P < 0.0001—nouORF versus 1uORF (P = 3.21e‐9), 1uORF versus 3uORF s (P = 6.66e‐5), 1uORF versus 1oORF (P = 7.65e‐11), 1uORF versus 1uORF weak context (P = 3.24e‐5).

- A
Cartoon shows strategy for investigating conservation of
uORF regulatory activity. The ratio of translation between theTLS andCDS is calculated and compared between 1‐to‐1 homologs in the same tissue type across species. - B–E
uORF activity is correlated across species. Scatterplots display the translation ratio comparison between the same transcripts (TLS length > 100 nt, 1‐1 mouse–human homology) in fibroblasts (BJF cells in human: sample bjf2,MEF cells in mouse: sample mef2wt) (B) and brain (samples hbrainwt and brainwt) (D). The correlation between species is not due toCDS signal correlation. Scatterplots (C, E) display the translation ratio comparison between homologous transcripts (TLS length > 100 nt, 1‐1 mouse–human homology) in fibroblasts (B) and brain (D), maintainingCDS pairings while shuffling whichTLS is associated with each CDS.
Comment in
-
Starting too soon: upstream reading frames repress downstream translation.EMBO J. 2016 Apr 1;35(7):699-700. doi: 10.15252/embj.201693946. Epub 2016 Feb 19. EMBO J. 2016. PMID: 26896443 Free PMC article.
References
-
- Abràmofff MD, Magalhães PJ, Ram SJ (2005) Image processing with ImageJ. Biophoton Int 11: 36–43
-
- Altschul SF, Erickson BW (1985) Significance of nucleotide sequence alignments: a method for random sequence permutation that preserves dinucleotide and codon usage. Mol Biol Evol 2: 526–538 - PubMed
-
- Alves VS, Motta FL, Roffé M, Delamano A, Pesquero JB, Castilho BA (2009) GCN2 activation and eIF2alpha phosphorylation in the maturation of mouse oocytes. Biochem Biophys Res Commun 378: 41–44 - PubMed
-
- Ambros V (2004) The functions of animal microRNAs. Nature 431: 350–355 - PubMed
Publication types
MeSH terms
Substances
Grants and funding
LinkOut - more resources
Full Text Sources
Other Literature Sources
Molecular Biology Databases
