. 2016 Jun 20;44(11):5095-104.
doi: 10.1093/nar/gkw107. Epub 2016 Feb 20.

Reversal of epigenetic promoter silencing in Friedreich ataxia by a class I histone deacetylase inhibitor

Affiliations

Reversal of epigenetic promoter silencing in Friedreich ataxia by a class I histone deacetylase inhibitor

Yogesh K Chutake et al. Nucleic Acids Res. .

Abstract

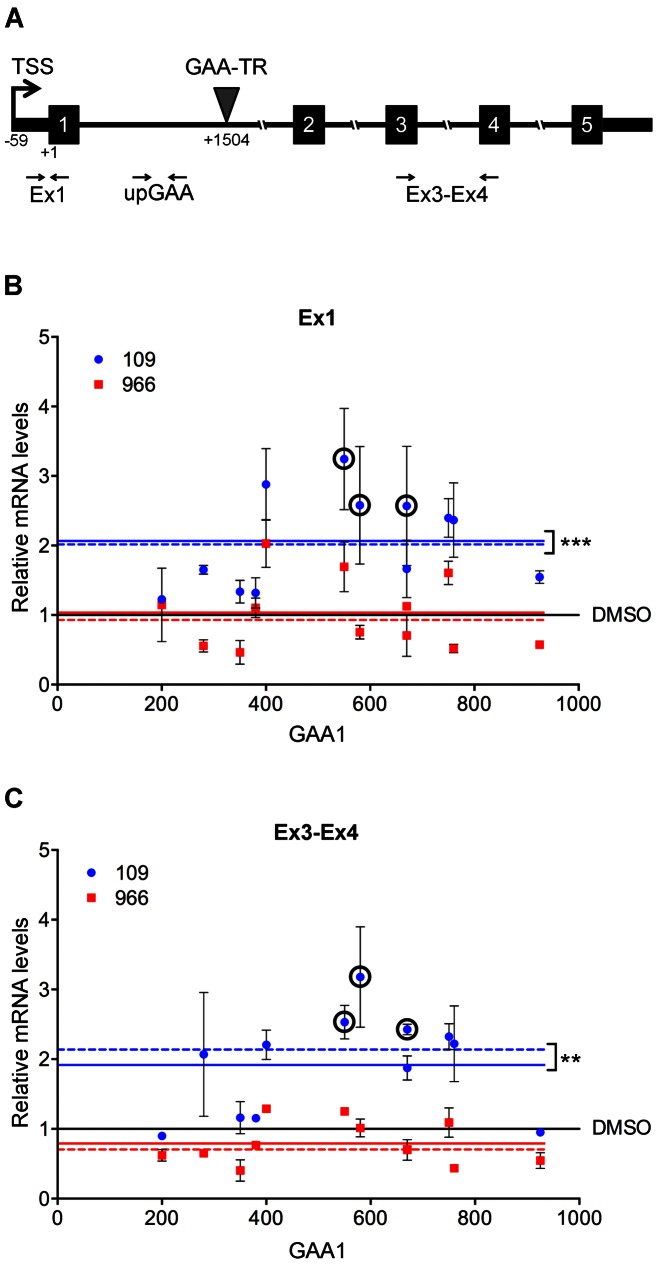
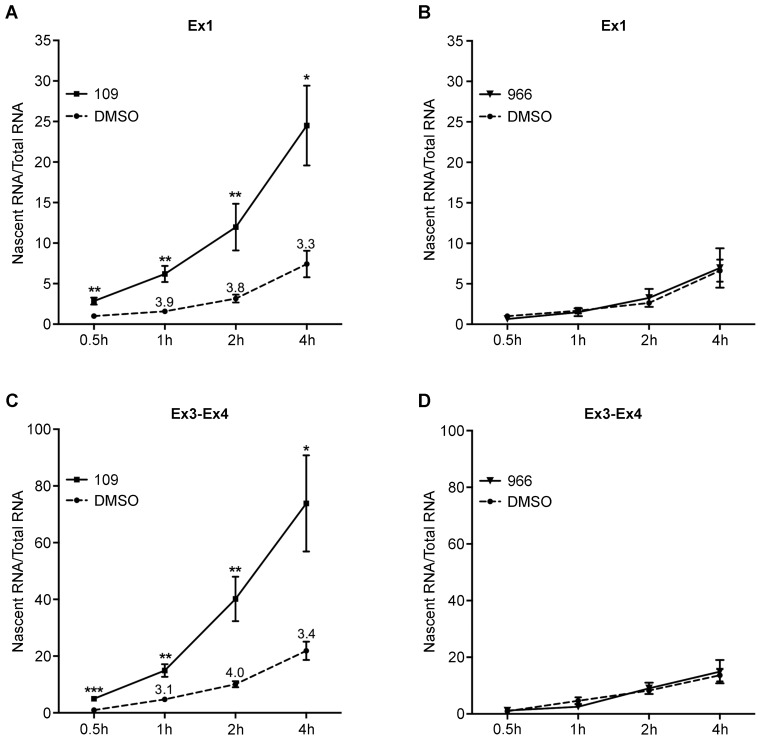
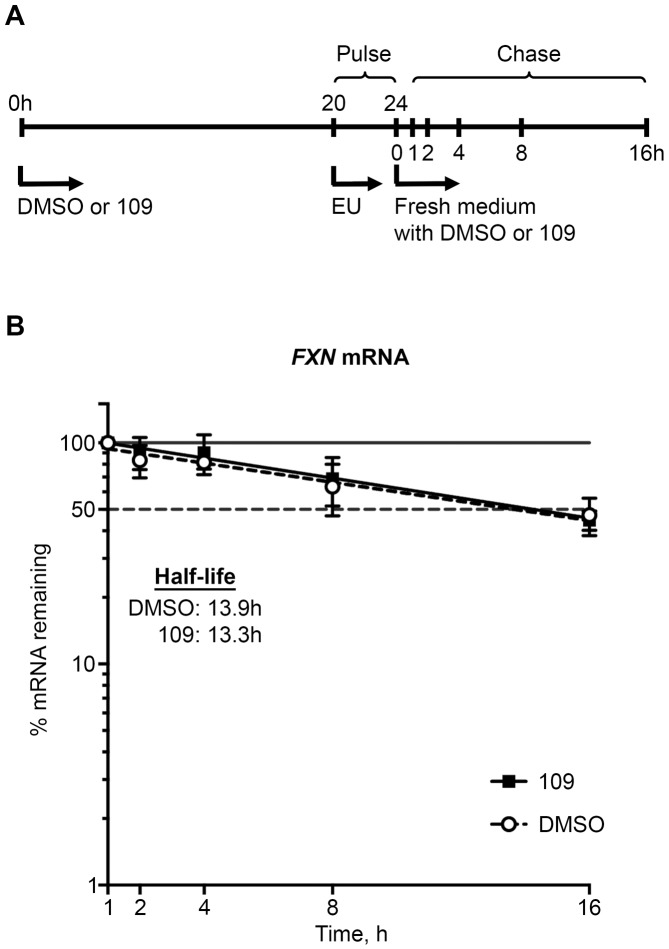
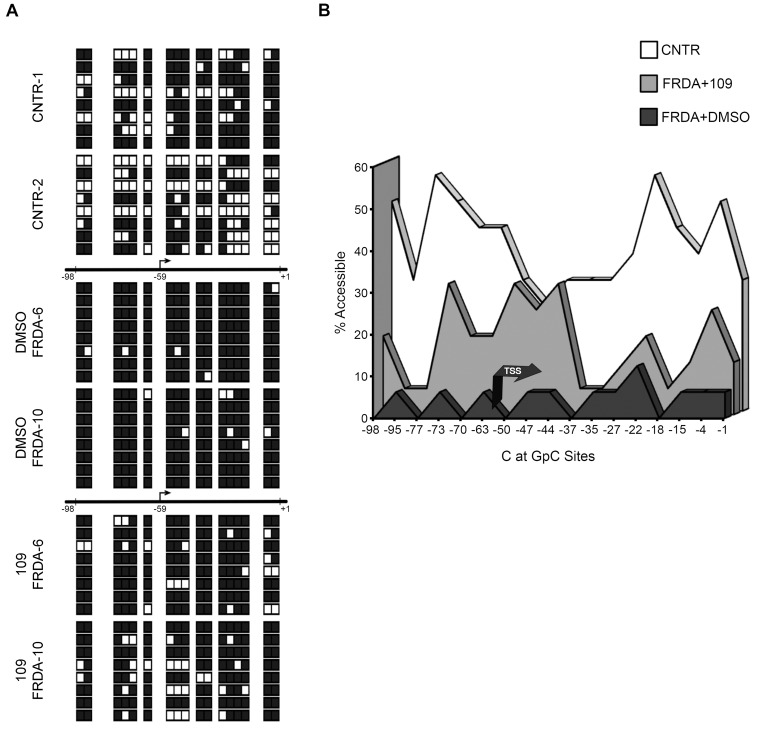
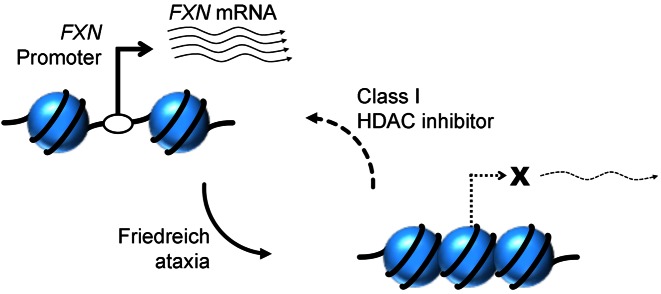
Friedreich ataxia, the most prevalent inherited ataxia, is caused by an expanded GAA triplet-repeat sequence in intron 1 of the FXN gene. Repressive chromatin spreads from the expanded GAA triplet-repeat sequence to cause epigenetic silencing of the FXN promoter via altered nucleosomal positioning and reduced chromatin accessibility. Indeed, deficient transcriptional initiation is the predominant cause of transcriptional deficiency in Friedreich ataxia. Treatment with 109, a class I histone deacetylase (HDAC) inhibitor, resulted in increased level of FXN transcript both upstream and downstream of the expanded GAA triplet-repeat sequence, without any change in transcript stability, suggesting that it acts via improvement of transcriptional initiation. Quantitative analysis of transcriptional initiation via metabolic labeling of nascent transcripts in patient-derived cells revealed a >3-fold increase (P < 0.05) in FXN promoter function. A concomitant 3-fold improvement (P < 0.001) in FXN promoter structure and chromatin accessibility was observed via Nucleosome Occupancy and Methylome Sequencing, a high-resolution in vivo footprint assay for detecting nucleosome occupancy in individual chromatin fibers. No such improvement in FXN promoter function or structure was observed upon treatment with a chemically-related inactive compound (966). Thus epigenetic promoter silencing in Friedreich ataxia is reversible, and the results implicate class I HDACs in repeat-mediated promoter silencing.


Figures

Figure 1.
Figure 1.
Treatment with 109 significantly increases FXN transcript levels in FRDA both upstream and downstream of the expanded GAA-TR sequence. (A) Schematic representation of the FXN gene showing the location of the expanded GAA-TR sequence in intron 1, the FXN transcription start site (TSS, at −59, relative to the ‘A’ in the translational start codon as +1), and the amplicons, Ex1 and Ex3–Ex4, used for quantitative RT-PCR to assay FXN transcript levels upstream and downstream of the GAA-TR sequence, respectively. The intronic amplicon, upGAA, is also shown, which was used for quantitative RT-PCR to assay primary FXN transcript levels. (B and C) Quantitative RT-PCR showing relative levels of FXN transcript (Y-axis) in 12 FRDA cell lines, distributed (X-axis) by the size of the shorter of the two expanded GAA-TR alleles (GAA1, triplets), upon treatment with 109 (blue circles) and 966 (red squares), upstream (Ex1) and downstream (Ex3–Ex4) of the expanded GAA-TR sequence in FRDA. Relative to treatment of each cell line with only DMSO (indicated by the black line at 1.0), treatment with 109 resulted in a statistically significant ∼2-fold increase in FXN transcript at both upstream (B) and downstream (C) locations; mean and median of transcript levels in response to 109 in all 12 cell lines is indicated by solid and interrupted blue lines, respectively. No such increase was seen upon treatment with 966, either upstream (B) or downstream (C) of the expanded GAA-TR sequence in FRDA; mean and median of transcript levels in response to 966 in all 12 cell lines is indicated by solid and interrupted red lines, respectively. The variable response to 109 was not correlated with GAA1 repeat length (R2 = 0.13 for Ex1 and R2 = 0.08 for Ex3–Ex4). All subsequent mechanistic studies were performed using the three ‘circled’ FRDA cell lines (FRDA-6, FRDA-10, FRDA-17) that showed consistent and robust increase in FXN transcript levels. The graphs represent cumulative data from two complete experiments using 12 lymphoblastoid cell lines from individuals who are homozygous for the expanded GAA-TR sequence, treated with 109, 966 or no drug (only DMSO), each assayed in triplicate. FXN transcript levels are shown relative to the expression of the housekeeping RPS29 gene using the ΔΔCt method. Error bars represent +/−SEM. Medians were analyzed with the Mann–Whitney test, and mean values were analyzed using the two-tailed Student's t-test. ***P < 0.001; **P < 0.01.
Figure 2.
Figure 2.
Treatment with 109 significantly increases FXN promoter function in FRDA. Treatment with 109 (A and C), but not 966 (B and D), resulted in >3-fold increased accumulation of nascent FXN transcript at various time points assayed (0.5–4 h) after initiation of metabolic labeling. Quantitative RT-PCR was performed both immediately downstream of the transcription start site (i.e. upstream of the expanded GAA-TR sequence; Ex1 in Figure 1A) and downstream of the expanded GAA-TR sequence (Ex3–Ex4 in Figure 1A), with both locations showing a similar >3-fold increase in nascent FXN transcript accumulation in response to 109 treatment. Nascent transcript levels were quantified by real-time PCR relative to expression of the control TBP gene (for 109 treated samples [A and C]) or the control OAZ1 gene (for 966 treated samples [B and D]) from total biotinylated RNA using the ΔΔCt method. Graphs represent cumulative data from two complete experiments using three lymphoblastoid cell lines from individuals with FRDA who are homozygous for the expanded GAA-TR sequence, treated with 109, 966 or no drug (only DMSO), each assayed in triplicate. Error bars represent +/−SEM. ***P < 0.001; **P < 0.01; *P < 0.05.
Figure 3.
Figure 3.
Treatment with 109 significantly increases levels of primary FXN transcript in FRDA. (A) Quantitative RT-PCR showing relative levels of primary FXN transcript assayed via strand-specific RT-PCR at upGAA in intron 1 (see Figure 1A) in three patient-derived lymphoblastoid cell lines, following treatment with 109, 966 or only DMSO. Treatment with 109, but not 966, resulted in >3-fold increase in levels of steady-state primary FXN transcript compared with no drug (i.e. only DMSO). Graphs represent cumulative data from four complete experiments using three lymphoblastoid cell lines from individuals with FRDA who are homozygous for the expanded GAA-TR sequence, each assayed in triplicate. Error bars represent +/−SEM. *P < 0.05. (B) Quantitative RT-PCR of metabolically-labeled nascent primary FXN transcript assayed at upGAA in intron 1 following 0.5, 1, 2 and 4 h of labeling with 5-ethynyl uridine (EU) in the same three cell lines used above. Treatment with 109 resulted in >4-fold increased production of newly synthesized primary FXN transcript compared with no drug at each of the four time points. Graphs represent cumulative data from two complete experiments using three lymphoblastoid cell lines from individuals with FRDA, each assayed in triplicate. Error bars represent +/−SEM. *P < 0.05; **P < 0.01.
Figure 4.
Figure 4.
Treatment with 109 does not alter the stability of FXN transcript in FRDA. (A) Scheme of pulse-chase experiment performed to measure the half-life of FXN transcript in patient-derived lymphoblastoid cells. Treatment with 109 (or only DMSO) was carried out for 24 h, with the last 4 h in the presence of EU to label nascent transcripts. The decay of labeled FXN transcript was measured by quantitative RT-PCR over the subsequent 16 h, in the absence of EU. (B) The temporal decay profile of newly labeled FXN transcript (% mRNA remaining, plotted using a log scale on the Y-axis), assayed in triplicate (twice using FRDA-6 and once using FRDA-10), indicates that the half-life of FXN transcript remained unchanged at ∼13.5 h following treatment with 109.
Figure 5.
Figure 5.
Treatment with 109 significantly improves FXN promoter structure and chromatin accessibility in FRDA. (A) NOMe-Seq data, measuring the nucleosomal footprint in vivo, for two non-FRDA cell lines (CNTR1 and 2), and two FRDA cell lines either treated with 109 or with no drug (DMSO) are shown. The horizontal lines depict the 100-bp region analyzed, which represents the nucleosome depleted region flanking the FXN–TSS at −59 (relative to the ‘A’ in the translational start codon as +1). NOMe-Seq data of eight chromatin fibers per cell line, i.e. n = 16 fibers for each of the three conditions is depicted. For each of the 48 fibers are shown 17 white/black boxes, which represent accessible/inaccessible GpC sites, respectively. (B) The cumulative NOMe-Seq data of all 48 chromatin fibers, measured at each of 17 GpC dinucleotides within the nucleosome depleted region, are shown with promoter accessibility (%) plotted on the Y-axis. In non-FRDA controls (CNTR) the FXN-TSS is located within a nucleosome depleted region (median accessibility = 37.5%), which is obliterated in FRDA patients (FRDA + DMSO; median accessibility = 6.25%; P < 0.0001 compared with CNTR). Treatment with 109 (FRDA + 109) resulted in a significant, ∼3-fold increase in chromatin accessibility of the nucleosome depleted region (median accessibility = 18.8%; P < 0.0001 compared with FRDA + DMSO).
Figure 6.
Figure 6.
Model of reversal of epigenetic FXN promoter silencing in FRDA by a class I HDAC inhibitor. The FXN promoter, which normally has a transcription start site within a nucleosome depleted region, is rendered inaccessible in FRDA because of increased nucleosome density. This results in a severe deficiency of transcriptional initiation in FRDA. Treatment with 109, a class I HDAC inhibitor, results in significantly improved FXN promoter accessibility and promoter activity in FRDA.

Similar articles

Cited by

References

    1. Brouwer J.R., Willemsen R., Oostra B.A. Microsatellite repeat instability and neurological disease. Bioessays. 2009;31:71–83. - PMC - PubMed
    1. Saveliev A., Everett C., Sharpe T., Webster Z., Festenstein R. DNA triplet repeats mediate heterochromatin-protein-1-sensitive variegated gene silencing. Nature. 2003;422:909–913. - PubMed
    1. Campuzano V., Montermini L., Molto M.D., Pianese L., Cossee M., Cavalcanti F., Monros E., Rodius F., Duclos F., Monticelli A., et al. Friedreich's ataxia: autosomal recessive disease caused by an intronic GAA triplet repeat expansion. Science. 1996;271:1423–1427. - PubMed
    1. Herman D., Jenssen K., Burnett R., Soragni E., Perlman S.L., Gottesfeld J.M. Histone deacetylase inhibitors reverse gene silencing in Friedreich's ataxia. Nat. Chem. Biol. 2006;2:551–558. - PubMed
    1. Punga T., Buhler M. Long intronic GAA repeats causing Friedreich ataxia impede transcription elongation. EMBO Mol. Med. 2010;2:120–129. - PMC - PubMed

Publication types