. 2016 Feb 20:2016:bav096.
doi: 10.1093/database/bav096. Print 2016.

Ensembl comparative genomics resources

Affiliations

Ensembl comparative genomics resources

Javier Herrero et al. Database (Oxford). .

Erratum in

  • Ensembl comparative genomics resources.
    Herrero J, Muffato M, Beal K, Fitzgerald S, Gordon L, Pignatelli M, Vilella AJ, Searle SM, Amode R, Brent S, Spooner W, Kulesha E, Yates A, Flicek P. Herrero J, et al. Database (Oxford). 2016 May 2;2016:baw053. doi: 10.1093/database/baw053. Print 2016. Database (Oxford). 2016. PMID: 27141089 Free PMC article. No abstract available.

Abstract

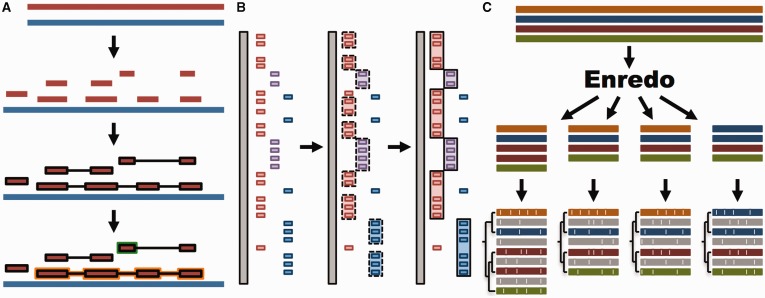
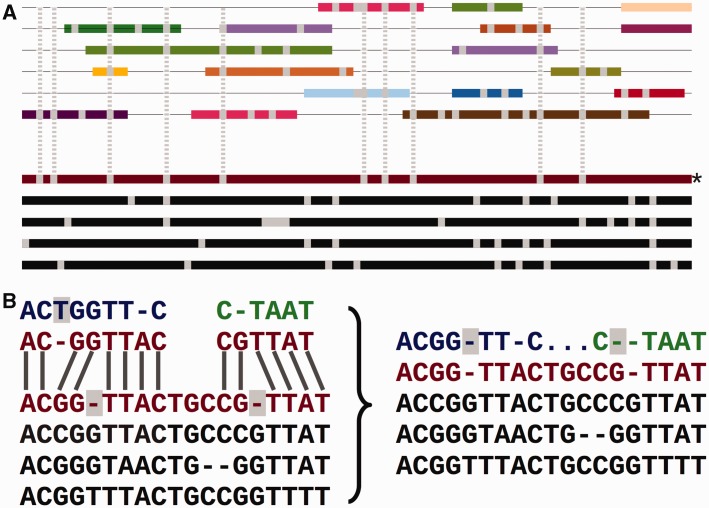
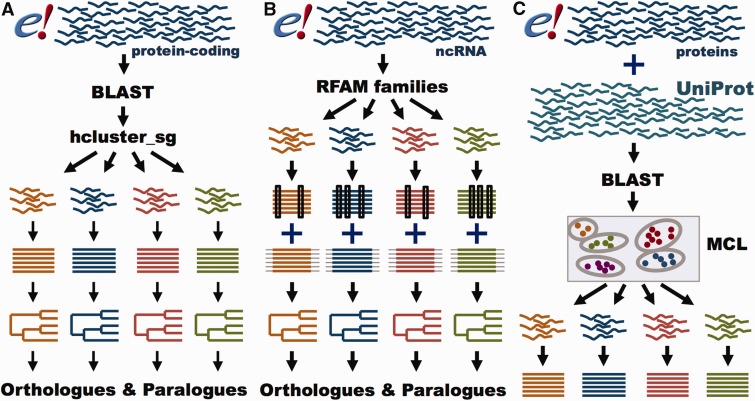
Evolution provides the unifying framework with which to understand biology. The coherent investigation of genic and genomic data often requires comparative genomics analyses based on whole-genome alignments, sets of homologous genes and other relevant datasets in order to evaluate and answer evolutionary-related questions. However, the complexity and computational requirements of producing such data are substantial: this has led to only a small number of reference resources that are used for most comparative analyses. The Ensembl comparative genomics resources are one such reference set that facilitates comprehensive and reproducible analysis of chordate genome data. Ensembl computes pairwise and multiple whole-genome alignments from which large-scale synteny, per-base conservation scores and constrained elements are obtained. Gene alignments are used to define Ensembl Protein Families, GeneTrees and homologies for both protein-coding and non-coding RNA genes. These resources are updated frequently and have a consistent informatics infrastructure and data presentation across all supported species. Specialized web-based visualizations are also available including synteny displays, collapsible gene tree plots, a gene family locator and different alignment views. The Ensembl comparative genomics infrastructure is extensively reused for the analysis of non-vertebrate species by other projects including Ensembl Genomes and Gramene and much of the information here is relevant to these projects. The consistency of the annotation across species and the focus on vertebrates makes Ensembl an ideal system to perform and support vertebrate comparative genomic analyses. We use robust software and pipelines to produce reference comparative data and make it freely available. Database URL: http://www.ensembl.org.


Figures

Figure 1.
Figure 1.
Whole genome analysis pipeline. (A) Pairwise alignments. A reference genome (blue) is aligned to another genome (red) with LASTZ. The raw alignments that are in the same order and orientation are grouped in chains (highlighted in black). On each region of the reference genome, the best chain is selected to single out the set of nets. A top-level net (orange) can include a nested net (green) in regions it does not cover. (B) Large-scale syntenies. LASTZ-net alignments are sorted on a reference genome (grey). The red, magenta and blue boxes represent alignments to different chromosomes in the other genome. For simplicity, we assume that they are in the same order and orientation. Contiguous collinear alignments are joined in a first-pass, forming a nascent syntenic block. In the second pass, the nascent blocks are joined and extended further to build macro-synteny blocks. (C) EPO multiple alignments. The sequences of all genomes are fed into Enredo to build sets of collinear blocks. These are aligned with Pecan and Ortheus resulting in an alignment with inferred ancestral sequences (in grey).
Figure 2.
Figure 2.
Adding the secondary set of species to an EPO alignment. (A) Overview of the process. The lower part of the panel represents the initial consistency-based multiple alignment, where the red line represents the human sequence. The upper part shows a mosaic structure for each secondary species. The grey vertical lines show the gaps added to the secondary genomes to accommodate them in the multiple alignment and how they match the deletions in the human sequence. (B) Detailed view on the removal of species-specific insertions and addition of gaps in a secondary genome. The left-hand side of the panel shows a segment of the multiple alignment and the matching pairwise alignments to a secondary genome. The right-hand side of the panel shows the resulting alignment. The highlighted blue T on the left-hand side is removed from the final multiple alignment. The deletions in the human lineage (also highlighted) are added in the secondary genome.
Figure 3.
Figure 3.
Coverage of constrained elements on the human and chicken genomes. (A) Overlap between the eutherian and amniote constrained elements on the human genome. The amniote elements cover a smaller portion of the genome because the 23-way amniote Mercator-Pecan alignment coverage is smaller and because elements that are conserved only in eutherian mammals might be missed when looking at all amniotes. (B) A similar plot for the chicken genome. Sauropsid-specific elements extracted from a 7-way sauropsid EPO alignment and the 23-way amniote Mercator-Pecan alignment are compared. In both cases, there is a fraction of the genome that is specifically detected as conserved when looking at all the amniotes. These regions are likely to be only mildly conserved and require the inclusion of more distant species to be detected.
Figure 4.
Figure 4.
GeneTree and Ensembl Protein Family pipelines. (A) GeneTree pipeline for protein-coding genes. For each protein-coding gene in Ensembl, a representative protein is used. BLAST scores are provided to hcluster_sg for grouping the sequences into gene families. The proteins are aligned with MCoffee or MAFFT and a phylogenetic tree is built with TreeBeST. Finally, orthologues and paralogues are inferred from the tree. (B) GeneTree pipeline for ncRNA genes. Short ncRNA genes in Ensembl are grouped according to their RFAM classification. Both Infernal and PRANK alignments are used to build several phylogenetic trees that are merged into a final model with TreeBeST. Finally, orthologues and paralogues are inferred from the tree. (C) Ensembl Protein Family pipeline. All proteins in Ensembl and all metazoan proteins in UniProt are used. BLAST scores are fed into MCL to group the sequences by their similarity. The proteins are aligned with MAFFT.
Figure 5.
Figure 5.
Gene Tree with split genes. GeneTree for the INSC gene in Ensembl release 80. The blue nodes in the tree represent speciation events and the light brown nodes are gene split events. The background color is used to show the different species clades (sauropsids, primates, teleost fish, etc.). Some nodes are collapsed (grey triangles) and show a summary of that sub-tree. The right part of the figure shows an overview of the alignment where the white areas correspond to gaps in the protein alignments. The three light brown rectangles highlight the three gene-split events in this family. The alignment overview for these genes clearly shows how the genes have been split.
Figure 6.
Figure 6.
Alignment and conservation tracks on the Location view. The image shows the 23-way amniote and 39-way eutherian conservation scores (pink wiggle tracks) and the corresponding constrained elements (brown blocks) on the FAM8A1 locus. The dark pink tracks at the bottom show the pairwise alignments of this region to the gorilla, the mouse and the platypus genomes. Each element represents an aligned block. These are connected in so-called nets that represent a series of alignment blocks in a congruent order and orientation. There is a secondary block in the gorilla pairwise alignment track, in the centre of the first FAM8A1 exon that represents a break in the continuity between human and gorilla in this region. Finally, the Age of Base track is displayed just below the contig line, and shows the how old each base of the genome is, ranging from human-specific mutations (in red) to primate-wide (shades of blue) and mammal-wide (shades of grey).
Figure 7.
Figure 7.
Different alignment views in Ensembl. (A) Region Comparison view for the human and marmoset HEY2 genes. The top part of the panel shows the human locus while the bottom half represents the marmoset locus. As in the Location view (Figure 6), the dark pink tracks show the pairwise alignments. The green areas link each part of the alignment blocks, showing the connections between both genomes. (B) The graphic alignment view for the same region. The human and marmoset sequences are stretched to accommodate the alignment gaps. The vertical white segments in the background color show these gaps. The marmoset sequence is made of several fragments, as indicated by the alignment. (C) Base-pair detail of the alignment for the first exon. Exonic sequence is highlighted in red, start ATG codons in yellow and sequence variants are coded in different colors. At the top of the alignment, the user is presented with the list of loci in this alignment. The marmoset sequence is split in two different segments. The black marks highlight the edges of the aligned regions.
Figure 8.
Figure 8.
Synteny view. The view shows the syntenic blocks between human chromosome 1 and the mouse chromosomes 1, 3, 4, 5, 6, 8, 11 and 13. The blocks are linked between the human and the mouse with a black line if they appear in the orientation and with a red line if they are inverted in one species with respect to the other.

References

    1. Lander E.S., Linton L.M., Birren B., et al. (2001) Initial sequencing and analysis of the human genome. Nature, 409, 860–921. - PubMed
    1. Venter J.C., Adams M.D., Myers E.W., et al. (2001) The sequence of the human genome. Science, 291, 1304–1351. - PubMed
    1. Lindblad-Toh K., Garber M., Zuk O., et al. (2011) A high- resolution map of human evolutionary constraint using 29 mammals. Nature, 478, 476–482. - PMC - PubMed
    1. Cooper G.M., Stone E.A., Asimenos G., et al. (2005) Distribution and intensity of constraint in mammalian genomic sequence. Genome Res., 15, 901–913. - PMC - PubMed
    1. Garber M., Guttman M., Clamp M., et al. (2009) Identifying novel constrained elements by exploiting biased substitution patterns. Bioinformatics, 25, i54–i62. - PMC - PubMed

Publication types