. 2016 Feb 20:17:125.
doi: 10.1186/s12864-016-2453-4.

Molecular foundations of chilling-tolerance of modern maize

Affiliations

Molecular foundations of chilling-tolerance of modern maize

Alicja Sobkowiak et al. BMC Genomics. .

Abstract

Background: Recent progress in selective breeding of maize (Zea mays L.) towards adaptation to temperate climate has allowed the production of inbred lines withstanding cold springs with temperatures below 8 °C or even close to 0 °C, indicating that despite its tropical origins maize is not inherently cold-sensitive.

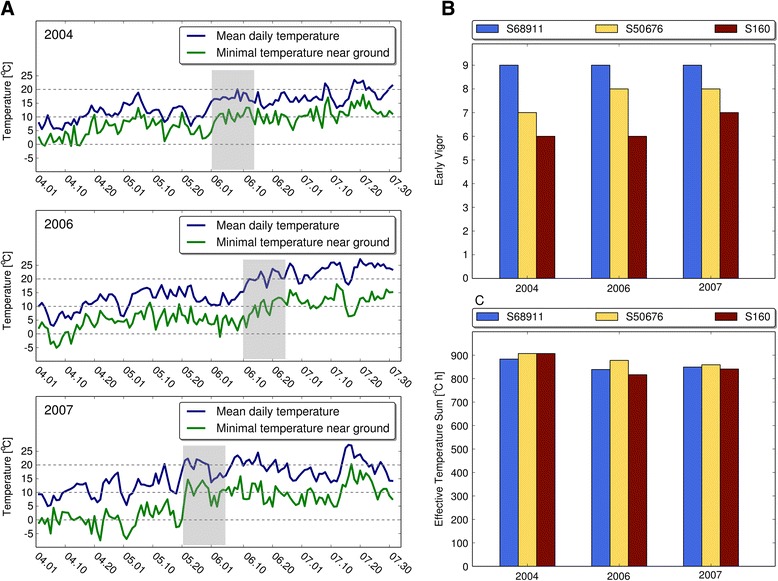
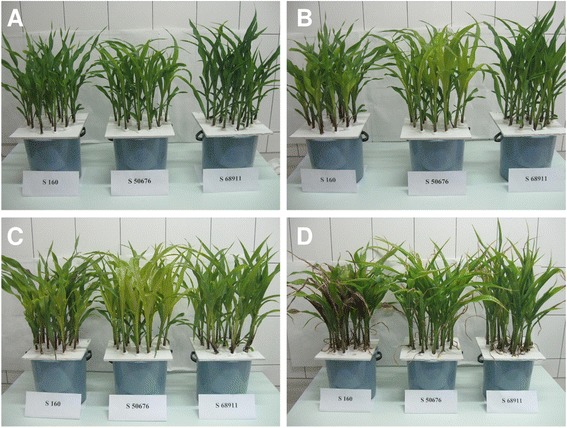
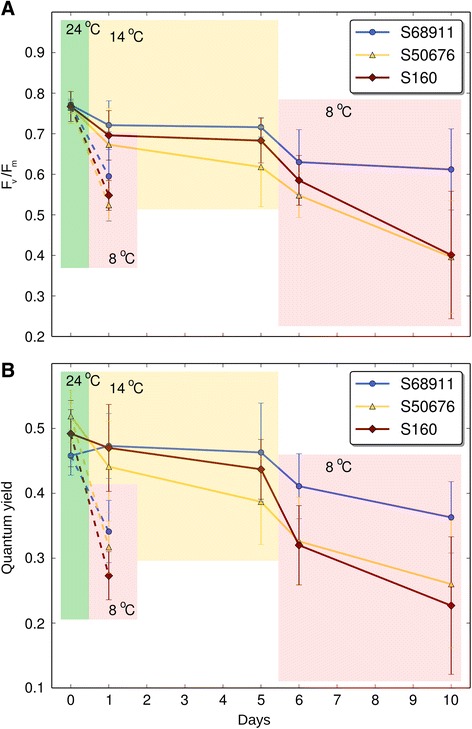
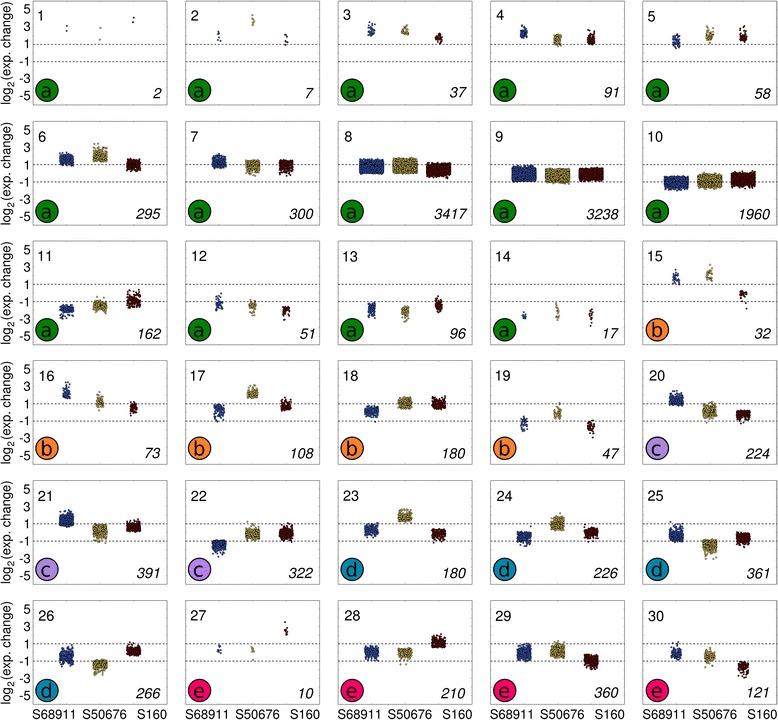
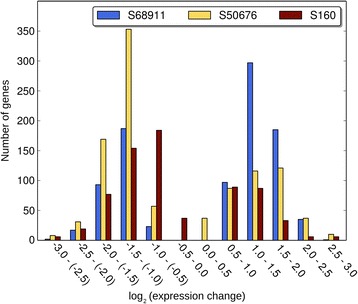
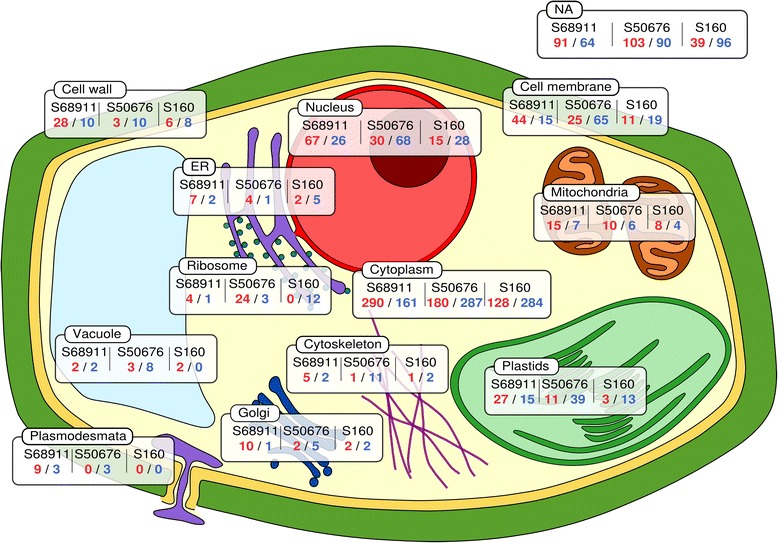
Results: Here we studied the acclimatory response of three maize inbred lines of contrasting cold-sensitivity selected basing on multi-year routine field data. The field observations were confirmed in the growth chamber. Under controlled conditions the damage to the photosynthetic apparatus due to severe cold treatment was the least in the cold-tolerant line provided that it had been subjected to prior moderate chilling, i.e., acclimation. The cold-sensitive lines performed equally poorly with or without acclimation. To uncover the molecular basis of the attained cold-acclimatability we performed comparative transcriptome profiling of the response of the lines to the cold during acclimation phase by means of microarrays with a statistical and bioinformatic data analysis.

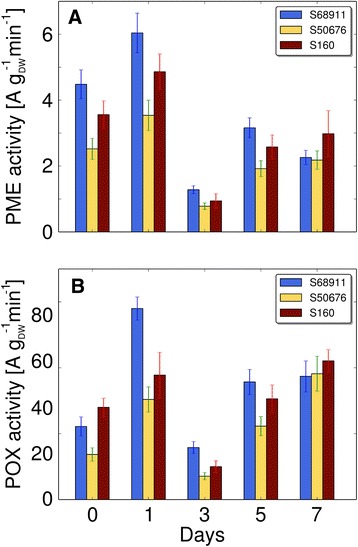
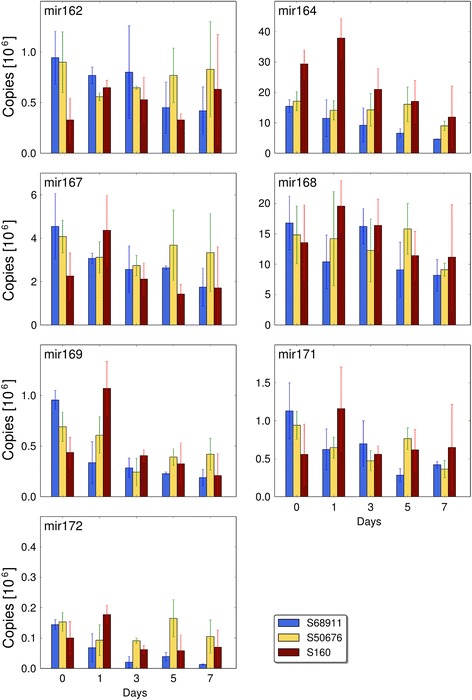
Conclusions: The analyses indicated three mechanisms likely responsible for the cold-tolerance: acclimation-dependent modification of the photosynthetic apparatus, cell wall properties, and developmental processes. Those conclusions supported the observed acclimation of photosynthesis to severe cold at moderate chilling and were further confirmed by experimentally showing specific modification of cell wall properties and repression of selected miRNA species, general regulators of development, in the cold-tolerant line subjected to cold stress.


Figures

Fig. 1
Fig. 1
Field parameters of three maize inbred lines at Smolice location. a Daily temperatures in years 2004, 2006, 2007; shadowing indicates time of early vigor evaluation; b. Early Vigor; c. Effective Temperature Sum
Fig. 2
Fig. 2
Seedling performance at various temperatures. Seedlings of three inbred lines were grown to V3 stage at 24 °C/22 °C (a), transferred for four days to 14 °C/12 °C (b), then for four days to 8 °C/6 °C (c), and finally for two days to 24 °C/22 °C (d). Photographs were taken at the end of each period
Fig. 3
Fig. 3
Maximum quantum efficiency of PSII primary photochemistry and effective quantum yield of PS II. Fv/Fm (a) and ΦPSII (b) were measured in the 3rd leaf of plants of three maize inbred lines grown at 24 °C/22 °C (control, day 0, green background), then the plants were transferred to 14 °C/12 °C for four days (acclimation, days 1 and 5, yellow background), and finally to 8 °C/6 °C for four days (severe cold, days 6 and 10, pink background). Alternatively, plants were transferred directly from 24 °C/22 °C to 8 °C/6 °C (pink background, broken lines). Data are means ± SD for three independent experiments with 3 - 5 plants per experiment
Fig. 4
Fig. 4
Clustering of genes according to magnitude of expression change upon cold treatment. Clusters were grouped manually into five sets (a – e) basing on the similarity of response in the three inbred lines studied. a. clusters 1-14, genes showing similar response in all three lines, from strongly induced to strongly repressed at low temperature, b. clusters 15-19, genes showing similar expression changes in two of the lines and no or small changes in the third line. c. clusters 20-22, genes specific to line S68911 (specific genes are defined as genes changing markedly - median magnitude of change in a cluster ≥2 – in a single line only), d. clusters 23-26, genes specific to line S50676. e. clusters 27-30, genes specific to line S160. Gene expression level was estimated in 3rd leaves of plants of three maize inbred lines treated with 14 °C/12 °C for 38 h (dark period + light period + dark period + 4 h of light period) in relation to the level in control plants grown at 24 °C/22 °C. The ratio of expression levels (ordinate) is shown as log2(cold/control). Inbred lines are indicated at the bottom of figure (abscissa). Each data point corresponds to a single gene; the points coalesce in densely populated regions. Cluster number is shown in left-hand top corner of each plot, cluster set in left-hand bottom corner, number of genes in a given cluster in right-hand bottom corner
Fig. 5
Fig. 5
Distribution of specific genes according to magnitude of expression change upon cold treatment. Specific genes are those showing up-regulation or down-regulation in a single inbred line only and no change in other two inbred lines. The ratio of expression levels is shown as log2(cold/control)
Fig. 6
Fig. 6
Predicted cellular localizations of products of specific genes. Specific genes are those showing up-regulation or down-regulation upon cold treatment in a single inbred line only and no change in other two inbred lines. Localization of proteins was assigned basing on GO annotation (Cellular Component) or InterPro domain description. Rectangles show the cell compartment and the numbers of up-regulated (red)/down-regulated genes (blue) in each inbred line. Proteins assigned to Cytoplasm include also those with a known annotation but unknown cytolocalization. Rectangle marked NA represents probes lacking annotation
Fig. 7
Fig. 7
Changes in activity of cell wall enzymes upon cold treatment. Plants of three maize inbred lines were grown at 24 °C/22 °C (control, day 0) and transferred to 14 °C/12 °C for seven days. Crude cell wall was prepared from 3rd leaves at time points indicated and enzyme activities were measured as described in Materials and Methods. a Pectin methylesterase activity (PME); b. Peroxidase activity (POX). Data are means ± SD for three independent experiments with three plants per experiment
Fig. 8
Fig. 8
Changes in cell wall cellulose content in various cell types upon cold treatment. Plants of three maize inbred lines were grown at 24 °C/22 °C (control, day 0) and transferred to 14 °C/12 °C for seven days. Third leaves were collected at time points indicated and cross-sections were stained for cellulose with Calcofluor White. Fluorescence was quantitated under a confocal microscope and expressed as normalized corrected total fluorescence (NCTF) as described in Materials and Methods. All values are expressed relative to the mean fluorescence at day 0 for a given line and cell type set at 1. a Vascular tissue; b. Bundle sheath; c. Kranz mesophyll; d. Whole veins. Data are means ± SD for at least 10 veins from three plants from three independent experiments
Fig. 9
Fig. 9
Changes in miRNA levels upon cold treatment. Plants of three maize inbred lines were grown at 24 °C/22 °C (control, day 0) and transferred to 14 °C/12 °C for seven days. Third leaves were collected at time points indicated, total RNA was isolated and individual miRNA species were quantitated as described in Materials and Methods. Data are means ± SD for three independent experiments with three plants each

References

    1. Walbot V. 10 reasons to be tantalized by the B73 maize genome. PLoS Genet. 2009;5:e1000723. doi: 10.1371/journal.pgen.1000723. - DOI - PMC - PubMed
    1. Schnable PS, Doreen Ware D, Fulton RS, Stein JC, Wei F, Pasternak S, et al. The B73 Maize genome: complexity, diversity, and dynamics. Science. 2009;326:1112–5. doi: 10.1126/science.1178534. - DOI - PubMed
    1. Stupar RM, Springer NM. Cis-transcriptional variation in maize inbred lines B73 and Mo17 leads to additive expression patterns in the F1 Hybrid. Genetics. 2006;173:2199–210. doi: 10.1534/genetics.106.060699. - DOI - PMC - PubMed
    1. Buckler ES, Gaut BS, McMullen MD. Molecular and functional diversity of maize. Curr Opin Plant Biol. 2006;9:172–6. doi: 10.1016/j.pbi.2006.01.013. - DOI - PubMed
    1. Troyer AF. Breeding adapted, popular maize hybrids. In: Tigersteld PMA, editor. Adaptation in Plant Breeding. Netherlands: Kluwer Academic Publishers; 1997. pp. 185–96.

Publication types

LinkOut - more resources