

Label-free electrochemical impedance biosensor to detect human interleukin-8 in serum with sub-pg/ml sensitivity
- PMID: 26897263
- PMCID: PMC4785862
- DOI: 10.1016/j.bios.2016.02.028
Label-free electrochemical impedance biosensor to detect human interleukin-8 in serum with sub-pg/ml sensitivity
Abstract
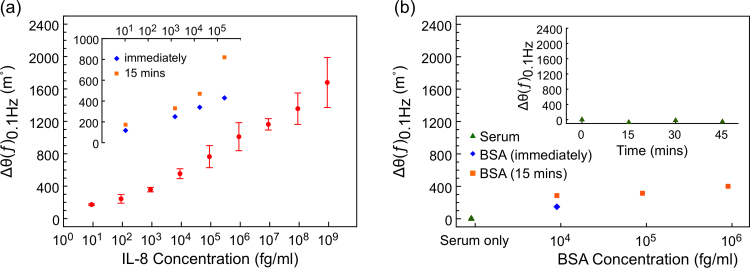
Biosensors with high sensitivity and short time-to-result that are capable of detecting biomarkers in body fluids such as serum are an important prerequisite for early diagnostics in modern healthcare provision. Here, we report the development of an electrochemical impedance-based sensor for the detection in serum of human interleukin-8 (IL-8), a pro-angiogenic chemokine implicated in a wide range of inflammatory diseases. The sensor employs a small and robust synthetic non-antibody capture protein based on a cystatin scaffold that displays high affinity for human IL-8 with a KD of 35 ± 10 nM and excellent ligand specificity. The change in the phase of the electrochemical impedance from the serum baseline, ∆θ(ƒ), measured at 0.1 Hz, was used as the measure for quantifying IL-8 concentration in the fluid. Optimal sensor signal was observed after 15 min incubation, and the sensor exhibited a linear response versus logarithm of IL-8 concentration from 900 fg/ml to 900 ng/ml. A detection limit of around 90 fg/ml, which is significantly lower than the basal clinical levels of 5-10 pg/ml, was observed. Our results are significant for the development of point-of-care and early diagnostics where high sensitivity and short time-to-results are essential.
Keywords: Antibody mimetic protein; CXCL8; Electrochemical impedance spectroscopy; Interleukin-8; Label-free biosensor; Point-of-care diagnostics.
Copyright © 2016 The Authors. Published by Elsevier B.V. All rights reserved.
Figures


References
-
- Apostolakis S., Vogiatzi K., Amanatidou V., Spandidos D.A. Cardiovasc. Res. 2009;84:353–360. - PubMed
-
- Bard A.J., Faulkner L.R. second ed. John Wiley & Sons Inc; 2000. Electrochemical Methods: Fundamentals and Applications.
-
- Benoy I.H., Salgado R., Van Dam P., Geboers K., Van Marck E., Scharpé S., Vermeulen P.B., Dirix L.Y. Clin. Cancer Res. 2004;10:7157–7162. - PubMed
-
- Berggren C., Bjarnason B., Johansson G. Biosens. Bioelectron. 1998;13:1061–1068. - PubMed
-
- Berggren C., Bjarnason B., Johansson G. Electroanalysis. 2001;13:173–180.
Publication types
MeSH terms
Substances
Grants and funding
LinkOut - more resources
Full Text Sources
Other Literature Sources
Molecular Biology Databases
