

Mouse mesenchymal stem cells inhibit high endothelial cell activation and lymphocyte homing to lymph nodes by releasing TIMP-1
- PMID: 26898191
- PMCID: PMC4858586
- DOI: 10.1038/leu.2016.33
Mouse mesenchymal stem cells inhibit high endothelial cell activation and lymphocyte homing to lymph nodes by releasing TIMP-1
Abstract
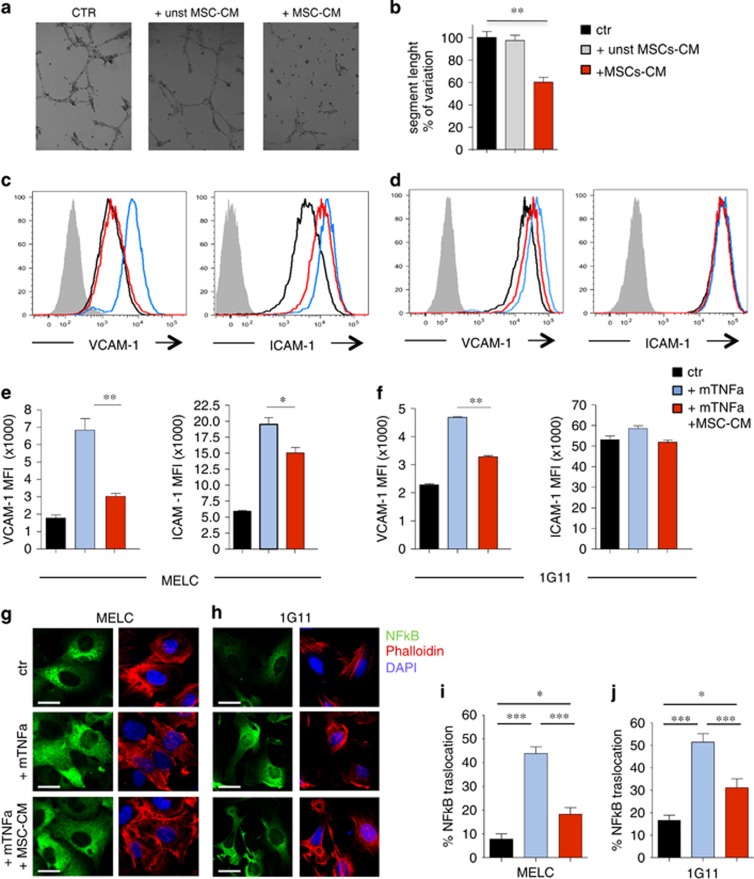
Mesenchymal stem cells (MSC) represent a promising therapeutic approach in many diseases in view of their potent immunomodulatory properties, which are only partially understood. Here, we show that the endothelium is a specific and key target of MSC during immunity and inflammation. In mice, MSC inhibit activation and proliferation of endothelial cells in remote inflamed lymph nodes (LNs), affect elongation and arborization of high endothelial venules (HEVs) and inhibit T-cell homing. The proteomic analysis of the MSC secretome identified the tissue inhibitor of metalloproteinase-1 (TIMP-1) as a potential effector molecule responsible for the anti-angiogenic properties of MSC. Both in vitro and in vivo, TIMP-1 activity is responsible for the anti-angiogenic effects of MSC, and increasing TIMP-1 concentrations delivered by an Adeno Associated Virus (AAV) vector recapitulates the effects of MSC transplantation on draining LNs. Thus, this study discovers a new and highly efficient general mechanism through which MSC tune down immunity and inflammation, identifies TIMP-1 as a novel biomarker of MSC-based therapy and opens the gate to new therapeutic approaches of inflammatory diseases.
Figures


Similar articles
-
Proteomic analysis of the secretome of human bone marrow-derived mesenchymal stem cells primed by pro-inflammatory cytokines.J Proteomics. 2017 Aug 23;166:115-126. doi: 10.1016/j.jprot.2017.07.012. Epub 2017 Jul 21. J Proteomics. 2017. PMID: 28739509
-
Mesenchymal stem cells inhibit both endogenous and exogenous MMPs via secreted TIMPs.J Cell Physiol. 2011 Feb;226(2):385-96. doi: 10.1002/jcp.22344. J Cell Physiol. 2011. PMID: 20665704
-
Mesenchymal stem cells engineered to express selectin ligands and IL-10 exert enhanced therapeutic efficacy in murine experimental autoimmune encephalomyelitis.Biomaterials. 2016 Jan;77:87-97. doi: 10.1016/j.biomaterials.2015.11.005. Epub 2015 Nov 10. Biomaterials. 2016. PMID: 26584349 Free PMC article.
-
Mesenchymal stem/stromal cells as a pharmacological and therapeutic approach to accelerate angiogenesis.Pharmacol Ther. 2014 Aug;143(2):181-96. doi: 10.1016/j.pharmthera.2014.02.013. Epub 2014 Mar 1. Pharmacol Ther. 2014. PMID: 24594234 Review.
-
The influence of macrophages on mesenchymal stromal cell therapy: passive or aggressive agents?Clin Exp Immunol. 2017 Apr;188(1):1-11. doi: 10.1111/cei.12929. Epub 2017 Feb 20. Clin Exp Immunol. 2017. PMID: 28108980 Free PMC article. Review.
Cited by
-
Human Bone Marrow Mesenchymal Stem Cells Promote Gastric Cancer Growth via Regulating c-Myc.Stem Cells Int. 2018 Jul 18;2018:9501747. doi: 10.1155/2018/9501747. eCollection 2018. Stem Cells Int. 2018. PMID: 30186330 Free PMC article.
-
CD73+ extracellular vesicles inhibit angiogenesis through adenosine A2B receptor signalling.J Extracell Vesicles. 2020 May 4;9(1):1757900. doi: 10.1080/20013078.2020.1757900. eCollection 2020. J Extracell Vesicles. 2020. PMID: 32489531 Free PMC article.
-
Phosphoproteomic mapping of CCR5 and ACKR2 signaling properties.Front Mol Biosci. 2022 Nov 22;9:1060555. doi: 10.3389/fmolb.2022.1060555. eCollection 2022. Front Mol Biosci. 2022. PMID: 36483536 Free PMC article.
-
Mass spectrometric analysis of the in vitro secretome from equine bone marrow-derived mesenchymal stromal cells to assess the effect of chondrogenic differentiation on response to interleukin-1β treatment.Stem Cell Res Ther. 2020 May 20;11(1):187. doi: 10.1186/s13287-020-01706-7. Stem Cell Res Ther. 2020. PMID: 32434555 Free PMC article.
-
Effects of mesenchymal stem cell transplantation on spinal cord injury patients.Cell Tissue Res. 2022 Sep;389(3):373-384. doi: 10.1007/s00441-022-03648-3. Epub 2022 Jun 14. Cell Tissue Res. 2022. PMID: 35697943 Review.
References
-
- Caplan AI. Mesenchymal stem cells. J Orthop Res 1991; 9: 641–650. - PubMed
-
- Crisan M, Yap S, Casteilla L, Chen CW, Corselli M, Park TS et al. A perivascular origin for mesenchymal stem cells in multiple human organs. Cell Stem Cell 2008; 3: 301–313. - PubMed
-
- Covas DT, Panepucci RA, Fontes AM, Silva WA Jr., Orellana MD, Freitas MC et al. Multipotent mesenchymal stromal cells obtained from diverse human tissues share functional properties and gene-expression profile with CD146+ perivascular cells and fibroblasts. Exp Hematol 2008; 36: 642–654. - PubMed
-
- Frenette PS, Pinho S, Lucas D, Scheiermann C. Mesenchymal stem cell: keystone of the hematopoietic stem cell niche and a stepping-stone for regenerative medicine. Annu Rev Immunol 2013; 31: 285–316. - PubMed
MeSH terms
Substances
LinkOut - more resources
Full Text Sources
Other Literature Sources
Research Materials
Miscellaneous
