. 2016 Feb 25;164(5):859-71.
doi: 10.1016/j.cell.2016.01.024. Epub 2016 Feb 18.

Sialylated Milk Oligosaccharides Promote Microbiota-Dependent Growth in Models of Infant Undernutrition

Affiliations

Sialylated Milk Oligosaccharides Promote Microbiota-Dependent Growth in Models of Infant Undernutrition

Mark R Charbonneau et al. Cell. .

Abstract

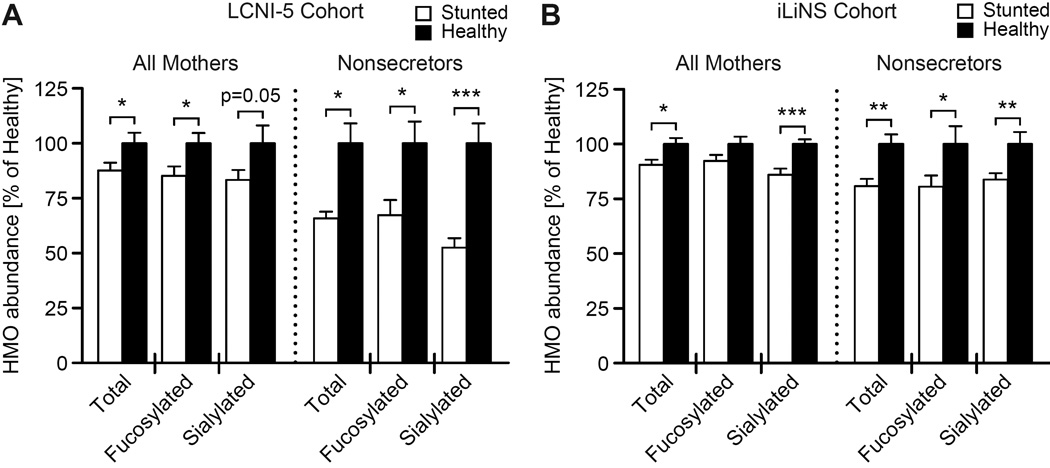
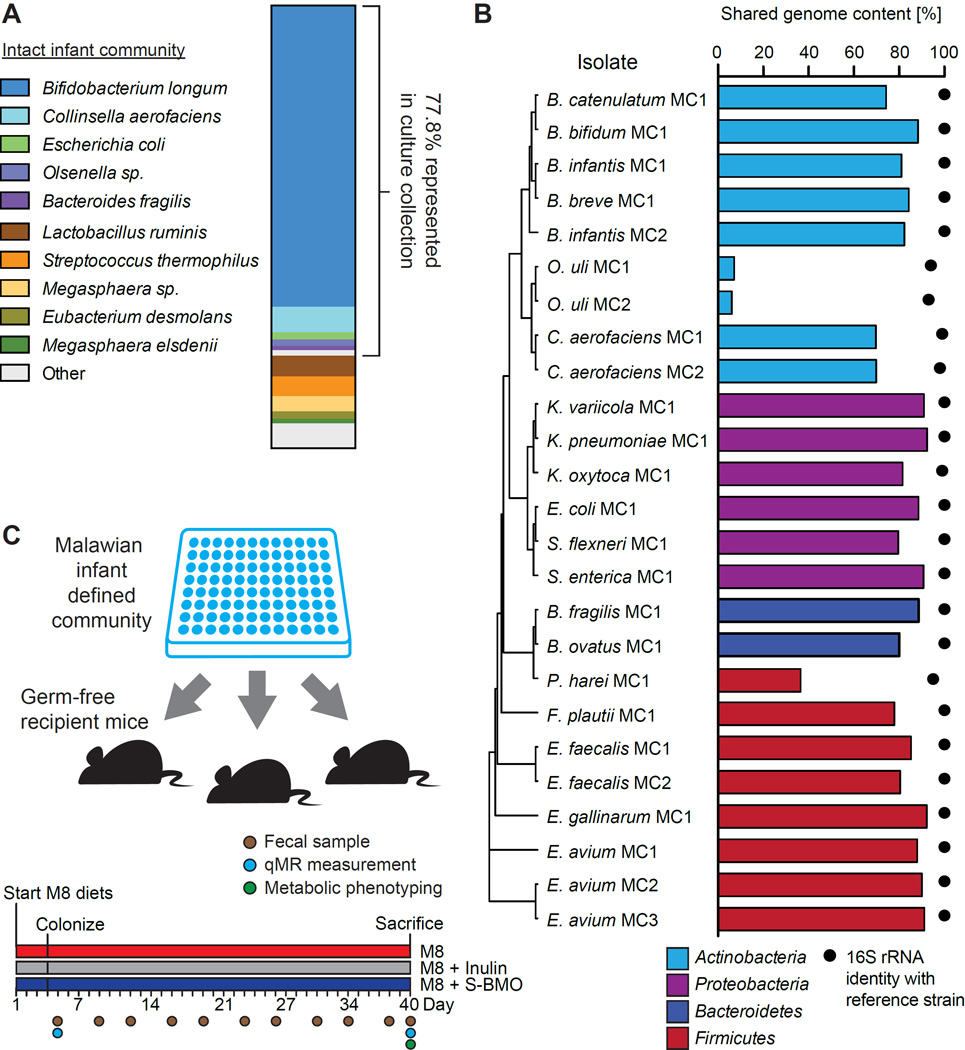
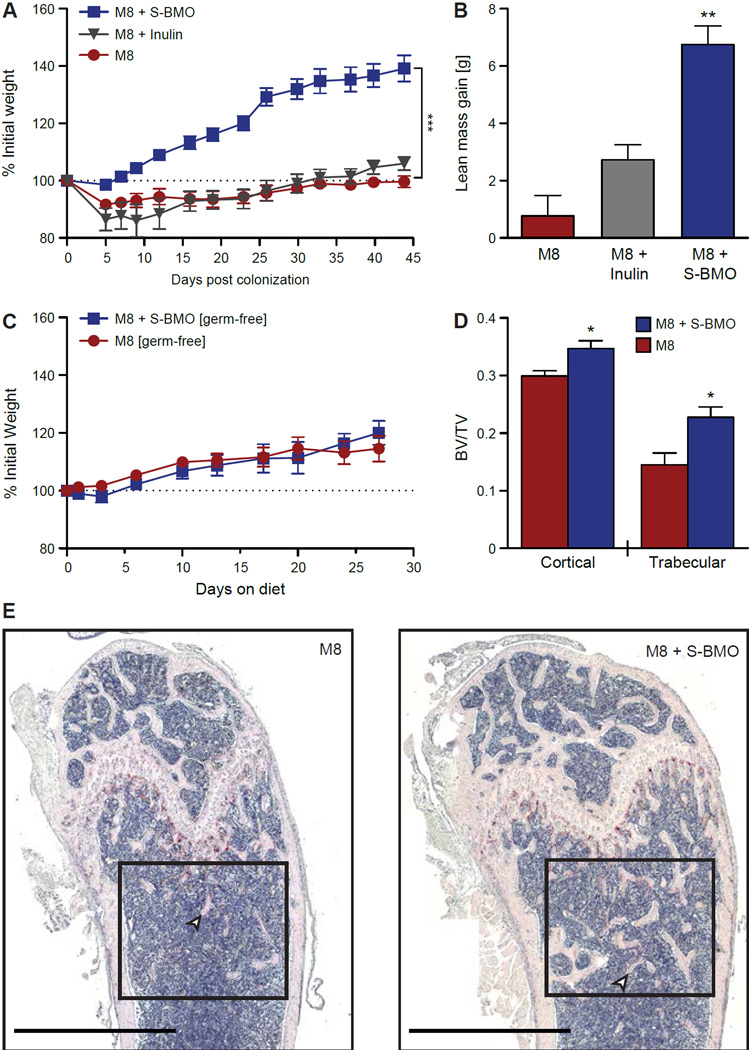
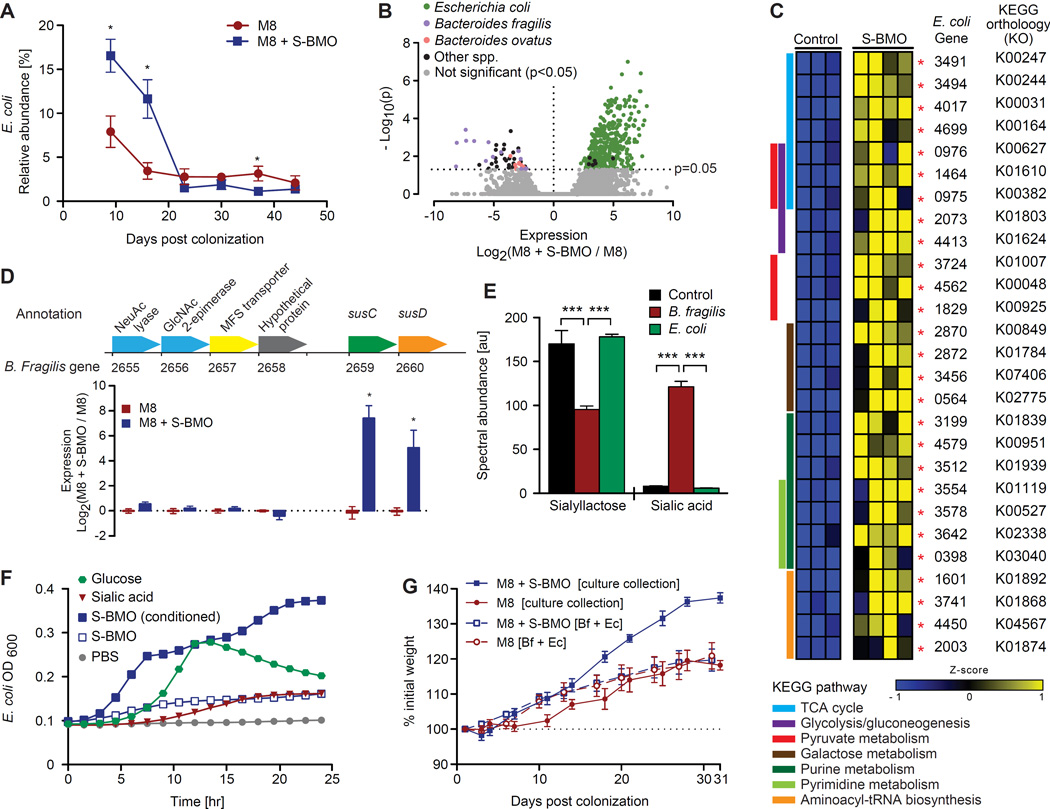
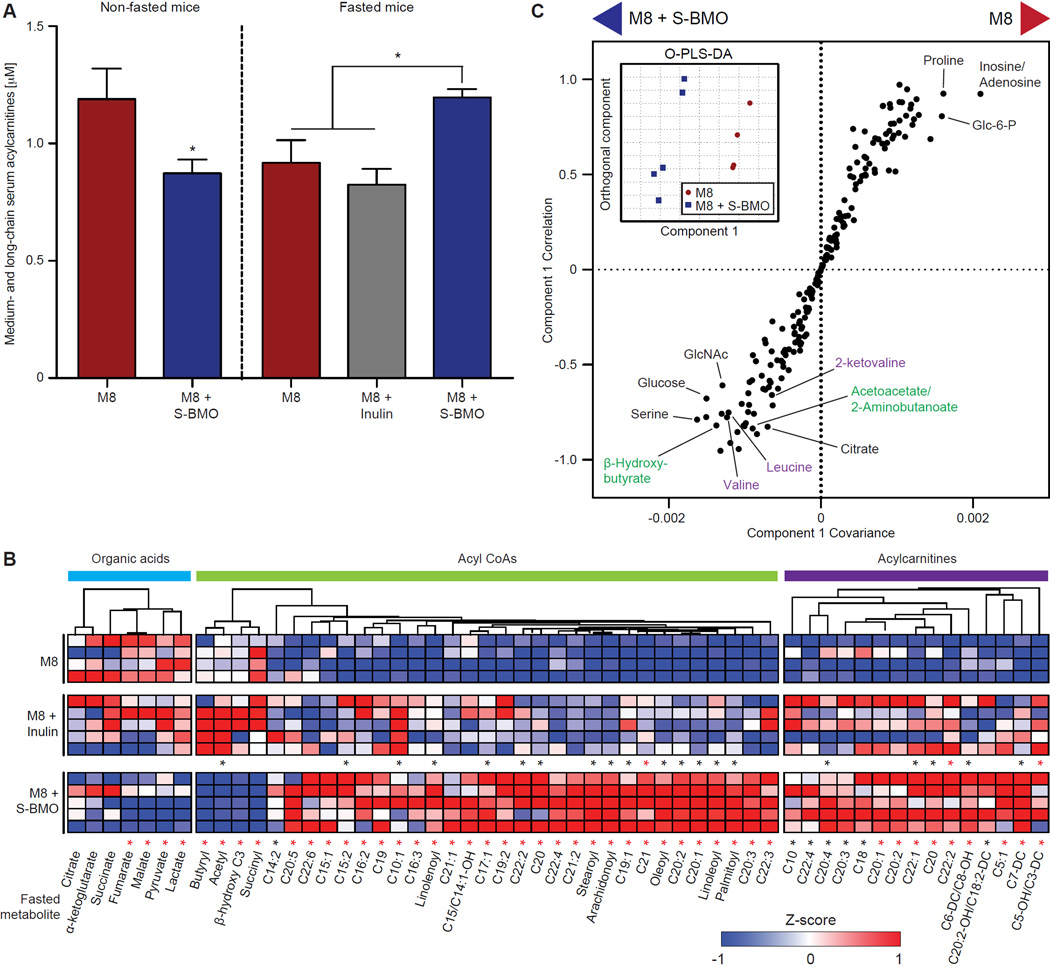
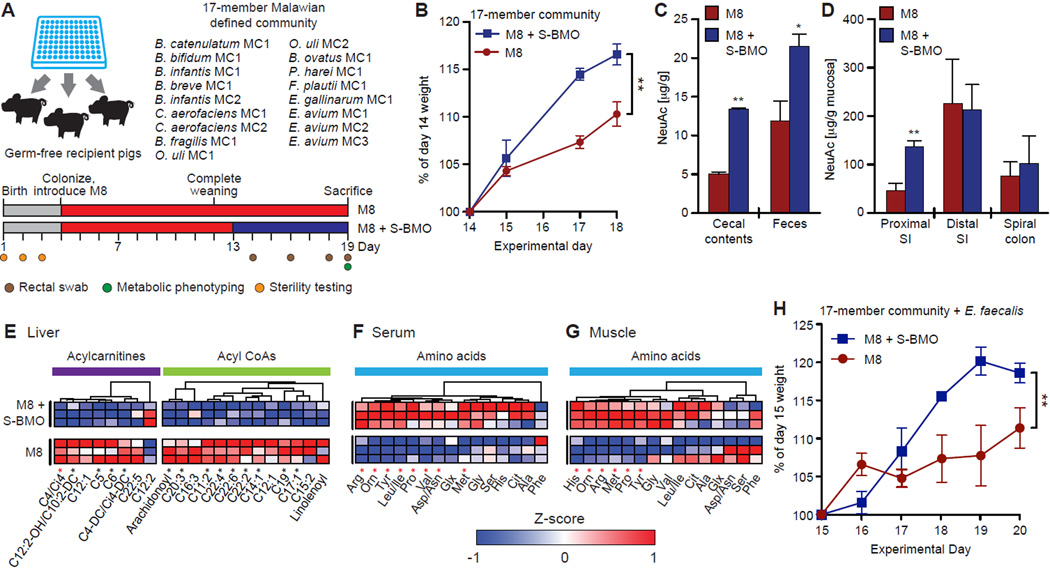
Identifying interventions that more effectively promote healthy growth of children with undernutrition is a pressing global health goal. Analysis of human milk oligosaccharides (HMOs) from 6-month-postpartum mothers in two Malawian birth cohorts revealed that sialylated HMOs are significantly less abundant in those with severely stunted infants. To explore this association, we colonized young germ-free mice with a consortium of bacterial strains cultured from the fecal microbiota of a 6-month-old stunted Malawian infant and fed recipient animals a prototypic Malawian diet with or without purified sialylated bovine milk oligosaccharides (S-BMO). S-BMO produced a microbiota-dependent augmentation of lean body mass gain, changed bone morphology, and altered liver, muscle, and brain metabolism in ways indicative of a greater ability to utilize nutrients for anabolism. These effects were also documented in gnotobiotic piglets using the same consortium and Malawian diet. These preclinical models indicate a causal, microbiota-dependent relationship between S-BMO and growth promotion.


Figures

Figure 1
Figure 1. HMOs are more abundant in breast milk of Malawian mothers with healthy infants
(A,B) Abundance of total, fucosylated and sialylated HMOs present in breast milk of Malawian mothers collected from the LCNI-5 cohort (n=88 mothers, panel A) and iLiNS-DYAD-M cohort (n=215 mothers, panel B) 6 months postpartum, binned by anthropometry of their infants (LCNI-5 healthy, HAZ>0; stunted, HAZ<- 3; iLiNS-DYAD-M healthy, HAZ>0; stunted, HAZ< −2). HMO abundance values correspond to LC-TOF MS spectral abundance (mean±SEM), normalized to the mean abundance of samples assigned to the healthy bin for each respective comparison. *p<0.05, **p<0.01, ***p<0.001 (two-tailed, Welch’s t-test). See also Table S1.
Figure 2
Figure 2. Cultured bacterial strain collection generated from the fecal microbiota of a 6-month old stunted Malawian infant
(A) Taxonomic representation of 97% ID OTUs in the intact, uncultured infant fecal sample from which the culture collection was generated. (B) Comparison of culture collection strains and representative type strains. Black dots indicate percent identity between full-length 16S rRNA gene sequences from each strain and its most similar reference type strain’s 16S rRNA sequence. Bars indicate percent nucleotide sequence similarity between the strain’s de novo assembled genome and its most similar type strain’s genome. Strains are clustered by Euclidean distance between full-length 16S rRNA gene sequences. (C) Design of gnotobiotic mouse experiments. See also Table S2.
Figure 3
Figure 3. S-BMO promotes growth in gnotobiotic mice harboring the Malawian infant culture collection and fed a prototypic Malawian diet
(A) Weight gain of mice over time normalized to body weight at the time of colonization. (B) Lean body mass gain 44 days after colonization of mice fed M8 ± inulin or S-BMO. (C) Weight gain over time of germ-free mice fed M8±S-BMO for 4 weeks (normalized to weight at 5 weeks of age). (D) Cortical and trabecular bone volume/tissue volume (BV/TV; TV = cortical area + medullary area). (E) Representative histomorphometry images of femurs from mice colonized with the culture collection and fed M8 ± S-BMO. Black boxes highlight the trabecular region of interest, and arrowheads point to examples of trabeculae. Scale bars, 1 mm. For (A), ***p<0.001, two-way, repeated measures ANOVA. For (B) and (D), *p<0.05, **p<0.01 two-tailed, unpaired Student’s t-test. All values are represented as mean±SEM, and all comparisons are made to M8 controls. See also Figure S1 and Table S5.
Figure 4
Figure 4. Members of the gut microbiota respond transcriptionally to S-BMO in vivo and degrade S-BMO in vitro
(A) Relative abundance of E. coli (mean±SEM) over time in the fecal microbiota of gnotobiotic mice colonized with the stunted Malawian infant’s culture collection and fed M8 ± S-BMO. *p<0.05 two-tailed, unpaired Student’s t-test. (B) Volcano plot of bacterial gene expression in the cecal microbiota of gnotobiotic mice. Expression is plotted on the x-axis as the log2 fold difference between S-BMO-supplemented mice and unsupplemented mice. Significantly up- or downregulated genes are labeled in black or by bacterial species of origin. −Log10(p-values) are plotted on the y-axis (Benjamini-Hochberg corrected negative binomial test). (C) Heatmap of select differentially expressed E. coli genes, grouped by KEGG functional pathway (see Table S6 for a full list). Red asterisks denote that differences in expression are statistically significant after Benjamini-Hochberg correction for multiple hypotheses (α=0.1). (D) Effects of S-BMO on expression of genes in a B. fragilis PUL. Expression is plotted on the y-axis as the log2 fold difference (mean±SEM) between S-BMO-supplemented and control mice. *p<0.05, **p<0.01 (two-tailed, unpaired Student’s t-test). (E) Abundance (mean±SEM) of siallyllactose and sialic acid in E. coli or B. fragilis monoculture supernatants after a 24-hour incubation with 5% S-BMO. Control incubations contained uninoculated PBS buffer. ***p<0.001 two-tailed, unpaired Student’s t-test. (F) OD600 (mean±SEM) of E. coli grown in minimal medium containing various single carbon sources. ‘Conditioned S-BMO’ refers to filter-sterilized supernatant from a 24-hour monoculture of B. fragilis with S-BMO. (G) Mouse weights (mean±SEM), normalized to values at time of colonization with the entire Malawian infant culture collection or with only B. fragilis and E. coli (Bf + Ec). Mice were fed M8 ± S-BMO (n=5 mice/group).
Figure 5
Figure 5. S-BMO supplementation alters levels of serum and liver metabolites in gnotobiotic mice
(A) Total concentrations of medium- and long-chain serum acylcarnitines (chain length ≥10) in fasted or non-fasted gnotobiotic mice fed M8 ± S-BMO or inulin (mean±SEM values shown). *p<0.05, Student’s t-test. (B) Liver metabolites whose concentrations are impacted by S-BMO-treatment in fasted mice. Rows represent replicate mice, grouped by dietary treatment. Columns represent individual metabolites whose concentrations are represented as Z-scores. *p<0.05 (two-tailed, unpaired Student’s t-test). All comparisons are made to controls. Red asterisks represent significant differences between groups after Benjamini-Hochberg correction for multiple hypotheses (α=0.1). See Table S7A,B for concentrations of all measured metabolites. (C) O-PLS-DA score plot (inset) and O-PLS-DA S-plot of fasted serum metabolites in gnotobiotic mice fed M8 ± S-BMO. Metabolites highlighted in purple are branched-chain amino acid metabolites while those in green are ketone body metabolites. See also Figure S2 and Figure S3.
Figure 6
Figure 6. S-BMO modulates growth and metabolism in gnotobiotic piglets
(A) Experimental design. The treatment group was fed M8+S-BMO (blue bars) while controls were fed the M8 diet alone (red bars). (B) Weight gain normalized to body weight at postnatal day 14 (mean±SEM). **p<0.01, two-way, repeated measures ANOVA. (C,D) N-acetylneuraminic acid (NeuAc) concentrations in cecal contents and feces (panel C), as well as in proximal and distal small intestine (SI) and spiral colon mucosa (panel D), harvested from gnotobiotic piglets fed M8±S-BMO. *p<0.05, **p<0.01 two-tailed, unpaired Student’s t-test. (E) Heatmap displaying acylcarnitine and fatty acyl CoA concentrations in the livers of non-fasted gnotobiotic piglets. (F,G) Amino acid concentrations in (F) serum and (G) skeletal muscle obtained from non-fasted gnotobiotic piglets. In panels E,F, columns represent individual metabolites, and rows represent replicate gnotobiotic piglets, grouped by treatment. *p<0.05 (two-tailed, unpaired Student’s t-test). Metabolite concentrations are displayed as Z-scores (normalized by column). Red asterisks denote statistical significance after Benjamini-Hochberg correction (α=0.1; all comparisons are made to M8 controls). (H) Weight gain normalized to body weight at postnatal day 15 (mean±SEM) in gnotobiotic piglets colonized with the 17-member consortium used in panel B but with the addition of two strains of Enterococcus faecalis (E. faecalis MC1 and E. faecalis MC2), **p<0.01, two-way, repeated measures ANOVA. See also Figure S1, Figure S6, Table S7C and Table S8

Comment in

References

    1. Aldredge DL, Geronimo MR, Hua SS, Nwosu CC, Lebrilla CB, Barile D. Annotation and structural elucidation of bovine milk oligosaccharides and determination of novel fucosylated structures. Glycobiology. 2013;23:664–676. - PMC - PubMed
    1. Almagro-Moreno S, Boyd EF. Sialic acid catabolism confers a competitive advantage to pathogenic vibrio cholerae in the mouse intestine. Infect Immun. 2009;77:3807–3816. - PMC - PubMed
    1. Anders S, Huber W. Differential expression analysis for sequence count data. Genome Biol. 2010;11:R106. - PMC - PubMed
    1. Ashorn P, Alho L, Ashorn U, Cheung YB, Dewey KG, Harjunmaa U, Lartey A, Nkhoma M, Phiri N, Phuka J, et al. The impact of lipid-based nutrient supplement provision to pregnant women on newborn size in rural Malawi: A randomised controlled trial. Am J Clin Nutr. 2015;101:387–397. - PubMed
    1. Bartz S, Mody A, Hornik C, Bain J, Muehlbauer M, Kiyimba T, Kiboneka E, Stevens R, Bartlett J, St Peter JV, et al. Severe acute malnutrition in childhood: hormonal and metabolic status at presentation, response to treatment, and predictors of mortality. J Clin Endocr Metab. 2014;99:2128–2137. - PMC - PubMed

Publication types

MeSH terms