. 2016 Feb 25;164(5):1031-45.
doi: 10.1016/j.cell.2016.01.032. Epub 2016 Feb 18.

Axon Degeneration Gated by Retrograde Activation of Somatic Pro-apoptotic Signaling

Affiliations

Axon Degeneration Gated by Retrograde Activation of Somatic Pro-apoptotic Signaling

David J Simon et al. Cell. .

Abstract

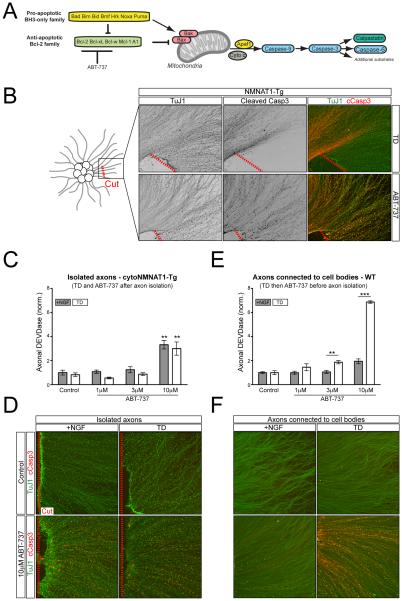
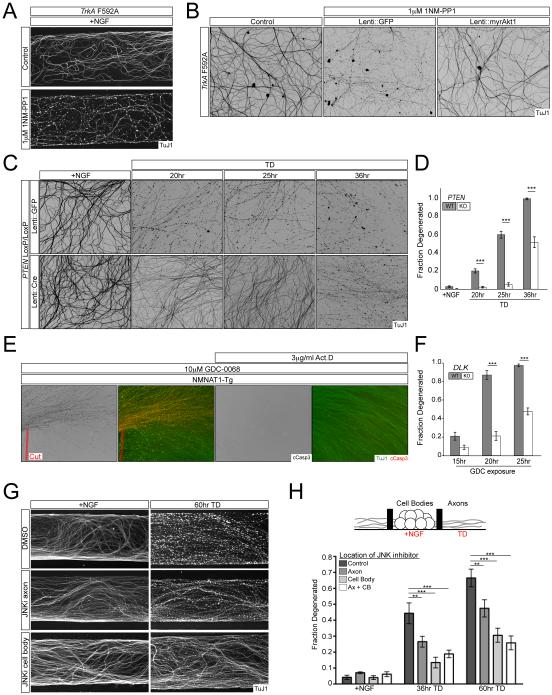
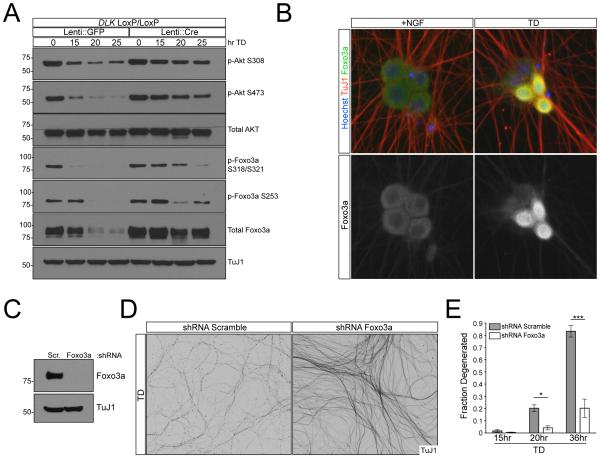
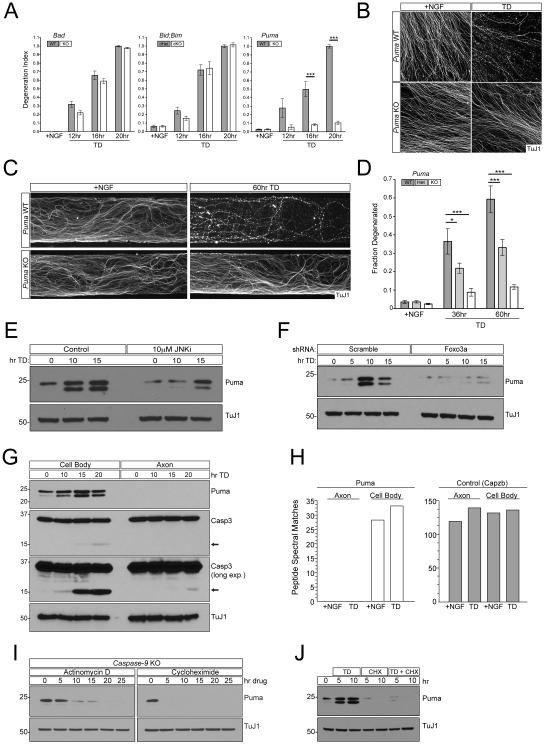
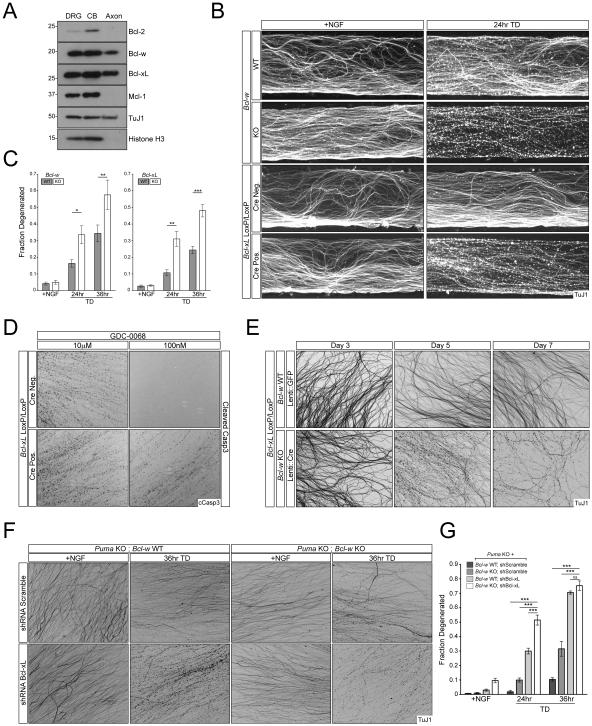
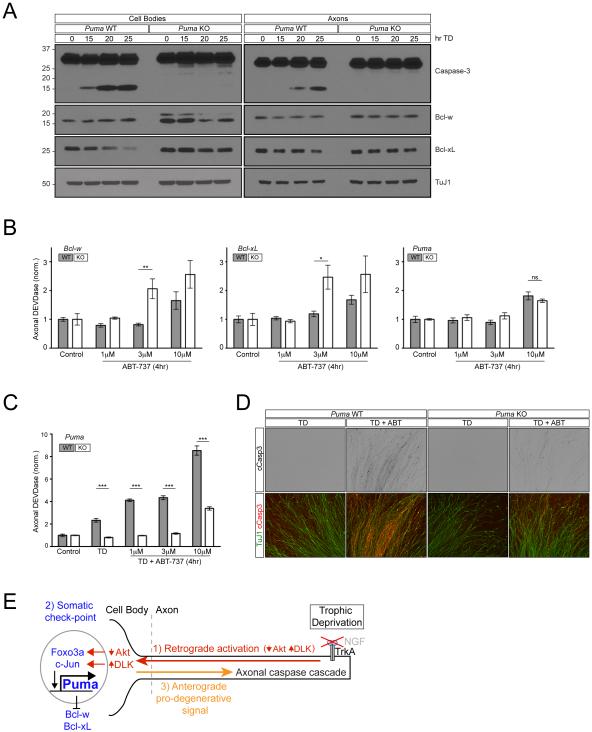
During development, sensory axons compete for limiting neurotrophic support, and local neurotrophin insufficiency triggers caspase-dependent axon degeneration. The signaling driving axon degeneration upon local deprivation is proposed to reside within axons. Our results instead support a model in which, despite the apoptotic machinery being present in axons, the cell body is an active participant in gating axonal caspase activation and axon degeneration. Loss of trophic support in axons initiates retrograde activation of a somatic pro-apoptotic pathway, which, in turn, is required for distal axon degeneration via an anterograde pro-degenerative factor. At a molecular level, the cell body is the convergence point of two signaling pathways whose integrated action drives upregulation of pro-apoptotic Puma, which, unexpectedly, is confined to the cell body. Puma then overcomes inhibition by pro-survival Bcl-xL and Bcl-w and initiates the anterograde pro-degenerative program, highlighting the role of the cell body as an arbiter of large-scale axon removal.


Figures

Figure 1
Figure 1. Axon degeneration after TD requires the cell body
A) The mitochondrial apoptotic pathway is regulated by pro- and anti-apoptotic members of the Bcl-2 family. The balance of these factors regulates Bax/Bak oligimerization and activation of downstream Caspases. B) Following 2 days in vitro (DIV), a portion of the axons in the explants from cytoNMNAT1-Tg mice were physically severed from their cell bodies (indicated with a dashed red line) followed immediately by TD (top row) or the addition of 10µM ABT-737 (bottom row) for 9hr and 4hr, respectively. C and D) Axons from 2 DIV cytoNMNAT1-Tg dissociated and re-aggregated cultures were severed from their cell bodies (dashed red line) and treated with ABT-737 for 4hr in the presence of NGF or following 2hr TD (for a total of 6hr TD) as indicated. DEVDase activity of isolated axons was subsequently measured by the Caspase-Glo-3/7 assay (C) or with immunostaining (D). n=4 for all conditions except 1µM and 10µM ABT-737 plus TD where n=3. Values are normalized to the average value of the +NGF control condition. Statistical significance for each 10µM dose is determined relative its respective Control condition. E and F) Intact DRG cultures were treated with ABT-737 in the presence of NGF or following 2hr TD (for a total of 6hr) as indicated. Following treatment, either cell bodies were removed and axonal DEVDase activity was measured as above (E) or cleaved Caspase-3 was visualized with immunostaining (F). n=4 for all conditions except 10µM ABT-737 plus TD where n=3. Values are normalized to the average value of the +NGF control condition. Here and throughout, values are presented as mean ± SEM; *p<.05; **p<.01; ***p<.001
Figure 2
Figure 2. Akt and JNK signaling regulate axon degeneration via the cell body
A) TrkA F592A knock-in DRGs were cultured in Campenot chambers and the axonal compartment was treated with vehicle or 1µM 1NM-PP1 for 24hr. B) TrkA F592A dissociated DRG cultures were transduced with lentivirus expressing myristoylated-Akt1, Bcl-xL, or GFP and treated with 1µM 1NM-PP1 for 24hr. Lentiviral Bcl-xL overexpression also provided similar axonal protection (data not shown). C and D) PTENloxP/loxP dissociated and reaggregated DRG cultures were transduced with lentivirus expressing CRE or GFP and axon degeneration following TD was visualized (C) and quantified (D). n=5 for Lenti::GFP conditions and n=6 for Lenti::Cre conditions except 25hr TD where n=7 E) Axons from cytoNMNAT1-Tg explants were severed from their cell bodies (dashed red line) or pre-treated with 3µg/ml Actinomycin D for 1hr prior to addition of 10µM GDC-0068 for 12hrs. F) DLKloxP/loxP DRG cultures were transduced with lentivirus expressing GFP or Cre and subjected to treatment with 10µM GDC-0068 and axon degeneration was quantified over time. For Lenti::GFP n=5 (15hr), n=7 (20hr), and n=4 (25hr). For Lenti::Cre n=8 for all conditions. Representative images are presented in Figure S2F. G and H) DRGs were cultured in Campenot chambers where cell bodies and axons are separated by a grease barrier that allows for fluidic isolation (see illustration). Cultures were treated with 10µM JNK inhibitor VIII or vehicle in either or both the cell body and axonal compartments, followed by TD as indicated. Degeneration was visualized (G) and quantified (H). n=4 for each condition.
Figure 3
Figure 3. Foxo3a functions downstream of Akt during TD
A) DLKloxP/loxP DRG cultures were transduced with lentivirus expressing GFP or Cre and lysed at indicated time points after TD. Phosphorylation of Akt and Foxo3a was assessed by immunoblot. B) 7DIV WT dissociated DRGs were subjected to TD for 9hr. Foxo3a localization was visualized with immunostaining. C) Knockdown of Foxo3a was confirmed by immunoblot. D and E) WT dissociated and reaggregated DRG cultures were subjected to lentiviral-shRNA knockdown of Foxo3a or Scrambled control. Axon degeneration after TD was visualized (D) and quantified (E).
Figure 4
Figure 4. Puma promotes axon degeneration downstream of Foxo3a
A and B) 2 DIV DRG cultures from the indicated genotypes were subjected to TD for indicated times. Axon degeneration was visualized with immunostaining and quantified (A). Representative images shown for Puma KO compared to WT(B). n=4 for Bad KO and WT. n=3 for Bid;Bim dKO and dHet. n=4 KO and 7 WT for Puma. Representative images for Bad and Bid;Bim cultures are presented in Figure S3A. C and D) Puma WT, Het, or KO DRGs were cultured in Campenot chambers and the axonal compartment was subject to TD for the indicated times. Degeneration was visualized (C) and quantified (D). n=6 +NGF, n=6 36hr TD, and n=5 60hr TD for WT. n=6 +NGF, n=6 36hr TD, and n=3 60hr TD for Het. n=8 TD, n=7 36hr TD, and n=3 60hr TD for KO. E) WT DRG cultures were treated with 10µM JNK inhibitor VIII or vehicle and protein was harvested at indicated time points after TD. Puma expression was assayed by immunoblot. F) WT dissociated and reaggregated DRG cultures were subjected to lentiviral-shRNA knockdown of Foxo3a or Scrambled control. Protein was harvested at indicated time points after TD. Puma expression was assayed by immunoblot. G) Separate cell body and axonal preparations were collected from WT DRG cultures at indicated time points after TD and subjected to immunoblot analysis. H) At 12DIV Large-scale cultures made from WT embryonic DRGs were subjected to TD for 24hr. Separate cell body and axonal samples were collected and analyzed by tandem mass spectrometry. The number of peptide spectral matches are shown for each sample for either Bbc3 (Puma) or the loading control Capzb (capping protein actin filament z-line). An additional loading control and the spectra corresponding to each identified peptide are presented in Figure S3D-F. I) Caspase-9 KO DRG cultures in the presence of NGF were treated with Actinomycin D or cycloheximide, harvested at the indicated time points and subjected to immunoblot analysis. J) WT DRG cultures were subjected to TD, cycloheximide, or both treatments concurrently as indicated. Puma levels were analyzed by immunoblot.
Figure 5
Figure 5. Bcl-xL and Bcl-w regulate axon survival
A) Separate cell body and axon preparations were harvested from WT DRG cultures for immunoblot analysis. B and C) DRGs from the indicated genotypes were cultured in Campenot chambers and the axonal compartment was subjected to TD for the indicated time points. Axon degeneration was visualized (B) and quantified (C). n=3 for all time points for Bcl-xLloxP/loxP. n=6 +NGF, n=5 24hr TD, and n=6 36hr TD for Bcl-xLloxP/loxP; Nestin::Cre. n=9 +NGF, n=8 24hr TD, and n=9 36hr TD for Bcl-w WT. n=9 +NGF, n=8 24hr TD, and n=9 36hr TD for Bcl-w WT. n=6 for all time points for Bcl-w KO. D) 7 DIV Embryonic DRG cultures from Bcl-xLloxP/loxP and Bcl-xLloxP/loxP; Nestin::Cre embryos were treated with the indicated concentrations of Akt inhibitor for 12hr. E) Dissociated and reaggregated DRG cultures from indicated genotypes were transduced with lentivirus expressing GFP or Cre. Axon degeneration was visualized at 3, 5, and 7 days post-infection. F and G) Puma KO or Puma KO; Bcl-w KO dissociated and reaggregated DRG cultures were subjected to lentiviral-shRNA knockdown of Bcl-xL or Scrambled control. Axon degeneration was visualized (F) and quantified (G). n=2 for all Puma KO conditions and n=4 for all Puma KO; Bcl-w KO conditions.
Figure 6
Figure 6. Puma regulates an anterograde pro-degenerative signal via the cell body
A) 7 DIV Puma WT and KO dissociated and reaggregated DRG cultures were subjected to TD for the indicated times. Separate cell body and axon preparations were subjected to immunoblot analysis. B) DRG cultures from the indicated genotypes were treated with ABT-737 for 4hr as indicated. Cell bodies were removed at the end of the treatment and axonal DEVDase activity was measured using the Caspase-Glo-3/7 assay. n=4 for all conditions except 10µM in Bcl-xL WT, 3µM in Bcl-xL KO, and 10µM in Bcl-w WT where n=3. Values are normalized to the average value of the control condition for each respective genotype. C and D) Puma WT and KO DRG cultures were treated with ABT-737 for 4hr following 2hr TD (for a total of 6hr TD) as indicated. Following treatment, either cell bodies were removed and axonal DEVDase activity was measured with the Caspase-Glo-3/7 reagent (C) or Caspase-3 activation was visualized by immunostaining (D). n=4. Values are normalized to the average value of the control condition for each respective genotype. E) Model for the role of the cell body in the initiation of axon degeneration.

Comment in

References

    1. Akhter R, Sanphui P, Das H, Saha P, Biswas SC. The regulation of p53 up-regulated modulator of apoptosis by JNK/c-Jun pathway in beta-amyloid-induced neuron death. Journal of neurochemistry. 2015;134:1091–1103. - PubMed
    1. Ambacher KK, Pitzul KB, Karajgikar M, Hamilton A, Ferguson SS, Cregan SP. The JNK- and AKT/GSK3beta-signaling pathways converge to regulate Puma induction and neuronal apoptosis induced by trophic factor deprivation. PloS one. 2012;7:e46885. - PMC - PubMed
    1. Brunet A, Bonni A, Zigmond MJ, Lin MZ, Juo P, Hu LS, Anderson MJ, Arden KC, Blenis J, Greenberg ME. Akt promotes cell survival by phosphorylating and inhibiting a Forkhead transcription factor. Cell. 1999;96:857–868. - PubMed
    1. Campbell DS, Okamoto H. Local caspase activation interacts with Slit-Robo signaling to restrict axonal arborization. The Journal of cell biology. 2013;203:657–672. - PMC - PubMed
    1. Campenot RB. Local control of neurite development by nerve growth factor. Proceedings of the National Academy of Sciences of the United States of America. 1977;74:4516–4519. - PMC - PubMed

Publication types