

Microfluidic model of the platelet-generating organ: beyond bone marrow biomimetics
- PMID: 26898346
- PMCID: PMC4761988
- DOI: 10.1038/srep21700
Microfluidic model of the platelet-generating organ: beyond bone marrow biomimetics
Abstract
We present a new, rapid method for producing blood platelets in vitro from cultured megakaryocytes based on a microfluidic device. This device consists in a wide array of VWF-coated micropillars. Such pillars act as anchors on megakaryocytes, allowing them to remain trapped in the device and subjected to hydrodynamic shear. The combined effect of anchoring and shear induces the elongation of megakaryocytes and finally their rupture into platelets and proplatelets. This process was observed with megakaryocytes from different origins and found to be robust. This original bioreactor design allows to process megakaryocytes at high throughput (millions per hour). Since platelets are produced in such a large amount, their extensive biological characterisation is possible and shows that platelets produced in this bioreactor are functional.
Conflict of interest statement
PlatOD, ESPCI INNOV, and the authors (A.B., A.L.G., A.M., S.P.-C., D.B. and M.R.) have a patent related to this work: “Fluidic device for producing platelets” (International Publication Number WO2015/075030 A1).
Figures
 wide,
wide,  deep and
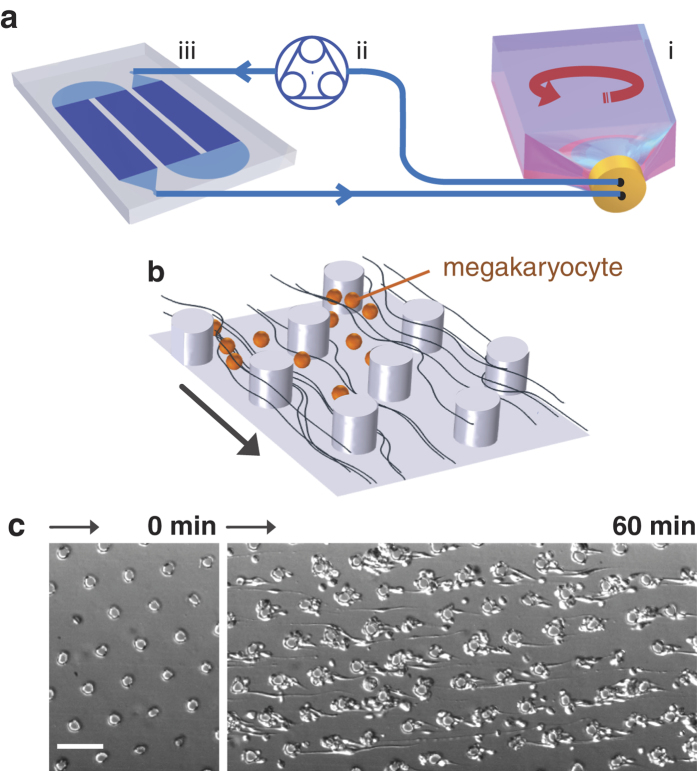
  long. The dark blue region corresponds to the pillar forests that cover the straight part of the channels, while the U-turns are devoid of obstacles. (b) Pillars are arranged on a tilted hexagonal lattice. The angle between the main axis of the channel and that of the lattice is fixed to 10° in order to ensure that each cell encounters at least one pillar. The streamlines are illustrated with black lines and MKs with orange spheres. (c) Top view of the micro pillar array before cell perfusion and after 60 minutes perfusion. The capture process of cells at intermediate times will be described in Fig. 2. Scale bar, 100
  m.
m.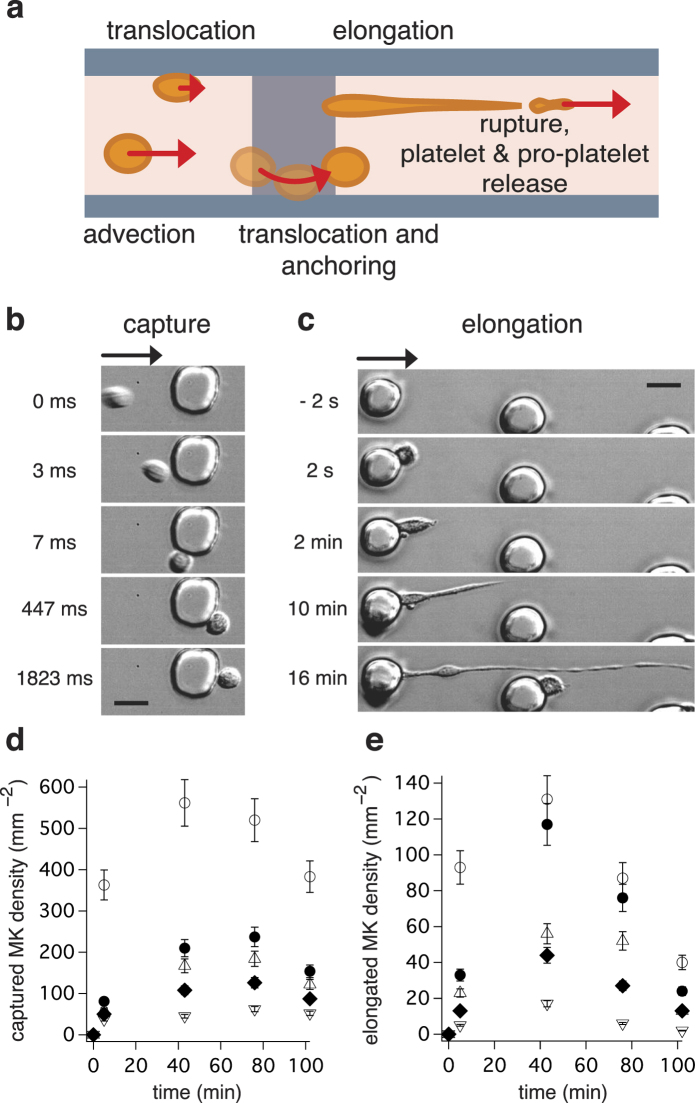
 then translocates around a pillar. In advection it takes 3 ms for the MK to move 3 times its diameter, while 1.8 s are necessary to roll over the same distance by translocation. Scale bar, 20
  m. (c) Top view of a MK elongation. The montage starts at −2 s, before the MK is captured by the left pillar. Scale bar, 20
  m. (d) Surface density of captured MKs as a function of time during a perfusion of 6,7 ml at 200 000 MK/mL suspension through 1 chip, measured at different positions:
  mm (
mm ( ),
),  mm
mm  ,
,  mm
mm  ,
,  mm
mm  ,
,  mm (
mm ( ). Counts were performed by two experimentalists and represented as (mean ± SD). (e) Surface density of elongated MKs as a function of time for the same conditions.
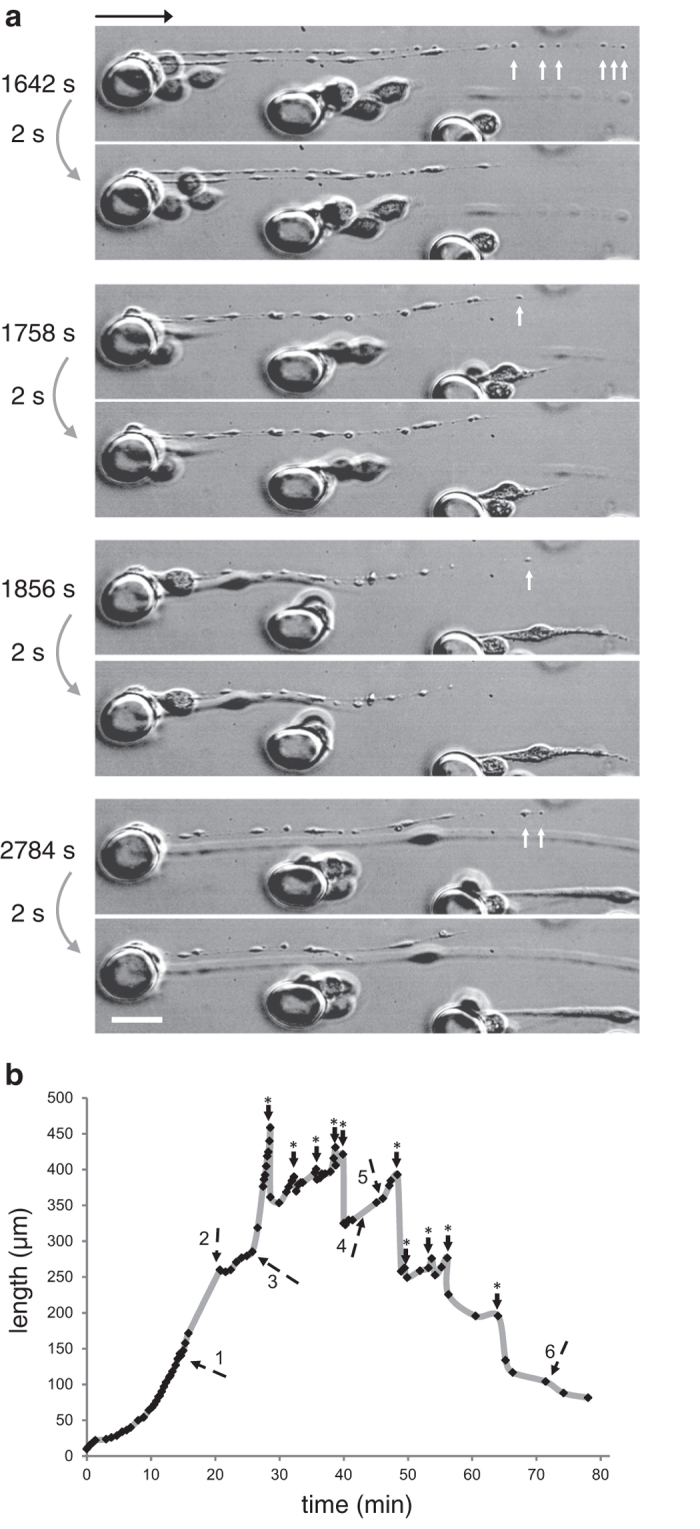
 ). The origin of time is defined as the moment when the circulating MK is captured by a pillar. The first rupture occurs at t = 27 min, when a portion of string bearing 6 beads detaches from the rest of the cell. Other similar events occur at later times, involving one (t = 29 or 31 min) or several (t = 46 min) beads. Scale bar, 20
  m. (b) Length of a megakaryocyte (n = 1). Stars (*) indicate fragmentation and numbers indicate different phases of the elongation process: (1) reorganization of proplatelets, (2) anchoring to a 2nd pillar, (3) dissociation from 1st pillar, (4) reorganization of proplatelets, (5) untangling of megakaryocyte segments (6) retraction of the residual chain. The time t = 0 min corresponds to the megakaryocyte anchorage to the first pillar. The sequence of pictures presented in panel (a) corresponds to snapshots taken between times depicted by arrows 3 and 5. The data are extracted from video 3.
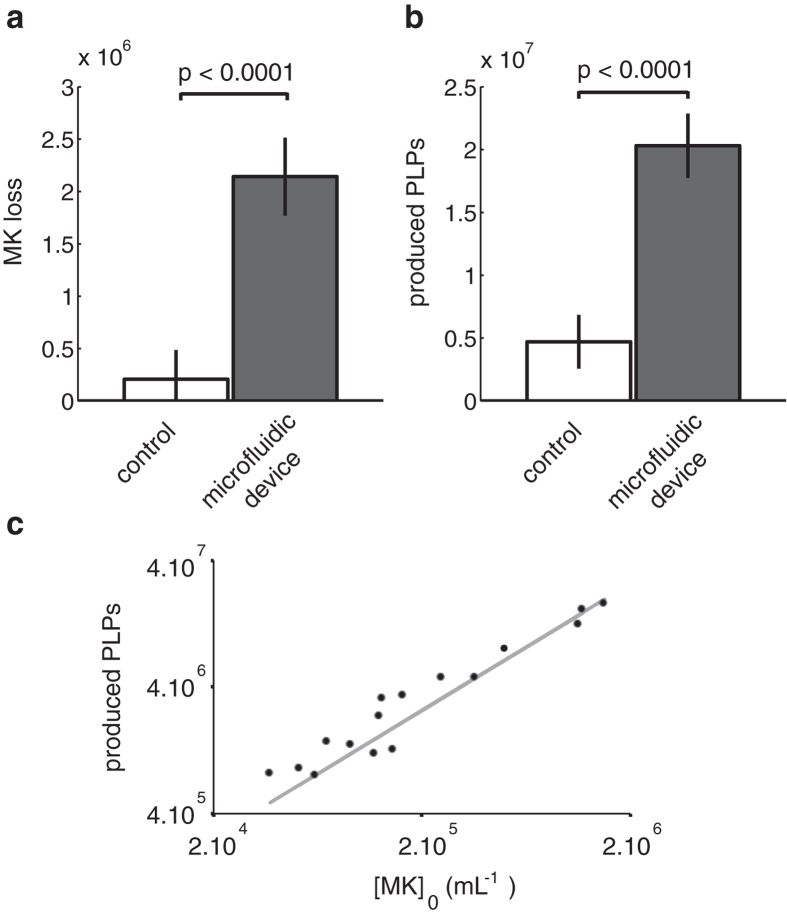
 in the reservoir during a 2 h perfusion (20 mL, 5 chips). (c) Influence of the suspension concentration
  on the number
  of released platelet-like-particles during a 2 h perfusion with a small volume of culture (6.7 mL). The curve can be fitted with a linear law (slope
  , correlation coefficient
  ).
).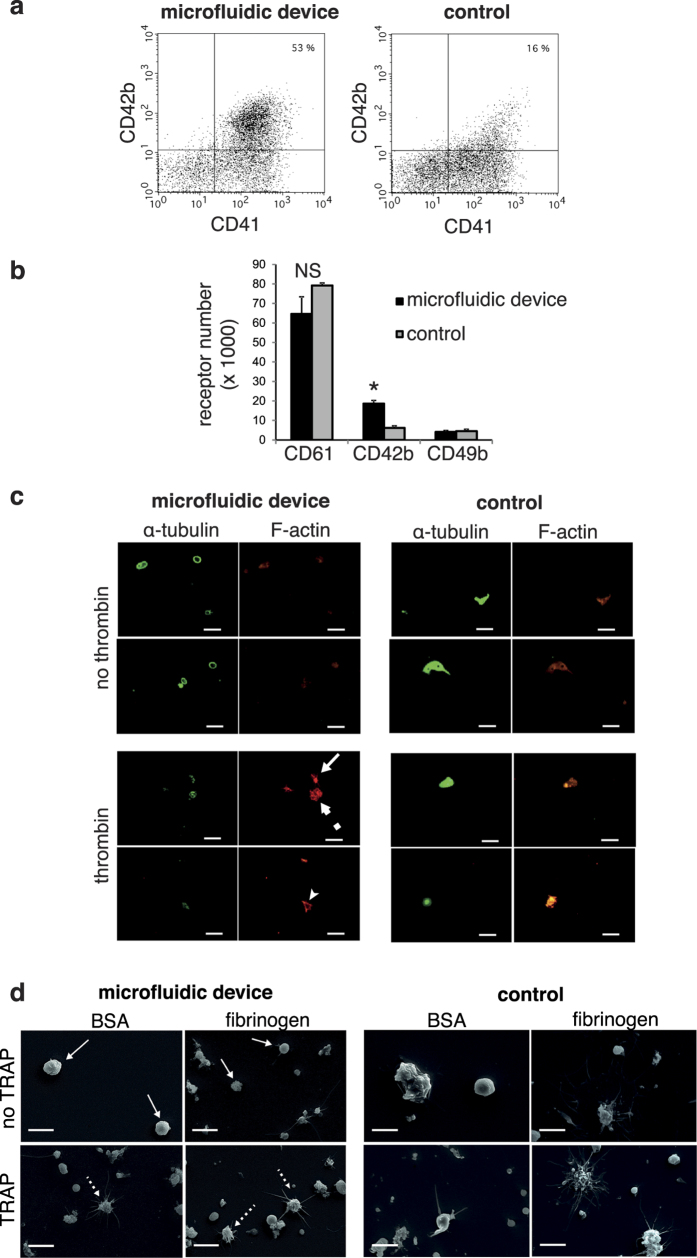
 -tubulin antibody, revealed by a secondary AlexaFluor488 goat anti-mouse antibody and AlexaFluor546 phalloidin for F-actin staining is performed in the absence (top panel) or presence (bottom panel) of thrombin. Circular tubulin staining, characteristic of unactivated platelets is seen in the samples collected at the exit of the fluidic device (top left), whereas larger fragments without circular tubulin staining are recovered in samples collected from the control (top right). Actin stress fibres (small arrow, full arrow indicate a filopod and dotted arrow a lamellipod) characteristic of activated platelets are seen in the samples collected at the exit of the fluidic device (bottom left), whereas larger elements without organised stress fibres staining are recovered in samples collected from the control (bottom right). Platelets are adherent to fibrinogen. Scale bar 5
  m. (d) Electron microscopy observations of platelets on BSA or fibrinogen coated surface, upon TRAP activation. Discoid round platelets are indicated with full white arrows and pseudopods with dotted arrows. Scale bar 5
  m.
m.
 m.
m.Similar articles
-
A comparison of haematopoietic stem cells from umbilical cord blood and peripheral blood for platelet production in a microfluidic device.Vox Sang. 2019 May;114(4):330-339. doi: 10.1111/vox.12776. Epub 2019 Mar 21. Vox Sang. 2019. PMID: 30900265 Free PMC article.
-
Platelet bioreactor: accelerated evolution of design and manufacture.Platelets. 2017 Jul;28(5):472-477. doi: 10.1080/09537104.2016.1265922. Epub 2017 Jan 23. Platelets. 2017. PMID: 28112988 Free PMC article. Review.
-
Platelet bioreactor-on-a-chip.Blood. 2014 Sep 18;124(12):1857-67. doi: 10.1182/blood-2014-05-574913. Blood. 2014. PMID: 25606631 Free PMC article.
-
Unraveling mechanisms that control platelet production.Semin Thromb Hemost. 2013 Feb;39(1):15-24. doi: 10.1055/s-0032-1331157. Epub 2012 Dec 24. Semin Thromb Hemost. 2013. PMID: 23266965 Review.
-
Manipulation of oxygenation and flow-induced shear stress can increase the in vitro yield of platelets from cord blood.Tissue Eng Part C Methods. 2011 Nov;17(11):1081-8. doi: 10.1089/ten.tec.2011.0108. Epub 2011 Aug 30. Tissue Eng Part C Methods. 2011. PMID: 21877917
Cited by
-
The Opportunities and Challenges regarding Induced Platelets from Human Pluripotent Stem Cells.Stem Cells Int. 2021 May 1;2021:5588165. doi: 10.1155/2021/5588165. eCollection 2021. Stem Cells Int. 2021. PMID: 34054969 Free PMC article. Review.
-
Induction of differentiation of human stem cells ex vivo: Toward large-scale platelet production.World J Stem Cells. 2019 Sep 26;11(9):666-676. doi: 10.4252/wjsc.v11.i9.666. World J Stem Cells. 2019. PMID: 31616542 Free PMC article. Review.
-
Inside-to-outside and back to the future of megakaryopoiesis.Res Pract Thromb Haemost. 2023 May 30;7(4):100197. doi: 10.1016/j.rpth.2023.100197. eCollection 2023 May. Res Pract Thromb Haemost. 2023. PMID: 37416054 Free PMC article.
-
Developing a Multichannel Bioreactor with a Collagen Scaffold, ECM, and Cryoprecipitate to Significantly Produce Platelets from Umbilical Cord Blood Stem Cells.Int J Hematol Oncol Stem Cell Res. 2023 Oct 1;17(4):245-256. doi: 10.18502/ijhoscr.v17i4.13916. Int J Hematol Oncol Stem Cell Res. 2023. PMID: 38076776 Free PMC article.
-
Microfluidic Systems for Neural Cell Studies.Bioengineering (Basel). 2023 Jul 30;10(8):902. doi: 10.3390/bioengineering10080902. Bioengineering (Basel). 2023. PMID: 37627787 Free PMC article. Review.
References
Publication types
MeSH terms
Substances
LinkOut - more resources
Full Text Sources
Other Literature Sources
Miscellaneous
