Parallel expression profiling of hepatic and serum microRNA-122 associated with clinical features and treatment responses in chronic hepatitis C patients
- PMID: 26898400
- PMCID: PMC4761907
- DOI: 10.1038/srep21510
Parallel expression profiling of hepatic and serum microRNA-122 associated with clinical features and treatment responses in chronic hepatitis C patients
Abstract
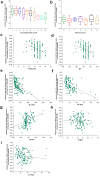
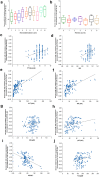
MicroRNAs (miRNAs) are small, non-coding RNAs that regulate a variety of biological processes. Recently, human liver-specific miRNA miR-122 has been reported to facilitate hepatitis C virus (HCV) replication in liver cells. HCV is one of the leading causes of liver diseases worldwide. In Pakistan, the estimated prevalence is up to 10%. Here, we report hepatic and serum miR-122 expression profiling from paired liver and serum samples from treatment-naive chronic hepatitis C (CHC) patients and controls. We aimed to elucidate the biomarker potential of serum miR-122 for monitoring disease progression and predicting end treatment response (ETR). Hepatic miR-122 levels were significantly down-regulated in CHC patients. A significant inverse correlation was observed between hepatic and serum miR-122 levels, indicating that serum miR-122 levels reflect HCV-associated disease progression. Both hepatic and serum miR-122 were significantly correlated (P < 0.05) with several clinicopathological features of CHC. Receiver operator curve analysis showed that serum miR-122 had superior discriminatory ability even in patients with normal alanine transaminase levels. Multivariate logistic regression analysis highlighted pre-treatment serum miR-122 levels as independent predictors of ETR. In conclusion, serum miR-122 holds the potential to serve as a promising biomarker of disease progression and ETR in CHC patients.
Figures


Similar articles
-
Circulating microRNA-196a as a candidate diagnostic biomarker for chronic hepatitis C.Mol Med Rep. 2015 Jul;12(1):105-10. doi: 10.3892/mmr.2015.3386. Epub 2015 Feb 24. Mol Med Rep. 2015. PMID: 25738504 Free PMC article.
-
Circulating microRNAs as predictive biomarkers for liver disease progression of chronic hepatitis C (genotype-4) Egyptian patients.J Med Virol. 2019 Jan;91(1):93-101. doi: 10.1002/jmv.25294. Epub 2018 Sep 24. J Med Virol. 2019. PMID: 30133717
-
Dysregulated Serum MicroRNA Expression Profile and Potential Biomarkers in Hepatitis C Virus-infected Patients.Int J Med Sci. 2015 Jul 16;12(7):590-8. doi: 10.7150/ijms.11525. eCollection 2015. Int J Med Sci. 2015. PMID: 26283876 Free PMC article.
-
The Role of MicroRNA in Pathogenesis and as Markers of HCV Chronic Infection.Curr Drug Targets. 2017;18(7):756-765. doi: 10.2174/1389450117666160401125213. Curr Drug Targets. 2017. PMID: 27033188 Review.
-
MicroRNA-155 and microRNA-196b: promising biomarkers in hepatitis C virus infection?Rev Med Virol. 2014 May;24(3):169-85. doi: 10.1002/rmv.1785. Epub 2014 Mar 4. Rev Med Virol. 2014. PMID: 24591085 Review.
Cited by
-
New Insights into Mitochondrial-Nuclear Interactions Revealed through Analysis of Small RNAs.Genome Biol Evol. 2022 Feb 4;14(2):evac023. doi: 10.1093/gbe/evac023. Genome Biol Evol. 2022. PMID: 35143645 Free PMC article.
-
Evaluation of MicroRNA-122 as a Biomarker for Chronic Hepatitis C Infection and as a Predictor for Treatment Response to Direct-Acting Antivirals.Hepat Med. 2021 Mar 15;13:9-23. doi: 10.2147/HMER.S292251. eCollection 2021. Hepat Med. 2021. PMID: 33758557 Free PMC article.
-
Diagnostic value of circulating miRNA-122 for hepatitis B virus and/or hepatitis C virus-associated chronic viral hepatitis.Biosci Rep. 2019 Sep 6;39(9):BSR20190900. doi: 10.1042/BSR20190900. Print 2019 Sep 30. Biosci Rep. 2019. PMID: 31427483 Free PMC article.
-
Circulating microRNA-122 in HCV cirrhotic patients with high frequency of genotype 3.PLoS One. 2022 May 26;17(5):e0268526. doi: 10.1371/journal.pone.0268526. eCollection 2022. PLoS One. 2022. PMID: 35617369 Free PMC article.
-
Single-excited double-emission CdTe@CdS quantum dots for use in a fluorometric hybridization assay for multiple tumor-related microRNAs.Mikrochim Acta. 2020 Jan 16;187(2):134. doi: 10.1007/s00604-020-4117-y. Mikrochim Acta. 2020. PMID: 31950277
References
Publication types
MeSH terms
Substances
LinkOut - more resources
Full Text Sources
Other Literature Sources
Molecular Biology Databases

