. 2016 Mar 2;89(5):956-70.
doi: 10.1016/j.neuron.2016.01.034. Epub 2016 Feb 18.

A Systems-Level Analysis of the Peripheral Nerve Intrinsic Axonal Growth Program

Affiliations

A Systems-Level Analysis of the Peripheral Nerve Intrinsic Axonal Growth Program

Vijayendran Chandran et al. Neuron. .

Abstract

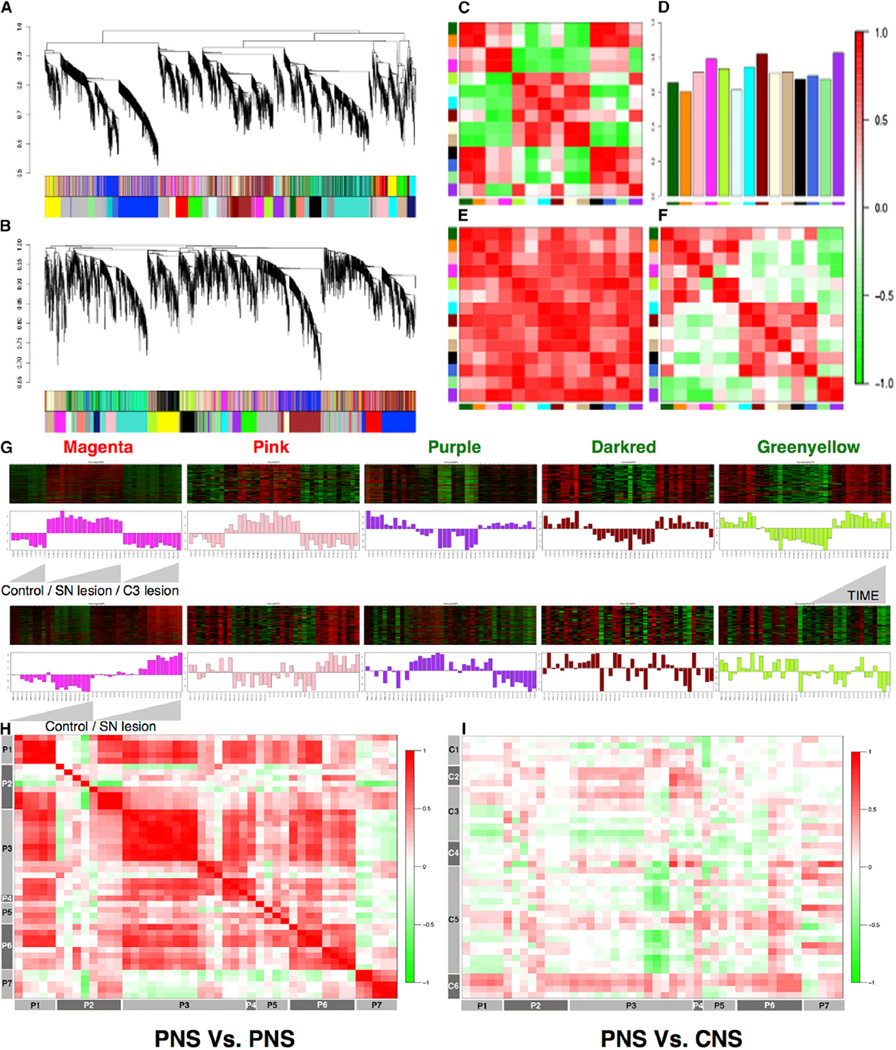
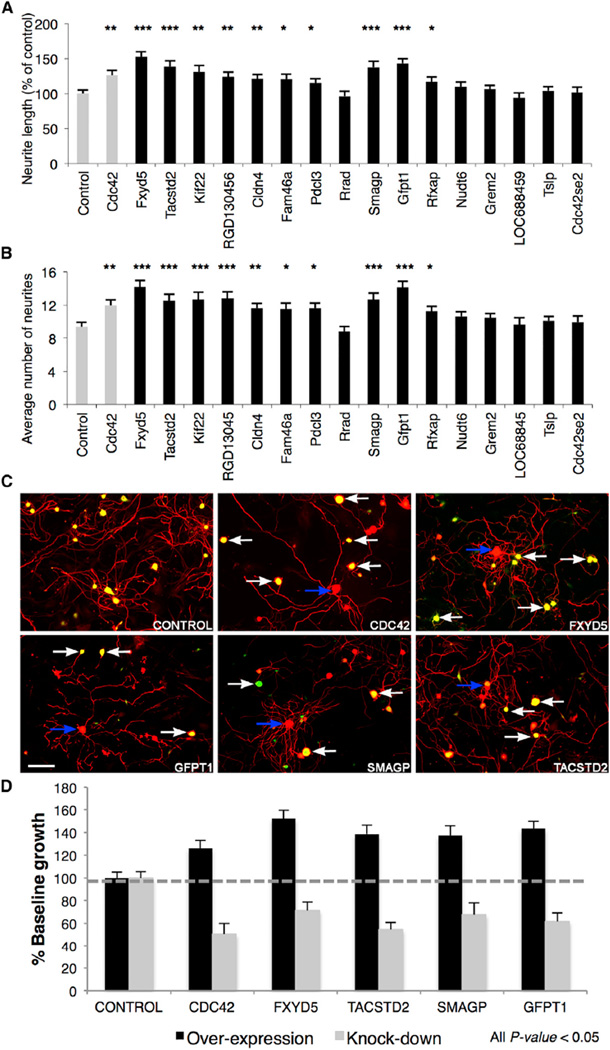
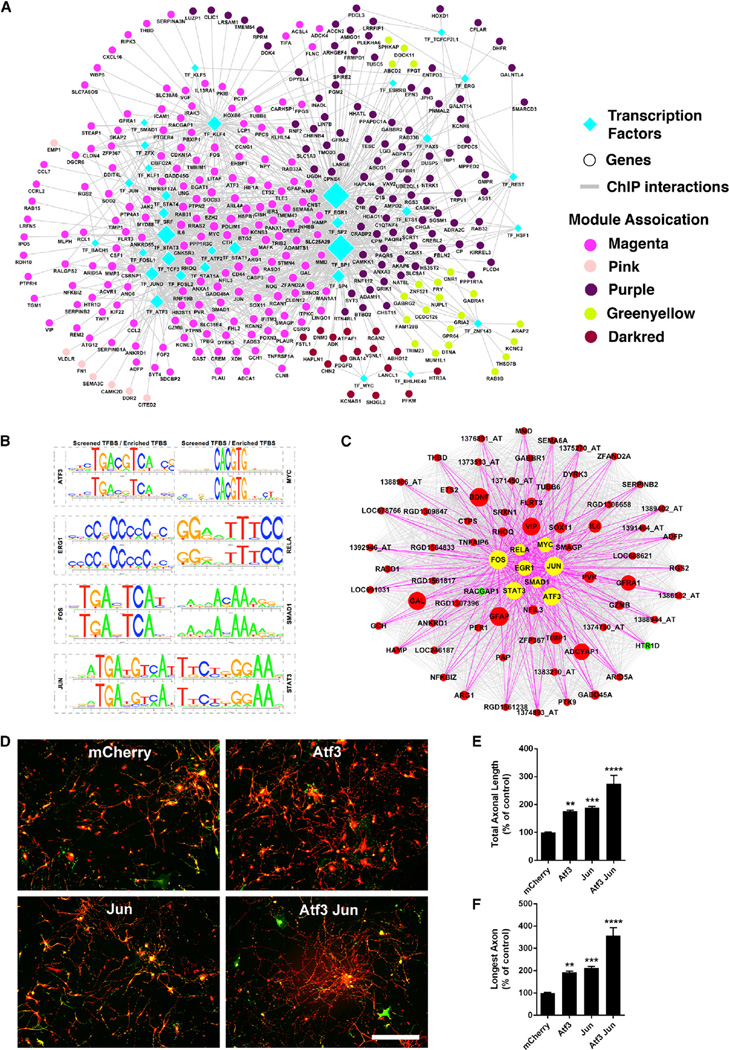
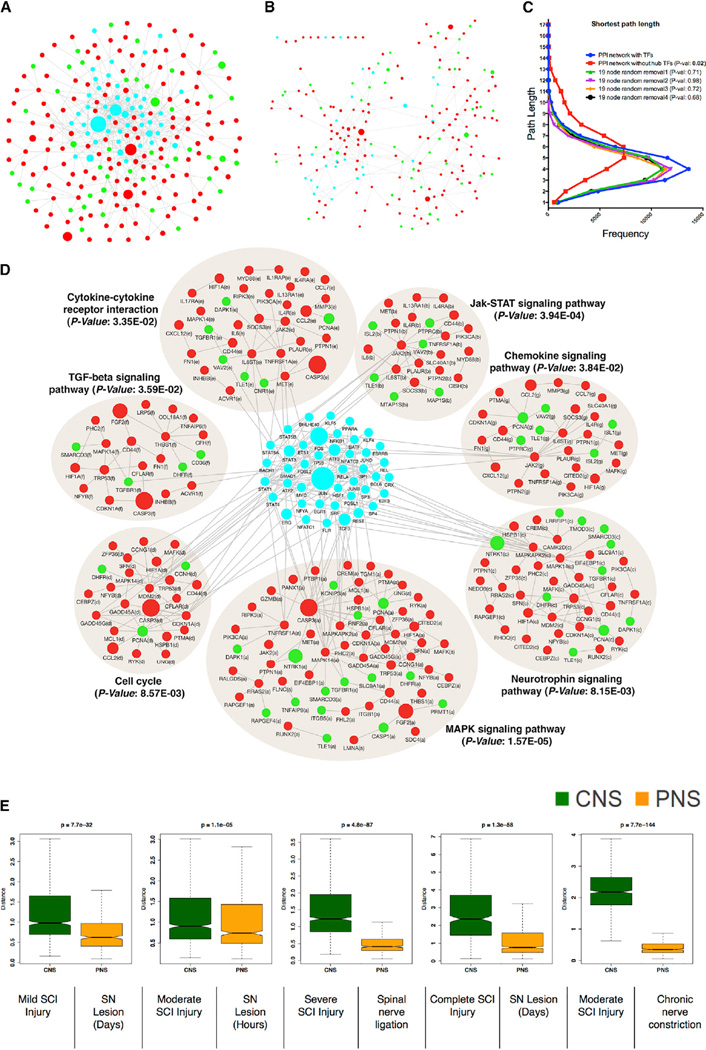
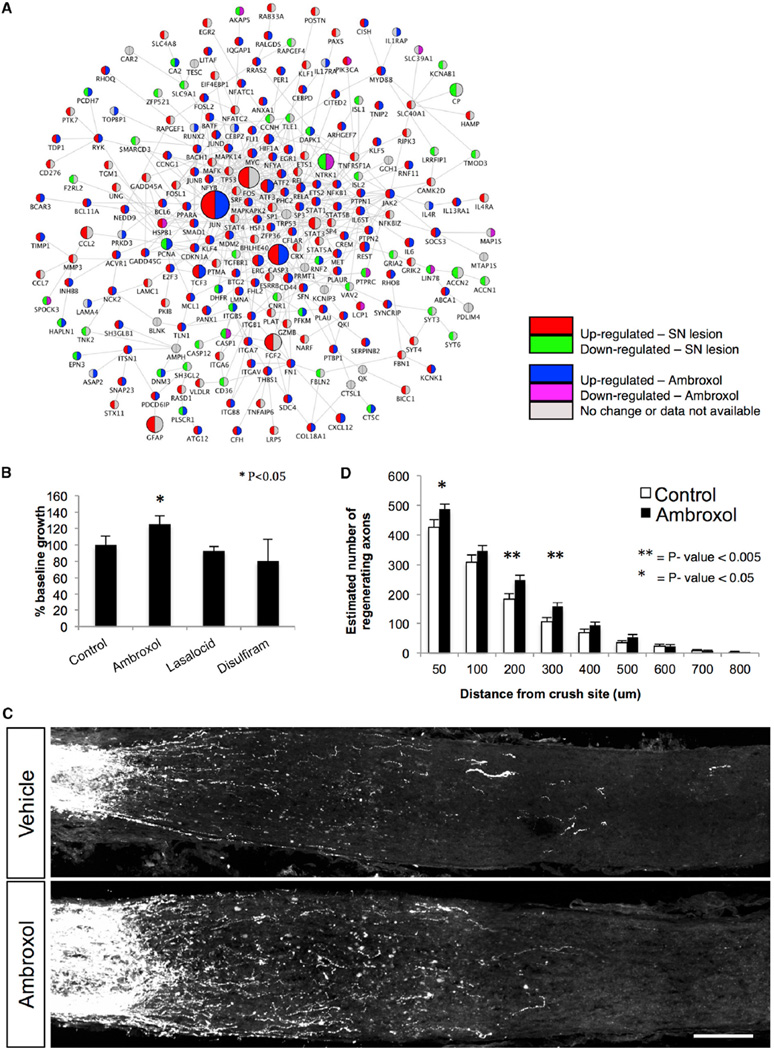
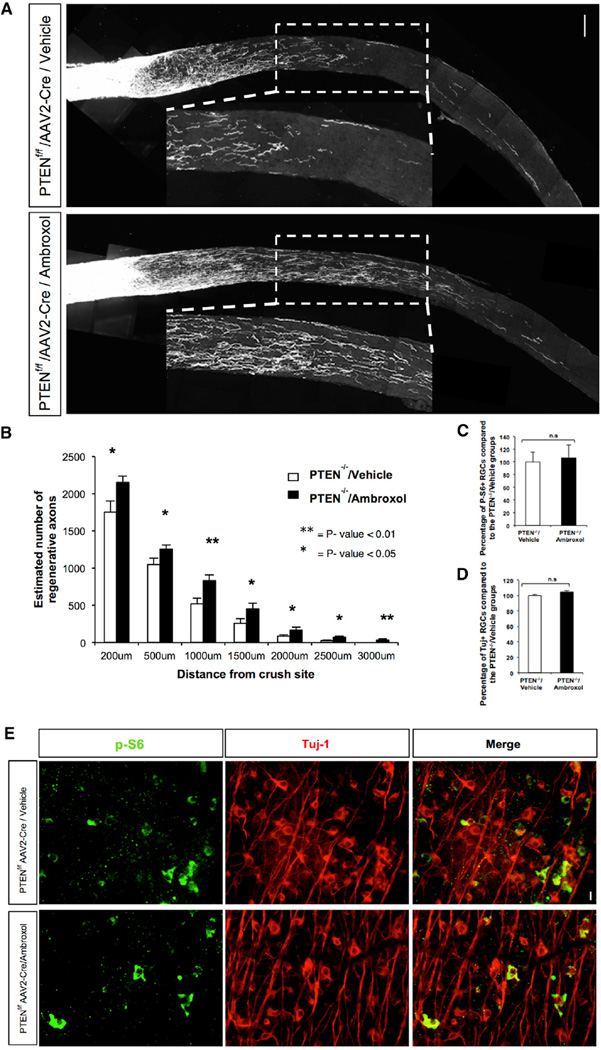
The regenerative capacity of the injured CNS in adult mammals is severely limited, yet axons in the peripheral nervous system (PNS) regrow, albeit to a limited extent, after injury. We reasoned that coordinate regulation of gene expression in injured neurons involving multiple pathways was central to PNS regenerative capacity. To provide a framework for revealing pathways involved in PNS axon regrowth after injury, we applied a comprehensive systems biology approach, starting with gene expression profiling of dorsal root ganglia (DRGs) combined with multi-level bioinformatic analyses and experimental validation of network predictions. We used this rubric to identify a drug that accelerates DRG neurite outgrowth in vitro and optic nerve outgrowth in vivo by inducing elements of the identified network. The work provides a functional genomics foundation for understanding neural repair and proof of the power of such approaches in tackling complex problems in nervous system biology.


Figures

Figure 1
Figure 1. Network Analysis of Sensory Neuron Profile Changes after SN Lesions
(A and B) Gene dendrograms for two SN lesion datasets are shown. (C–F) Consensus module preservation across datasets. (C and F) Eigengene (first principal component of gene expression) adjacencies of two datasets are shown; rows and columns correspond to one eigengene consensus module (red, positive correlation; green, negative correlation). (D) Preservation measure for each consensus eigengene is shown. (E) Overall module preservation among SN lesion datasets is shown; rows and columns correspond to a consensus module; red saturation denotes module preservation. (G) Heatmaps depicting expression of genes (rows) across samples (columns) for five modules (red corresponds to gene upregulation and green to down-regulation). First principal component of gene expression is shown as a bar-plot. (Top) SN and C3 lesion datasets 1, 3,7,14, and 49 days after injury (left to right, ascending order) are shown. (Bottom) Same genes in another SN lesion dataset 1, 3, 8, 12, 16, 18, 24, and 28 hr post-injury are shown. (H and I) Plots comparing direction of correlation of top 50 hub genes in magenta module in 16 (eight PNS and eight CNS) neuronal injury datasets (H) PNS versus PNS and (I) CNS versus PNS; correlation scores encoded −1 (green, anti-correlated) to +1 (red, correlated).
Figure 2
Figure 2. Experimental Validation of Novel Candidate RAGs
(A and B) Differences in neurite outgrowth produced by overexpression of 16 cDNA clones in lentiviral expression vectors with an IRES eGFP expression tag in cultured adult C57BL/6 DRG neurons with Cdc42 as positive control. (A) Total neurite length and (B) number of neurites per neuron were quantified using ImageJ software (NeuronJ plugin), from 50 to 150 cells per view. Significant differences were determined by ANOVA with Bonferroni-Holm post hoc test; 10/16 candidates induce greater neurite growth. (C) Knockdown of the top four selected genes using lentiviral delivery of shRNA with eGFP reporter in C57BL/6 DRGs. Transfected (white arrow) and non-transfected (blue arrow) individual DRG neurons are highlighted. Scale bar, 100 µm. (D) Average total neurite length relative to control. All data shown is significant relative to control (p < 0.05, mean ± SEM).
Figure 3
Figure 3. TF-Binding Site Enrichment in Injured Regenerating Neurons
(A) Regulatory network of differentially expressed genes after nerve injury. Nodes correspond to genes or TFs and edges to ChIP interaction. Node color represents their corresponding module associations as denoted in the legends and over-represented TFs (diamond) are shown in cyan. Node size is based on its centrality. (B) Sequence logo plots of reference (JASPAR/TRANSFAC) and identified position weight matrix for each TF significantly over-represented in magenta module are shown. (C) Magenta module, showing eight over-represented TFs as hub genes. Nodes correspond to genes and edges to significant correlation. Larger nodes correspond to number of PubMed hits with co-occurrence of gene and neuronal regeneration, axonal regeneration, and nerve injury tags; upregulated (red), downregulated (green), and over-represented TFs (yellow) are shown. Only edges connected by over-represented TFs are highlighted. (D–F) Combined TF overexpression. (D) Photomicrographs of dissociated DRG neurons transduced with the indicated viruses at 1 DIV, replated at 7 DIV, and cultured for an additional 20 hr on laminin. Red, bIII-tubulin; green, EGFP. (E and F) Quantification of total axonal length (E) and longest axon (F) reveal significant enhancement of axonal growth for ATF3 and JUN expression individually, compared to control (mCherry). Combined ATF3 and JUN overexpression enhances axonal growth significantly more than ATF3 or JUN individually. Data are mean ± SE. n = 30 wells. **p < 0.01, ***p < 0.001, ****p < 0.0001, one-way ANOVA with Bonferroni’s post hoc test. Scale bar, 200 microns.
Figure 4
Figure 4. Over-Represented TFs Are Involved in Transcriptional Cross-Talk between Regeneration-Associated Pathways
(A) Protein-protein interaction (PPI) network of differentially expressed genes after nerve injury. Nodes correspond to genes and edges to PPI. Larger nodes correspond to number of PubMed hits with co-occurrence of gene and neuronal regeneration, axonal regeneration, and nerve injury tags. Node color represents upregulated (red), downregulated (green), and over-represented (cyan) TFs. (B) PPI network dissociation after in silico removal of 19 hub TFs is shown. (C) Distribution of the shortest path between pairs of nodes in the PPI network with or without in silico removal of 19 hub TFs. Random removal of a similar number of nodes is shown for comparison. (D) Significantly enriched KEGG pathways (Benjamini-corrected p values < 0.05) in the PPI network. (E) Boxplot representation of the variability in the expression levels of the over-represented TFs between CNS and PNS injuries (see Figures S1C and S1D). Time series data after CNS or PNS injury (see Figure S2) were used to create distance matrix using Euclidean distance measure to create the boxplot. Non-parametric Kruskal-Wallis test was used to compare differences between CNS and PNS injury datasets.
Figure 5
Figure 5. Targeting Candidate RAG Regulatory Network Using Small Molecules
Gene expression signatures after PNS injury were used to query drug-related expression profiles in the Connectivity Map. Using a pattern-matching algorithm, we selected three drugs (ambroxol, disulfiram, and lasalocid) based on enrichment and specificity scores. (A) PPI (edges) network of co-expressed and differentially expressed genes (nodes) after PNS injury is shown. Upregulation (red) and downregulation (green) after SN lesion; upregulation (blue) and downregulation (purple) after ambroxol treatment (from Connectivity Map). (B) Differences in DRG neurite outgrowth after treatment with drugs. Ambroxol elicited more neuronal growth than control (p < 0.05, t test). (C and D) Ambroxol promotes retinal ganglion cell axonal regeneration. Ambroxol (Amb 25 mg/ml) or vehicle (Veh) was injected into the eye just before ON crush. Animals received daily 120 ml ambroxol (25 mg/ml) or vehicle by intraperitoneal (i.p.) injection from day 1 to day 14. At day 7 ambroxol (25 mg/ml) or vehicle was injected into the eye. Tracer CTB was injected into the eye on day 11 and animals were sacrificed on day 14. (C) Representative confocal images show ON sections from WT animals treated with vehicle (n = 10) and WT animals treated with ambroxol (25 mg/ml, n = 13). Axons are labeled with CTB. Scale bar, 100 mm. Measurements were made blinded to treatment. (D) Quantification of number of axons in (C) is shown (t test, **p < 0.001 and *p < 0.05).
Figure 6
Figure 6. Ambroxol Promotes Retinal Ganglion Cell Axonal Regeneration in PTEN Knockout Mice
Ambroxol (Amb 25 mg/ml) or vehicle was injected into the eye just before ON crush. Animals received daily 300 mg/kg ambroxol or vehicle by i.p. injection for the first 5 days after the crush and then they received 150 mg/kg until day 14. At day 7 ambroxol (25 mg/ml) or vehicle was injected into the eye. Tracer CTB was injected into the eye on day 11 and animals were sacrificed on day 14. (A) Representative confocal images of ON sections from PTEN−/− animals treated with vehicle (n = 4) and PTEN−/− animals treated with ambroxol (n = 4). Axons are labeled with CTB. Scale bar, 100 µm. Measurements were made blinded to treatment. (B) Quantification of number of axons in (A) is shown (t test, **p < 0.01 and *p < 0.05). (C and D) Quantifications of retinal ganglion cell (RGC) survival measured by Tuj1 and P-S6 antibody staining are shown. (E) Representative retina whole-mount images with Tuj1 and P-S6 antibody staining 2 weeks post injury are shown. Scale bar, 25 µm.

Comment in

References

    1. Abe N, Cavalli V. Nerve injury signaling. Curr. Opin. Neurobiol. 2008;18:276–283. - PMC - PubMed
    1. Afshari FT, Kappagantula S, Fawcett JW. Extrinsic and intrinsic factors controlling axonal regeneration after spinal cord injury. Expert Rev. Mol. Med. 2009;11:e37. - PubMed
    1. Bareyre FM, Garzorz N, Lang C, Misgeld T, Büning H, Kerschensteiner M. In vivo imaging reveals a phase-specific role of STAT3 during central and peripheral nervous system axon regeneration. Proc. Natl. Acad. Sci. USA. 2011;108:6282–6287. - PMC - PubMed
    1. Beggs S, Salter MW. Neuropathic pain: symptoms, models, and mechanisms. Drug Dev. Res. 2006;67:289–301.
    1. Bomze HM, Bulsara KR, Iskandar BJ, Caroni P, Skene JH. Spinal axon regeneration evoked by replacing two growth cone proteins in adult neurons. Nat. Neurosci. 2001;4:38–43. - PubMed

Publication types

MeSH terms