. 2016 Apr:68:62-74.
doi: 10.1016/j.jaut.2016.01.002. Epub 2016 Feb 18.

Refined mapping of autoimmune disease associated genetic variants with gene expression suggests an important role for non-coding RNAs

Collaborators, Affiliations

Refined mapping of autoimmune disease associated genetic variants with gene expression suggests an important role for non-coding RNAs

Isis Ricaño-Ponce et al. J Autoimmun. 2016 Apr.

Abstract

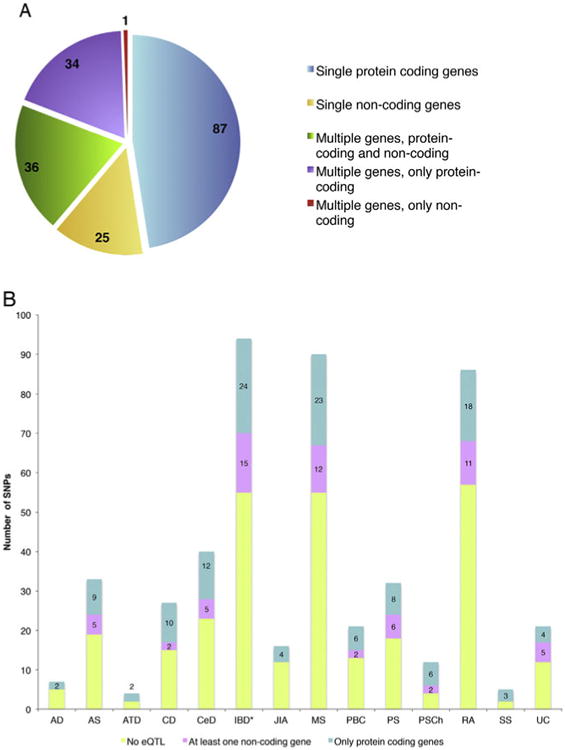
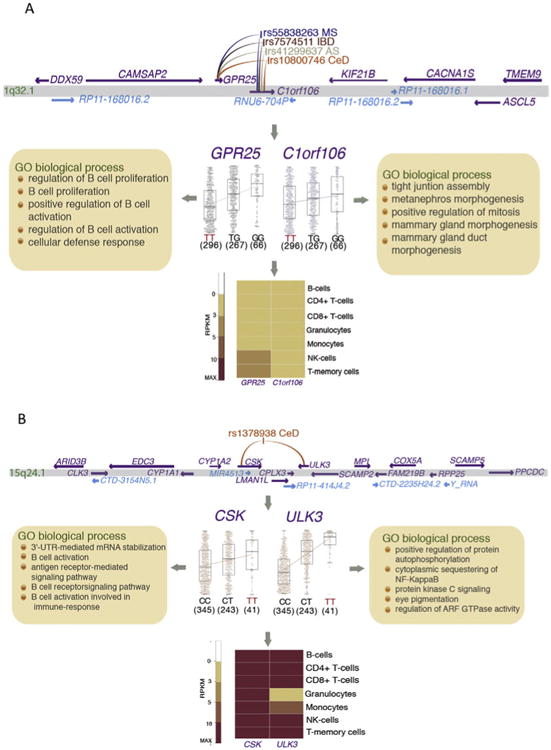
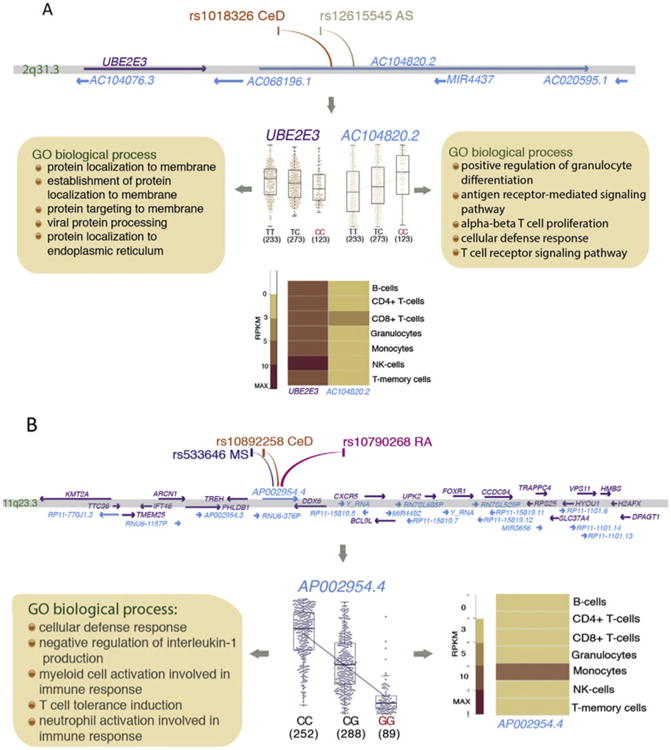
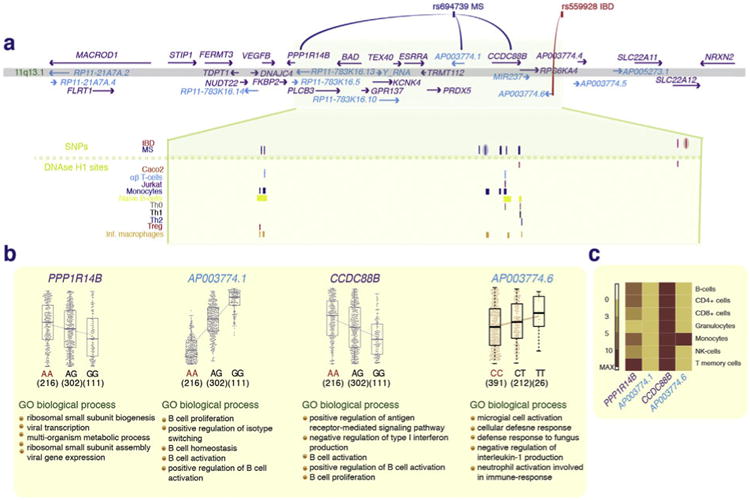
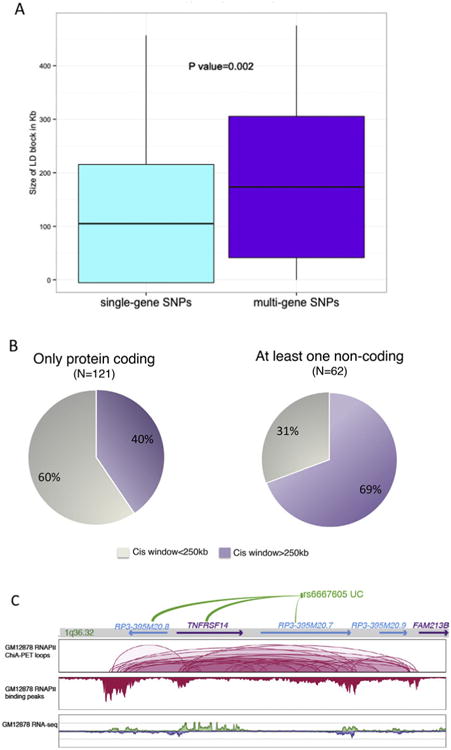
Genome-wide association and fine-mapping studies in 14 autoimmune diseases (AID) have implicated more than 250 loci in one or more of these diseases. As more than 90% of AID-associated SNPs are intergenic or intronic, pinpointing the causal genes is challenging. We performed a systematic analysis to link 460 SNPs that are associated with 14 AID to causal genes using transcriptomic data from 629 blood samples. We were able to link 71 (39%) of the AID-SNPs to two or more nearby genes, providing evidence that for part of the AID loci multiple causal genes exist. While 54 of the AID loci are shared by one or more AID, 17% of them do not share candidate causal genes. In addition to finding novel genes such as ULK3, we also implicate novel disease mechanisms and pathways like autophagy in celiac disease pathogenesis. Furthermore, 42 of the AID SNPs specifically affected the expression of 53 non-coding RNA genes. To further understand how the non-coding genome contributes to AID, the SNPs were linked to functional regulatory elements, which suggest a model where AID genes are regulated by network of chromatin looping/non-coding RNAs interactions. The looping model also explains how a causal candidate gene is not necessarily the gene closest to the AID SNP, which was the case in nearly 50% of cases.

Keywords: Causal genes; Genome-wide association; Long non-coding RNAs; RNA-sequencing; eQTLs.


Figures

Fig. 1
Fig. 1
Break down of cis-eQTLs into coding and non-coding genes. (A) The pie-chart summarizes the cis-eQTLs we identified in which, 112 out of 183 cis-eQTL AID-SNPs were associated to single genes (i.e. 87 AID-SNPs to 68 protein-coding genes and 25 AID-SNPs to 22 ncRNAs), while the other 71 AID cis-eQTL SNPs affected the expression levels of two to seven different genes within the 500 kb region (see Supplemental Table 2). (B) The cis-eQTL mapping results per disease are shown to indicate the number of SNPs remaining for eQTL mapping (shown on top of the purple bars) as well as the number of SNPs that showed significant cis-eQTLs (shown on top of the orange bars). Because of the wide range in the number of SNPs associated to each of the AIDs, we defined false discovery rate (FDR) significance thresholds for each disease separately to assist in the eQTL analysis (see Methods). *These loci are shared between ulcerative colitis (UC) and Crohn's disease (CD). The non-shared loci are listed separately. Alopecia areata (AA), atopic dermatitis (AD), ankylosing spondylitis (AS), autoimmune thyroid disease (ATD), coeliac disease (CeD), inflammatory bowel disease (IBD), juvenile idiopathic arthritis (JIA), multiple sclerosis (MS), primary biliary cirrhosis (PBC), psoriasis (PS), rheumatoid arthritis (RA), primary sclerosing cholangitis (PSCh), and systemic sclerosis (SS).
Fig. 2
Fig. 2
Cis-eQTL identifies novel candidate causal genes for AID. The top panel is a locus plot to show the location of all the genes tested in a 500 kb cis-window (hg19). The plot centred below indicates the correlation between the expression of eQTL-genes with genotypes of AID-SNPs. The risk genotypes are in red. The expression pattern for eQTL-genes across seven different immune cell types were obtained from two individuals and the average expression levels are shown as a heatmap in the lowest panel. (A) An example of different AID-SNPs affecting the same genes and thus representing a truly shared locus. Four different SNPs at 1q32.1 show association to four different diseases (MS, IBD, AS and CeD). All four SNPs are in absolute LD (r2 = 1, D = 1) and affect two protein-coding genes. The MS-associated risk allele rs55838263*T is associated with lower expression of both GPR25 (P = 3.02 × 10⁻¹⁶) and C1ORF106 (P = 0.0012) genes. The risk alleles for the other three SNPs show similar results. (B) Example of a cis-eQTL identifying novel candidate genes and novel pathways. The CeD-associated risk allele, rs1378938*T is associated with a higher expression of both CSK (P = 7.08 × 10⁻⁶) and ULK3 (P = 1.21 × 10−46). ULK3 encodes a kinase involved in autophagy. This pathway has not been implicated in CeD so far. We found an enrichment of autophagy genes being differentially expressed compared to a random set of genes in CeD biopsies (P = 2.2 × 10⁻¹⁶). We further showed that the SNP affecting ULK3 is also correlated with the expression levels of autophagy genes in CeD biopsies (Supplemental Fig. 3).
Fig. 3
Fig. 3
Validation of the functional role of ULK3 locus in autophagy in celiac disease. (A) Genotype-dependent expression levels of autophagy genes in coeliac disease biopsies. There were 3 AA, 15 AG and 13 GG genotypes. The expression for 217 autophagy genes could be extracted from the microarray data of coeliac disease biopsies and the genotype data at the ULK3 SNP were extracted using Immunochip for 31 CeD patients. The heatmap shows the normalized expression values stratified according to the genotypes. The difference in gene expression between AA and GG was tested by t-test and P < 0.05 was considered significant. (B) Association of rs1378938 with interleukin 6 levels in response to lipopolysaccharide. The CeD-associated risk allele rs1378938*T (in red) results in lowered interleukin 6 (P = 0.019) cytokine levels upon LPS stimulation of primary mononuclear cells. The x-axis displays the three different genotypes and the number of individuals in each group. The y-axis presents the age and gender corrected cytokine levels.
Fig. 4
Fig. 4
Examples of long non-coding RNAs as candidate causal genes for AIDs. (A) The locus on chromosome 2q32.3 is associated to AD (rs12615545) and CeD (rs1018326), and both SNPs are in strong LD (r2 = 0.96, D′ = 1). The CeD-associated risk allele, rs1018326*C is associated with higher levels of expression of the AC104820.2 lncRNA (similar results were observed for AD risk allele at rs12615545). The function prediction based on co-expression (GO biological processes) suggested this lncRNA is involved in alpha-beta T-cell proliferation. The right-hand panel shows the expression pattern for AC1048202 lncRNA across seven different immune cell types (obtained from two individuals and the average expression levels are shown), which indicates its strong expression in CD8+ T-cells. (B) The locus on chromosome 11q23.3 is associated to CeD (rs10892258), MS (rs533646) and RA (rs10790268). The MS-associated risk allele rs533646*G is associated with lower levels of expression of the AP002954.4 lncRNA (eQTL P = 6.41 × 10−80; similar results were also observed for the CeD and RA risk alleles). The expression patterns across seven cell types were obtained from two individuals and the average expression levels are shown as a heatmap, which confirms the strong expression of AP002954.4 in monocytes. The function prediction based on co-expression (GO biological processes) was obtained from the RNA network (http://genenetwork.nl/)7.
Fig. 5
Fig. 5
Shared disease loci may harbour different candidate causal genes for different AIDs. (A) The upper panel shows the regional plot of MS- (rs694739) and IBD- (rs559928) associated SNPs at 11q13.1 that affect expression of independent genes. The DNAse H1 sites (DHSs) from different cell lines were intersected with both gSNPs and their proxies. The gSNPs are highlighted with an oval shape around the line. DHSs of immune cells (alpha-beta T-cells, Jurkat T-cells, monocytes, naive B cells, T helper cells (Th0, Th1, Th2) and regulatory T-cells (Treg) and Caco-2 cells (intestinal epithelial cells) were extracted from the databases of ENCODE and the Blueprint epigenome project (B) The MS SNP rs694739 affects the expression levels of lncRNA AP003774.1 (P = 2.65 × 10−130), followed by CCDC88B (P = 7.89 × 10⁻¹⁴) and PPP1R14B (P = 7.08 × 10⁻⁶), while IBD SNP rs559928 only weakly affects the expression level of lncRNA AP003774.6 (P = 3.21 × 10⁻⁴). The function prediction based on co-expression (GO biological processes) was obtained from the RNA network [30]. Consistent with the DHSs pattern, the MS SNP affected genes are predicted to be involved in immune cell activation and the lncRNA affected by the IBD SNP is involved in innate immune function. (C) The expression pattern for eQTL genes across seven different immune cell types were obtained from two individuals and the average expression levels are shown as a heatmap.
Fig. 6
Fig. 6
The size of the LD block and lncRNAs facilitate looping interactions to regulate multiple genes in cis. (A) The size of the LD blocks between SNPs that affect single genes (single-gene SNPs) and SNPs that affect multiple genes (multi-gene SNPs) was compared. The average size of the LD block for single-gene SNPs (100 kb) was significantly different from the 175 kb for multi-gene SNPs (P = 0.0002). The significant difference was tested using the Wilcoxon Rank test. (B) Mapping eQTLs for SNPs affecting lncRNA and using a 2 Mb cis-window found 69% of the AID-SNPs that impact lncRNAs are SNPs affecting multiple genes compared to 40% of AID-SNPs that impact only protein-coding genes. (C) Ulcerative colitis-associated SNP rs6667605 at 1q36.32 affects three genes (TNFRSF14 is a protein-coding gene, RP3-395M20.8 and RP3-395M20.7 are lncRNAs). Pink loops depict the looping interactions mediated by RNAPII that lie between the UC-associated eQTL locus and the corresponding target genes in GM12878 (B-lymphoblastoid) cells. The peaks in the middle panel depict the RNAPII occupancy along this locus in GM12878 cells. The bottom panel shows the expression levels of genes in this locus. Expression signals from the + and – strands are separated into green and blue, respectively.

Similar articles

Cited by

References

    1. Welter D, MacArthur J, Morales J, Burdett T, Hall P, Junkins H, et al. The NHGRI GWAS Catalog, a curated resource of SNP-trait associations. Nucleic Acids Res. 2014;42:D1001–D1006. - PMC - PubMed
    1. Ricano-Ponce I, Wijmenga C. Mapping of Immune-mediated Disease Genes. Annual Review of Genomics and Human Genetics. 2013 - PubMed
    1. Kumar V, Wijmenga C, Xavier RJ. Genetics of immune-mediated disorders: from genome-wide association to molecular mechanism. Curr Opin Immunol. 2014;31C:51–57. - PMC - PubMed
    1. Westra HJ, Peters MJ, Esko T, Yaghootkar H, Schurmann C, Kettunen J, et al. Systematic identification of trans eQTLs as putative drivers of known disease associations. Nat Genet. 2013;45:1238–1243. - PMC - PubMed
    1. Harrow J, Frankish A, Gonzalez JM, Tapanari E, Diekhans M, Kokocinski F, et al. GENCODE: the reference human genome annotation for The ENCODE Project. Genome Res. 2012;22:1760–1774. - PMC - PubMed

URLs

    1. UCSC genome browser; http://genome-euro.ucsc.edu/index.html.

    1. RNAseq data downloaded from public databases; https://www.ebi.ac.uk/arrayexpress/.

    1. Access to RNA network; http://genenetwork.nl/wordpress/.

    1. Access to Genotype Harmonizer; http://www.molgenis.org/systemsgenetics/.

    1. Human Autophagy Database; http://autophagy.lu/clustering/index.html.

Publication types

MeSH terms