. 2016 Feb 22:6:20807.
doi: 10.1038/srep20807.

PAX6 Isoforms, along with Reprogramming Factors, Differentially Regulate the Induction of Cornea-specific Genes

Affiliations

PAX6 Isoforms, along with Reprogramming Factors, Differentially Regulate the Induction of Cornea-specific Genes

Yuzuru Sasamoto et al. Sci Rep. .

Abstract

PAX6 is the key transcription factor involved in eye development in humans, but the differential functions of the two PAX6 isoforms, isoform-a and isoform-b, are largely unknown. To reveal their function in the corneal epithelium, PAX6 isoforms, along with reprogramming factors, were transduced into human non-ocular epithelial cells. Herein, we show that the two PAX6 isoforms differentially and cooperatively regulate the expression of genes specific to the structure and functions of the corneal epithelium, particularly keratin 3 (KRT3) and keratin 12 (KRT12). PAX6 isoform-a induced KRT3 expression by targeting its upstream region. KLF4 enhanced this induction. A combination of PAX6 isoform-b, KLF4, and OCT4 induced KRT12 expression. These new findings will contribute to furthering the understanding of the molecular basis of the corneal epithelium specific phenotype.


Figures
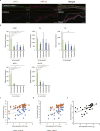
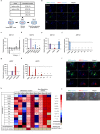
Figure 1
Figure 1. Marker gene expression in the corneal epithelium.
(a) Immunofluorescence staining of KRT3 and KRT12 in human corneal epithelium in vivo. The dotted lines indicate where the micro-dissections were performed. Each scale bar represents 50 μm. (b) Quantitative RT-PCR (qRT-PCR) analysis of total PAX6, PAX6-a, PAX6-b, KRT3 and KRT12 mRNA levels in 4 areas of the human corneal epithelium (central-apical, central-basal, limbal-apical and limbal-basal) and in the conjunctival epithelium (n = 4). The data are presented as the mean ± standard deviation (SD). *p < 0.01 and **p < 0.05 versus central-apical corneal epithelium by Dunnett’s test. (c) Correlation between gene expression levels of PAX6-a and KRT3, or KRT12, in human limbal epithelial cells in vivo (n = 37), assessed by a single-cell gene expression analysis (correlation coefficient (r) = 0.38, p = 0.02 and r = 0.64, p < 0.01, respectively). (d) Correlation between the gene expression levels of PAX6-b and KRT3, or KRT12, in human limbal epithelial cells in vivo (n = 37), assessed by single-cell gene expression analysis (r = 0.47, p < 0.01 and r = 0.64, p < 0.01, respectively). (e) Correlation between the gene expression levels of PAX6-a and PAX6-b in human limbal epithelial cells in vivo (n = 37), assessed by single-cell gene expression analysis (r = 0.60, p < 0.01). Pa, PAX6-isoform-a; Pb, PAX6-isoform-b.
Figure 2
Figure 2. Screening of KRT12 and KRT3 expression levels.
(a) Schematic representation of the transcription factor screening. (b) Immunofluorescence staining of KRT3 and KRT12 in PAX6-a- and PAX6-b-transduced OKF6/TERT-1 cells. (c-f) qRT-PCR of KRT12 mRNA levels at day 3 (n = 6). (g,h) qRT-PCR of KRT3 mRNA levels at day 3 (n = 6). (i) Immunofluorescence staining of KRT12 and KRT3 in PAX6-a-PAX6-b-OCT4-KLF4-, PAX6-a-OCT4-KLF4- and PAX6-b-OCT4-KLF4-transduced OKF6/TERT-1 cells. (j) Low-power field of immunofluorescence staining of PAX6-a-PAX6-b-OCT4-KLF4-transduced OKF6/TERT-1 cells laid over a phase contrast image. (k) Effect of various patterns of transduction on keratin mRNA levels measured by qRT-PCR after adjusting the total PAX6 mRNA level in the transduced OKF6/TERT-1 cells to match that of the in vivo corneal epithelium (n = 4 to 8). The scale numbers are presented as the log10 of the relative gene expression. Human corneal epithelium and conjunctival epithelium in vivo were used as controls. Pa, PAX6-isoform-a; Pb, PAX6-isoform-b; O, OCT4; S, SOX2; K, KLF4; M, c-Myc. The data presented in (c,d), (e,f), and (g,h) are from the same experiments. The data are presented as the mean ± SEM (ch). *p < 0.01 and **p < 0.05 versus control by Dunnett’s test. Scale bars represent 50 μm (b,i) and 100 μm (j).
Figure 3
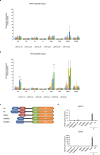
Figure 3. Regulation of KRT12 and KRT3 by two isoforms of PAX6.
(a,b) Luciferase reporter assay using 1 to 6 K base pairs upstream of KRT12 (a) and KRT3 (b). The reporters were co-transfected with the PAX6-a, PAX6-b, OCT4 and KLF4 vectors or their combinations (n = 6). The luminescence was normalized to that of the samples co-transfected with lacZ. **p < 0.05 versus control by paired t-test with a Bonferroni correction. (c) Schematic representation of the truncated PAX6 mutants. (d) qRT-PCR of KRT12 and KRT3 mRNA levels in OKF6/TERT-1 cells transduced with the truncated PAX6 mutants, OCT4 and KLF4 (n = 4 to 9). The mRNA levels of cells transduced with full-length PAX6 from Fig. 2k are included for reference. Pa, PAX6-isoform-a; Pb, PAX6-isoform-b; O, OCT4; K, KLF4; PAI, PAI domain; RED, RED domain; HD, homeodomain; PST, proline/serine/threonine-rich transactivation domain. The data are presented as the mean ± SEM (a,b,d).
Figure 4
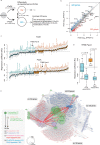
Figure 4. Transcriptome analysis and inference of the regulatory network in OKF6/TERT-1 cells.
(a) Schematic representation of the identification of DUGs in PAX6-a-OCT4-KLF4 and PAX6-b-OCT4-KLF4 transduced cells. The numbers in parentheses represent the p-values of a hypergeometric test with a Bonferroni correction. (b) Correlation between the expression levels of PAX6-a-OCT4-KLF4- and PAX6-b-OCT4-KLF4-dependent DUGs. (c) Distribution of regression coefficients for 103 putative TFBSs that were considered important to explain the expression levels of PAX6-a-OCT4-KLF4- (upper panel) and PAX6-b-OCT4-KLF4-dependent DUGs (lower panel). TFBS Pax-6 is a putative binding site for PAX6 isoforms. (d) Changes in the regression coefficients of TFBS Pax-6 in the absence and presence of keratins (KRTs). (e) Gene regulatory network inferred from the network of PAX6-a-OCT4-KLF4 and PAX6-b-OCT4-KLF4 (Supplementary Fig.S3b) and PAX6-a and PAX6-b transductions (Supplementary Fig. S3e). The size of the circles representing the transcription factors in the network is proportional to the total number of targeted genes. Pa, PAX6-isoform-a; Pb, PAX6-isoform-b; O, OCT4; K, KLF4; FC, fold change; FDR, false discovery rate; DUG, differentially up-regulated gene; GO, gene ontology; NA; not available; FPKM, fragments per kilobase of exon per million mapped reads; TF, transcription factor; TFBS, TF-binding site; KRT, keratin. The data are presented as quantile plots (c,d).
Figure 5
Figure 5. Single-cell gene expression analysis of transduced OKF6/TERT-1 cells.
(a) Heatmap of the expression (Global Z-Score) of each single OKF6/TERT-1 cell, transduced with PAX6-a-PAX6-b-OCT4-KLF4, PAX6-a-OCT4-KLF4 and PAX6-b-OCT4-KLF4. Corneal epithelial cells in vitro and feeder-free iPSCs are listed for reference. (b) Gene expression of KRT12, KRT3, and transgenes, subgrouped by KRT12 expression level (positive or negative). (c) Gene expression of KRT12, KRT3, and transgenes, subgrouped by KRT3 expression level (positive or negative). Pa, PAX6-isoform-a; Pb, PAX6-isoform-b; O, OCT4; K, KLF4; iPSCs, induced pluripotent stem cells. The data are presented as the mean ± SEM (b,c). *p < 0.01 and **p < 0.05 obtained with a t-test.
Figure 6
Figure 6. Effects of the epigenetic state on KRT12 induction and of transgenes on different cell types.
(a) Gene expression of NANOG, KDR, and SOX17, subgrouped by KRT12 expression level (positive or negative). **p < 0.05 by t-test. (b) qRT-PCT analysis of KRT12 and KRT3 mRNA levels in PAX6-a-OCT4-KLF4- or PAX6-b-OCT4-KLF4-transduced OKF6/TERT-1 cells, incubated with small molecules (n = 4). *p < 0.01 and **p < 0.05 versus control, obtained by a Dunnett’s test. (c) qRT-PCR analysis of KRT12 and KRT3 mRNA levels in different human cells (n = 4 to 8) transduced with PAX6-a, PAX6-b, OCT4, and KLF4. The scale numbers are presented as the log10 of the relative gene expression. The mRNA levels of transduced OKF6/TERT-1 cells from Fig. 2k are listed for reference. *p < 0.01 and **p < 0.05 versus control, obtained by a Dunnett’s test. Pa, PAX6-isoform-a; Pb, PAX6-isoform-b; O, OCT4; K, KLF4; HOK, primary Human Oral Keratinocyte; HCEC, human corneal endothelial cells; HUVEC, normal human umbilical vein endothelial cells; NHDF-Ad, adult normal human dermal fibroblasts; iPSC, induced pluripotent stem cell. The data are presented as the mean ± SEM (a,b).
Figure 7
Figure 7. A schematic representation of the proposed pathways.
The epigenetic differences between the cell lineages are depicted as barriers of the epigenome. The roles of each transcription factor in the induction of corneal epithelium-specific genes are as follows: (1) PAX6-a and PAX6-b transduction induces KRT3 and KRT12 expression, respectively, (2) KLF4 accelerates the differentiation, (3) highly expressed transgenes are required for KRT12 induction, (4) epigenetic modifications brought about by OCT4 are required to induce KRT12 expression. Unlike KRT12 induction, KRT3 induction did not require OCT4 because the epigenetic state of KRT3 in the surface ectoderm-derived cells was already accessible for the binding of transcription factors. As a cell source, the surface ectoderm-derived cells were able to effectively induce KRT3 and KRT12 expression.

Similar articles

Cited by

References

    1. Glaser T., Walton D. S. & Maas R. L. Genomic structure, evolutionary conservation and aniridia mutations in the human PAX6 gene. Nat Genet 2, 232–239 (1992). - PubMed
    1. Walther C. & Gruss P. Pax-6, a murine paired box gene, is expressed in the developing CNS. Development 113, 1435–1449 (1991). - PubMed
    1. Epstein J. A. et al. Two independent and interactive DNA-binding subdomains of the Pax6 paired domain are regulated by alternative splicing. Genes Dev 8, 2022–2034 (1994). - PubMed
    1. Xu H. E. et al. Crystal structure of the human Pax6 paired domain-DNA complex reveals specific roles for the linker region and carboxy-terminal subdomain in DNA binding. Genes Dev 13, 1263–1275 (1999). - PMC - PubMed
    1. Kozmik Z., Czerny T. & Busslinger M. Alternatively spliced insertions in the paired domain restrict the DNA sequence specificity of Pax6 and Pax8. EMBO J 16, 6793–6803 (1997). - PMC - PubMed

Publication types

MeSH terms