

Gene co-expression analysis identifies brain regions and cell types involved in migraine pathophysiology: a GWAS-based study using the Allen Human Brain Atlas
- PMID: 26899160
- PMCID: PMC4796339
- DOI: 10.1007/s00439-016-1638-x
Gene co-expression analysis identifies brain regions and cell types involved in migraine pathophysiology: a GWAS-based study using the Allen Human Brain Atlas
Abstract
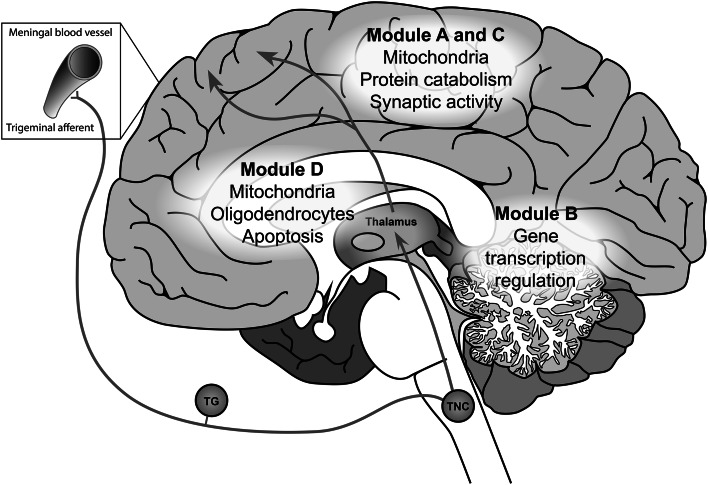
Migraine is a common disabling neurovascular brain disorder typically characterised by attacks of severe headache and associated with autonomic and neurological symptoms. Migraine is caused by an interplay of genetic and environmental factors. Genome-wide association studies (GWAS) have identified over a dozen genetic loci associated with migraine. Here, we integrated migraine GWAS data with high-resolution spatial gene expression data of normal adult brains from the Allen Human Brain Atlas to identify specific brain regions and molecular pathways that are possibly involved in migraine pathophysiology. To this end, we used two complementary methods. In GWAS data from 23,285 migraine cases and 95,425 controls, we first studied modules of co-expressed genes that were calculated based on human brain expression data for enrichment of genes that showed association with migraine. Enrichment of a migraine GWAS signal was found for five modules that suggest involvement in migraine pathophysiology of: (i) neurotransmission, protein catabolism and mitochondria in the cortex; (ii) transcription regulation in the cortex and cerebellum; and (iii) oligodendrocytes and mitochondria in subcortical areas. Second, we used the high-confidence genes from the migraine GWAS as a basis to construct local migraine-related co-expression gene networks. Signatures of all brain regions and pathways that were prominent in the first method also surfaced in the second method, thus providing support that these brain regions and pathways are indeed involved in migraine pathophysiology.
Figures


Similar articles
-
Involvement of astrocyte and oligodendrocyte gene sets in migraine.Cephalalgia. 2016 Jun;36(7):640-7. doi: 10.1177/0333102415618614. Epub 2015 Dec 7. Cephalalgia. 2016. PMID: 26646788
-
Plasma pQTL and brain eQTL integration identifies PNKP as a therapeutic target and reveals mechanistic insights into migraine pathophysiology.J Headache Pain. 2024 Nov 22;25(1):202. doi: 10.1186/s10194-024-01922-z. J Headache Pain. 2024. PMID: 39578729 Free PMC article.
-
Genome-wide analysis of blood gene expression in migraine implicates immune-inflammatory pathways.Cephalalgia. 2018 Feb;38(2):292-303. doi: 10.1177/0333102416686769. Epub 2017 Jan 6. Cephalalgia. 2018. PMID: 28058943
-
Genome-wide association studies in migraine: current state and route to follow.Curr Opin Neurol. 2016 Jun;29(3):302-8. doi: 10.1097/WCO.0000000000000316. Curr Opin Neurol. 2016. PMID: 26967494 Review.
-
Genetics of migraine: Delineation of contemporary understanding of the genetic underpinning of migraine.Handb Clin Neurol. 2023;198:85-103. doi: 10.1016/B978-0-12-823356-6.00012-3. Handb Clin Neurol. 2023. PMID: 38043973 Review.
Cited by
-
Genetics of migraine: where are we now?J Headache Pain. 2023 Feb 20;24(1):12. doi: 10.1186/s10194-023-01547-8. J Headache Pain. 2023. PMID: 36800925 Free PMC article. Review.
-
Potential Protective Mechanisms of Ketone Bodies in Migraine Prevention.Nutrients. 2019 Apr 10;11(4):811. doi: 10.3390/nu11040811. Nutrients. 2019. PMID: 30974836 Free PMC article. Review.
-
Mitochondrial disease manifestations in relation to transcriptome location and function.Mol Genet Metab. 2022 Jan;135(1):82-92. doi: 10.1016/j.ymgme.2021.12.008. Epub 2021 Dec 23. Mol Genet Metab. 2022. PMID: 34972656 Free PMC article.
-
Co-expression Patterns between ATN1 and ATXN2 Coincide with Brain Regions Affected in Huntington's Disease.Front Mol Neurosci. 2017 Nov 30;10:399. doi: 10.3389/fnmol.2017.00399. eCollection 2017. Front Mol Neurosci. 2017. PMID: 29249939 Free PMC article.
-
Association of expression of DRD2 rs1800497 polymorphism with migraine risk in Han Chinese individuals.J Pain Res. 2018 Apr 12;11:763-769. doi: 10.2147/JPR.S151350. eCollection 2018. J Pain Res. 2018. PMID: 29695928 Free PMC article.
References
-
- Anttila V, Stefansson H, Kallela M, Todt U, Terwindt GM, Calafato MS, Nyholt DR, Dimas AS, Freilinger T, Muller-Myhsok B, Artto V, Inouye M, Alakurtti K, Kaunisto MA, Hamalainen E, de Vries B, Stam AH, Weller CM, Heinze A, Heinze-Kuhn K, Goebel I, Borck G, Gobel H, Steinberg S, Wolf C, Bjornsson A, Gudmundsson G, Kirchmann M, Hauge A, Werge T, Schoenen J, Eriksson JG, Hagen K, Stovner L, Wichmann HE, Meitinger T, Alexander M, Moebus S, Schreiber S, Aulchenko YS, Breteler MM, Uitterlinden AG, Hofman A, van Duijn CM, Tikka-Kleemola P, Vepsalainen S, Lucae S, Tozzi F, Muglia P, Barrett J, Kaprio J, Farkkila M, Peltonen L, Stefansson K, Zwart JA, Ferrari MD, Olesen J, Daly M, Wessman M, van den Maagdenberg AM, Dichgans M, Kubisch C, Dermitzakis ET, Frants RR, Palotie A, International Headache Genetics C Genome-wide association study of migraine implicates a common susceptibility variant on 8q22.1. Nat Genet. 2010;42:869–873. doi: 10.1038/ng.652. - DOI - PMC - PubMed
-
- Anttila V, Winsvold BS, Gormley P, Kurth T, Bettella F, McMahon G, Kallela M, Malik R, de Vries B, Terwindt G, Medland SE, Todt U, McArdle WL, Quaye L, Koiranen M, Ikram MA, Lehtimaki T, Stam AH, Ligthart L, Wedenoja J, Dunham I, Neale BM, Palta P, Hamalainen E, Schurks M, Rose LM, Buring JE, Ridker PM, Steinberg S, Stefansson H, Jakobsson F, Lawlor DA, Evans DM, Ring SM, Farkkila M, Artto V, Kaunisto MA, Freilinger T, Schoenen J, Frants RR, Pelzer N, Weller CM, Zielman R, Heath AC, Madden PA, Montgomery GW, Martin NG, Borck G, Gobel H, Heinze A, Heinze-Kuhn K, Williams FM, Hartikainen AL, Pouta A, van den Ende J, Uitterlinden AG, Hofman A, Amin N, Hottenga JJ, Vink JM, Heikkila K, Alexander M, Muller-Myhsok B, Schreiber S, Meitinger T, Wichmann HE, Aromaa A, Eriksson JG, Traynor BJ, Trabzuni D, Rossin E, Lage K, Jacobs SB, Gibbs JR, Birney E, Kaprio J, Penninx BW, Boomsma DI, van Duijn C, Raitakari O, Jarvelin MR, Zwart JA, Cherkas L, Strachan DP, Kubisch C, Ferrari MD, van den Maagdenberg AM, Dichgans M, Wessman M, Smith GD, Stefansson K, Daly MJ, Nyholt DR, Chasman DI, Palotie A, North American Brain Expression C, Consortium UKBE, International Headache Genetics C Genome-wide meta-analysis identifies new susceptibility loci for migraine. Nat Genet. 2013;45:912–917. doi: 10.1038/ng.2676. - DOI - PMC - PubMed
-
- Bunyavanich S, Schadt EE, Himes BE, Lasky-Su J, Qiu W, Lazarus R, Ziniti JP, Cohain A, Linderman M, Torgerson DG, Eng CS, Pino-Yanes M, Padhukasahasram B, Yang JJ, Mathias RA, Beaty TH, Li X, Graves P, Romieu I, Navarro Bdel R, Salam MT, Vora H, Nicolae DL, Ober C, Martinez FD, Bleecker ER, Meyers DA, Gauderman WJ, Gilliland F, Burchard EG, Barnes KC, Williams LK, London SJ, Zhang B, Raby BA, Weiss ST. Integrated genome-wide association, coexpression network, and expression single nucleotide polymorphism analysis identifies novel pathway in allergic rhinitis. BMC Med Genomics. 2014;7:48. doi: 10.1186/1755-8794-7-48. - DOI - PMC - PubMed
Publication types
MeSH terms
Grants and funding
LinkOut - more resources
Full Text Sources
Other Literature Sources
Medical
