. 2016 Jun;10(6):789-805.
doi: 10.1016/j.molonc.2016.01.003. Epub 2016 Jan 29.

Selective inhibition of tumor cell associated Vacuolar-ATPase 'a2' isoform overcomes cisplatin resistance in ovarian cancer cells

Affiliations

Selective inhibition of tumor cell associated Vacuolar-ATPase 'a2' isoform overcomes cisplatin resistance in ovarian cancer cells

Arpita Kulshrestha et al. Mol Oncol. 2016 Jun.

Abstract

Development of resistance to platinum compounds significantly hinders successful ovarian cancer (OVCA) treatment. In tumor cells, dysregulated pH gradient across cell membranes is a key physiological mechanism of metastasis/chemo-resistance. These pH alterations are mediated by aberrant activation of key multi-subunit proton pumps, Vacuolar-ATPases (V-ATPases). In tumor cells, its 'a2' isoform (V-ATPase-V0a2) is a component of functional plasma-membrane complex and promotes tumor invasion through tumor-acidification and immuno-modulation. Its involvement in chemo-resistance has not been studied. Here, we show that V-ATPase-V0a2 is over-expressed in acquired-cisplatin resistant OVCA cells (cis-A2780/cis-TOV112D). Of all the 'a' subunit isoforms, V-ATPase-V0a2 exhibited an elevated expression on plasma membrane of cisplatin-resistant cells compared to sensitive counterparts. Immuno-histochemistry revealed V-ATPase-V0a2 expression in both low grade (highly drug-resistant) and high grade (highly recurrent) human OVCA tissues indicating its role in a centralized mechanism of tumor resistance. In cisplatin resistant cells, shRNA mediated inhibition of V-ATPase-V0a2 enhanced sensitivity towards both cisplatin and carboplatin. This improved cytotoxicity was mediated by enhanced cisplatin-DNA-adduct formation and suppressed DNA-repair pathway, leading to enhanced apoptosis. Suppression of V0a2 activity strongly reduced cytosolic pH in resistant tumor cells, which is known to enhance platinum-associated DNA-damage. As an indicator of reduced metastasis and chemo-resistance, in contrast to plasma membrane localization, a diffused cytoplasmic localization of acidic vacuoles was observed in V0a2-knockdown resistant cells. Interestingly, pre-treatment with monoclonal V0a2-inhibitory antibody enhanced cisplatin cytotoxicity in resistant cells. Taken together, our findings suggest that the isoform specific inhibition of V-ATPase-V0a2 could serve as a therapeutic strategy for chemo-resistant ovarian carcinoma and improve efficacy of platinum drugs.

Keywords: Cisplatin resistance; Ovarian cancer; Vacuolar ATPase; a2 isoform.


Figures

Figure 1
Figure 1
Vacuolar ATPase ‘a’ subunit isoforms are over‐expressed in acquired cisplatin resistant ovarian cancer cells. (A) Dose‐survival curves of cisplatin sensitive A2780 cell line and its resistant counterpart, cis‐A2780 following a 48 h incubation with different concentrations of cisplatin. (B) Similarly, dose–survival curves of cis‐TOV112D shows increase in cisplatin resistance compared to sensitive TOV‐112D. (C) Q‐RT‐PCR analysis showing mRNA levels of vacuolar ATPase‐V0 ‘a’ subunit isoforms (V‐ATPase‐V0a1, V0a2 and V0a3) in cisplatin resistant cell lines compared to respective sensitive counterparts. The Ct values were normalized against the Ct values for GAPDH from the same preparation. The data are provided as mRNA fold change in cisplatin resistant tumor cells over sensitive cells (**P < 0.001, *P < 0.05). (D) Immuno‐fluorescence analysis of cisplatin resistant cells using isoform specific antibodies against V0a1/V0a2/V0a3 compared to cisplatin sensitive ovarian tumor cells. Representative cis – A2780 (cis‐Resistant) and A2780 (cis‐Sensitive) cell lines are shown. Magnification (×200); scale bar – 10 μM. All experiments were performed at least in triplicate and data is provided as means with standard deviations.
Figure 2
Figure 2
Cisplatin resistant ovarian carcinoma cells exhibit over‐expressed V‐ATPase‐V0a2 on the tumor cell surface. (A) Total protein from cisplatin resistant ovarian tumor cells and respective sensitive phenotypes were immuno‐blotted with anti‐V‐ATPase‐V0a2 antibody that showed V0a2 over expression in cisplatin resistant cells. (B) The surface expression of V‐ATPase‐V0a2 was also elevated in non‐permeabilized cis‐R (cis‐A2780/cis‐TOV112D; orange line) compared to cis‐S (A2780/TOV112D; blue line) as determined by fluorescence‐activated cell sorting (FACS). Red line indicates primary antibody isotype control. (C) Immuno‐fluorescence analysis showing elevated V‐ATPase‐V0a2 expression on the plasma membrane of cisplatin resistant OVCA cell lines as shown by green staining. Magnification – ×600; scale bars; 10 μm (D) Confocal microscopy analysis of V‐ATPase‐V0a2 (in green) and cells surface marker, pan cadherin (in red) in cisplatin sensitive ovarian cancer cells (Cis‐S) and cisplatin resistant ovarian cancer cells (Cis‐R). Merged images (yellow regions) reveal the co‐localization of V‐ATPase‐V0a2 with pan cadherin which is more pronounced in resistant cells. Original magnification – ×600; scale bars; 5 μm. Representative images from three independent experiments are shown.
Figure 3
Figure 3
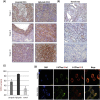
V‐ATPase‐V0a2 is over‐expressed in human ovarian carcinoma tissues. Positive staining (brown) observed for V‐ATPase‐V0a2 in (A): tissues from low and high grade serous ovarian cancer patients (B). Representative normal human ovarian cancer tissue showing very low V0a2 expression. Original magnification – ×400. (C) IHC score of V‐ATPase‐V0a2 expression revealed significantly higher expression in high grade carcinoma which are frequently associated with chemo‐resistance (n = 3 in respective group). (D) Immuno‐fluorescence analysis of V‐ATPase‐V0a2 (green) in the human ovarian cancer cell lines showing its co‐expression with plasma membrane associated V‐ATPase‐V1D subunit (red). Merged areas shown in yellow. Nuclear staining with DAPI. Original magnification: ×800; scale bars, 100 μm. Representative images from three independent experiments are shown. For normal tissues, the following tissue sections were used: human adult normal ovary; Biochain (Cat no: T2234183).
Figure 4
Figure 4
Stable knockdown of V‐ATPase‐V0a2 in cisplatin resistant ovarian cancer cells impairs cell growth. V‐ATPase‐V0a2 expression was knock down in cisplatin resistant cells (cis‐A2780) by transfection with SureSilencing shRNA plasmids (Qiagen, Valencia, CA, USA) Suppression of V0a2 expression was confirmed by (A) Quantitative real time PCR showing the mRNA levels of sh‐V0a2‐cis (V0a2 knock down cells) compared to scrambled control (sh‐scr‐cis). Data are expressed as fold change compared shV0a2‐cis‐control cells and as mean ± SD. *P < 0.05. (B) For determining protein levels, western blot was performed using isoform specific monoclonal anti‐V0a2 antibody. (C) FACS analysis was performed to validate the knock down of V0a2 in shV0a2‐cis cells. Sh‐scr‐cis (Control; green line), A2780 (Cis‐S; blue line), V0a2 knock down cells (sh‐V0a2‐cis; orange line). Red line indicates primary antibody isotype control. (D) In vitro tumor cell growth was monitored in shV0a2‐cis and shV0a2‐cis‐control cells. All experiments were performed at least three times in triplicate.
Figure 5
Figure 5
Inhibition of V‐ATPase‐V0a2 sensitizes the cisplatin resistant cells to platinum drugs. (A) Phase contrast images showing the cell morphology of control cis‐A2780 (sh‐scr‐cis) and V‐ATPase‐V0a2 knockdown cells (sh‐V0a2‐cis) upon treatment with cisplatin (20 μM, 24 h). (B) Dose–response curve of sh‐scr‐cis, sh‐V0a2‐cis, cisplatin resistant (cis‐R) and cisplatin sensitive cells (cis S) following 48 h treatment with cisplatin. The IC50 values are depicted in histograms in the right panel.(C) Dose response curves of cis‐S, sh‐scr‐cis, sh‐V0a2‐cis and cis‐R following 48 h treatment with carboplatin. The IC50 values are depicted in histograms in the right panel. Values are means (±S.D) of two independent experiments performed in triplicate. Compared with control **P < 0.01, *P < 0.05 (Mann–Whitney test).
Figure 6
Figure 6
Inhibition of V‐ATPase‐V0a2 increases DNA damage and apoptosis in cisplatin resistant ovarian cancer cells. Cisplatin resistant ovarian cancer cells were stably knock down for V‐ATPase‐V0a2 and then treated with cisplatin for up to 48 h and fixed using ice‐cold 70% ethanol. Cells were stained overnight at 4 °C using a primary antibody that specifically recognizes cisplatin‐GpG DNA adducts. (A) Flow cytometry analysis was performed by indirect staining using secondary anti‐rat FITC®‐labeled antibody. Isotype control (Red line), Cisplatin sensitive cells (Cis‐S; light green line), Cisplatin resistant WT cells (Cis‐R; Blue line), knockdown scrambled control cisplatin resistant cells (sh‐scr‐cis control; dark green line), V‐ATPase‐V0a2 knock down cisplatin resistant cells (sh‐V0a2‐cis; Orange line) showing higher DNA damage in V0a2 knock down cells compared to cisplatin resistant control cells. (B) Histogram showing geometric mean fluorescence intensities of anti‐cisplatin DNA adduct antibody‐stained cells divided by isotype ± s.e.m (n = 3). (C) Same cells were subjected to Immunofluorescence staining; cisplatin adducts (green) and nuclear staining (blue) at 20× magnification. Cisplatin sensitive A2780 cells [panel (i)], Control cisplatin resistant cells [panel (ii)], and V0a2 knock down cisplatin resistant cells [panel (iii); showing higher DNA damage compared to control cells]. (D)The Annexin V/propidium iodide double staining assay following 20 μM cisplatin treatment for 48 h in (i) V0a2 knock down cisplatin resistant cells and (ii) cisplatin resistant control cells. The percentages in right quadrants represent percentage apoptosis over the blank and are an average of at least two independent trials. All experiments were repeated at least thrice in duplicate.
Figure 7
Figure 7
Cisplatin resistant ovarian cancer cells exhibit a decrease in cytosolic pH and alteration in localization of acidic vacuoles upon V‐ATPase‐V0a2 inhibition. The cytosolic pH was estimated using pH sensitive dye SNARF‐1 (Life Technologies). (A) cisplatin resistant A2780 cells were loaded with SNARF‐1 dye followed by imparting known changes in pH using calibration buffers (pH 4.5–8.0) and calibration curve was generated by recording ratio (480/640 nm) of SNARF‐1F (B) The fluorescence spectra of SNARF‐1 was obtained on cisplatin sensitive, cisplatin resistant and V‐ATPase V0a2 knock down cisplatin resistant cells. The corresponding intracellular pH was obtained from the pH calibration curve (Panel A). Values are means (±S.E.M) of two independent experiments performed in triplicate. **Compared with control P < 0.01 (Mann–Whitney test). (C) shV0a2‐cis knock down cells were treated with 1 μM Lysosensor Green DND‐189 (pH dependent acidic vesicle marker) for 30 min. To visualize the distribution pattern of acidic vesicles in V‐ATPase‐V0a2‐cis, immuno‐fluorescence analysis was performed by live cell imaging (Leica Microsystems). Magnification: 20×; scale bar‐10 μM. Cis‐sensitive‐ cisplatin sensitive A2780 ovarian cancer cells; cis‐resistant control – cisplatin resistant cells containing scrambled knockdown sequence, shV0a2‐cis – V0a2 knock down cells, Baf – Bafilomycin treated cells.
Figure 8
Figure 8
Combinatorial treatment with anti‐V‐ATPase‐V0a2 antibody and cisplatin is more effective in killing cisplatin resistant ovarian tumor cells. Ovarian cancer cells were pretreated with anti‐V‐ATPase‐V0a2 antibody following the treatment with cisplatin (A) Dose–response curves obtained by treating cisplatin sensitive cell line (A2780) or (B) cisplatin resistant cell line (cis‐A2780) with cisplatin alone (Cisplatin only) or pre‐treating them with anti‐V‐ATPase‐V0a2 antibody (cisplatin + anti‐V‐ATPase) or (IgG control antibody) for 6 h before cisplatin treatment. Bafilomycin, vacuolar ATPAse inhibitor, was used as the positive control. Cell death was assayed by using the fluoremetric alamar blue cell viability assay. The histograms represent mean ± SD of three different experiments.
Figure 9
Figure 9
Inhibition of Vacuolar ATPase‐V0a2 in cisplatin resistant cells induces DNA damage mediated cell death through cytosolic acidification. Schematic representation of the mode of cisplatin sensitization in resistant cells upon V‐ATPase‐V0a2 inhibition. Aberrant activation of V‐ATPases in cisplatin resistant tumor cells causes de‐regulation of pH gradient across the cell membranes. (1) V0a2 isoform is expressed as part of the plasma membrane associated V‐ATPase machinery that leads to proton extrusion into extracellular environment (ECM), leading to an acidic extracellular and an alkaline cytosolic pH. The altered pH phenomenon interferes with cisplatin cytotoxicity. At an alkaline cytosolic pH, cisplatin is not effectively hydrolyzed to aqua ligand (active form) and therefore not able to impose DNA damage mediated cell death pathways. (2) Upon inhibition of V‐ATPase‐V0a2 isoform, the proton pump activity is inhibited, marked by the acidification of the cytosol. This low pH leads to effective conversion of cisplatin to aquated form, which causes increased cisplatin‐mediated DNA damage and activation of cell death pathways. Additionally, V0a2 inhibition leads to suppression of DNA damage repair pathways in cisplatin resistant cells, ultimately leading to enhanced cisplatin mediated toxicity.

Similar articles

Cited by

References

    1. Altomare, D.A. , 2004. AKT and mTOR phosphorylation is frequently detected in ovarian cancer and can be targeted to disrupt ovarian tumor cell growth. Oncogene. 23, 5853–5857. - PubMed
    1. American Cancer Society Statistics for 2014. [www.cancer.org].
    1. Barar, J. , Omidi, Y. , 2013. Dysregulated pH in tumor microenvironment checkmates cancer therapy. Bioimpacts. 3, 149–162. - PMC - PubMed
    1. Basu, A. , Krishnamurthy, S. , 2010. Cellular responses to cisplatin-induced DNA damage. J. Nucleic Acids. 2010, - PMC - PubMed
    1. Beyenbach, K.W. , Wieczorek, H. , 2006. The V-type H+ ATPase: molecular structure and function, physiological roles and regulation. J. Exp. Biol. 209, 577–589. - PubMed

MeSH terms