

Direct neural current imaging in an intact cerebellum with magnetic resonance imaging
- PMID: 26899788
- PMCID: PMC4873157
- DOI: 10.1016/j.neuroimage.2016.01.059
Direct neural current imaging in an intact cerebellum with magnetic resonance imaging
Abstract
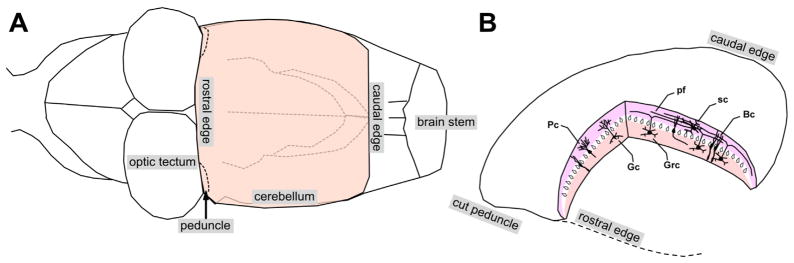
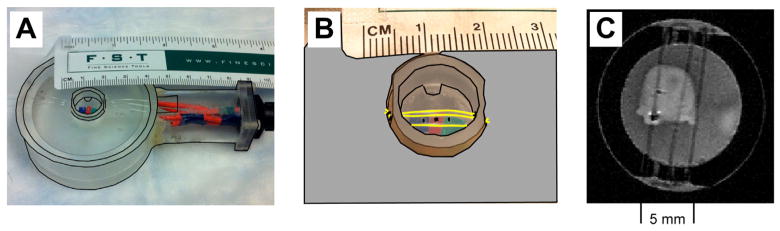
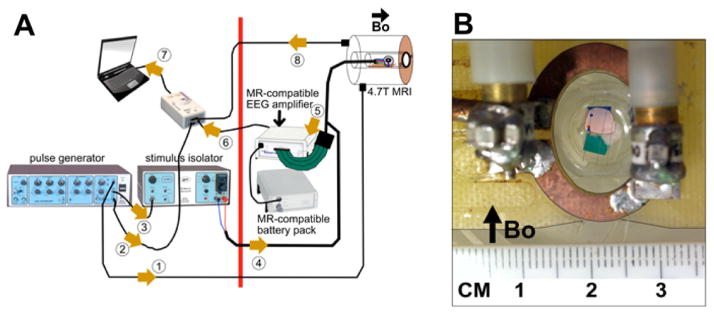
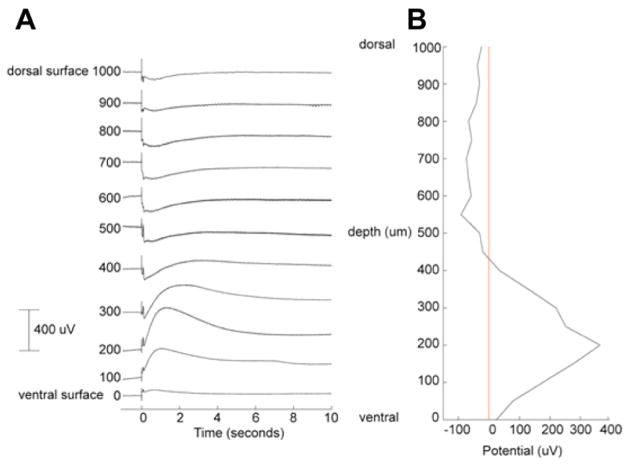
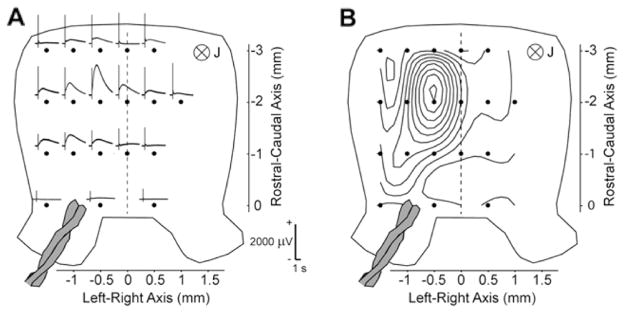
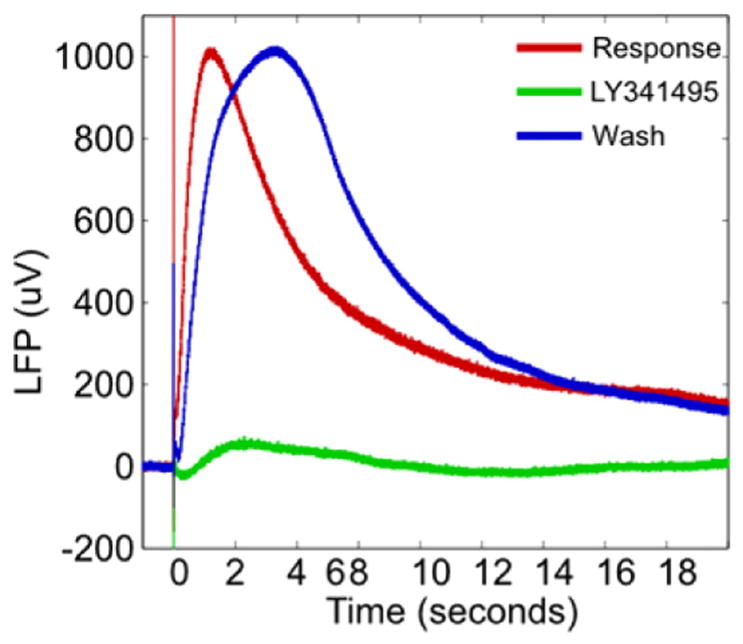
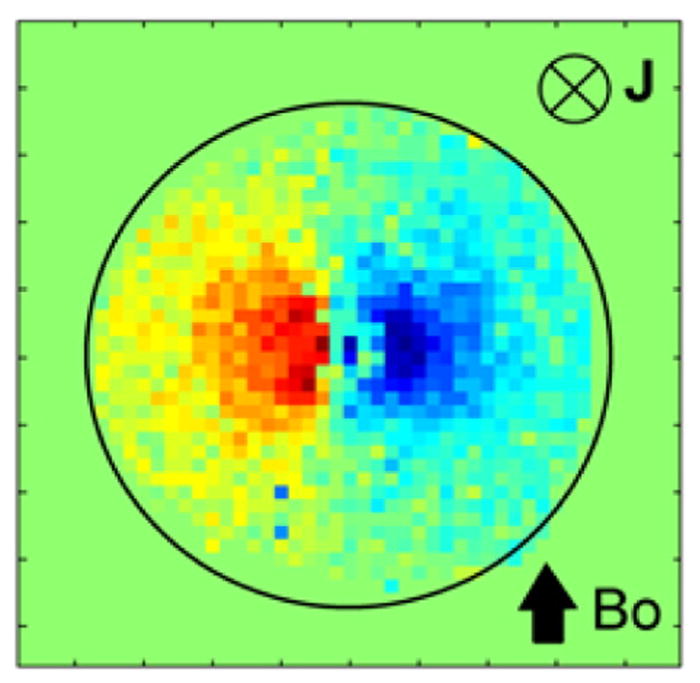
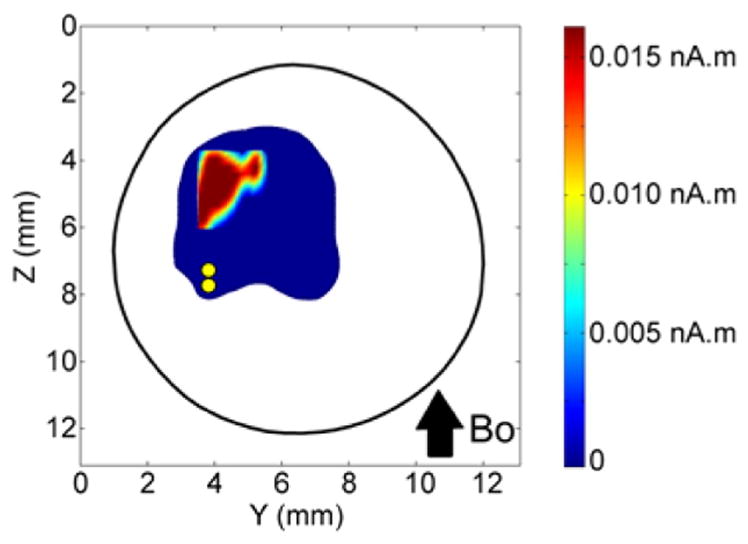
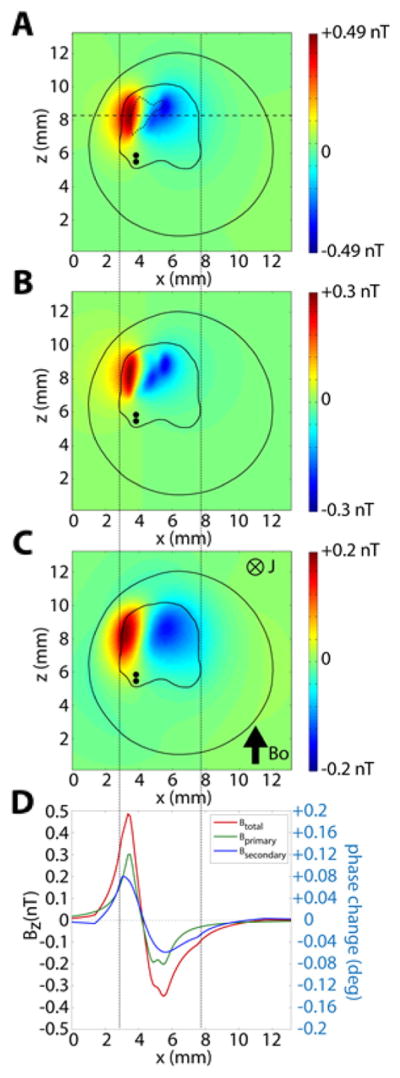
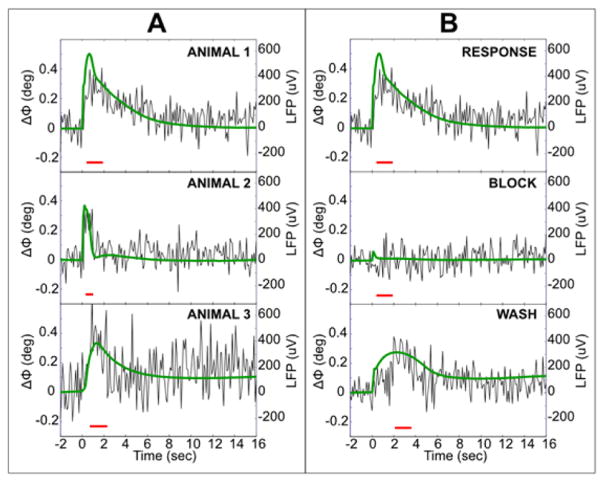
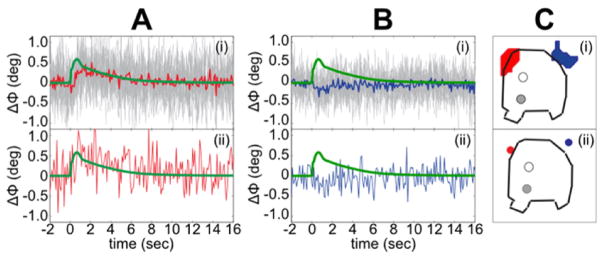
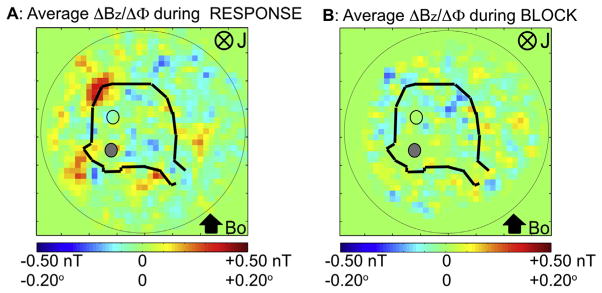
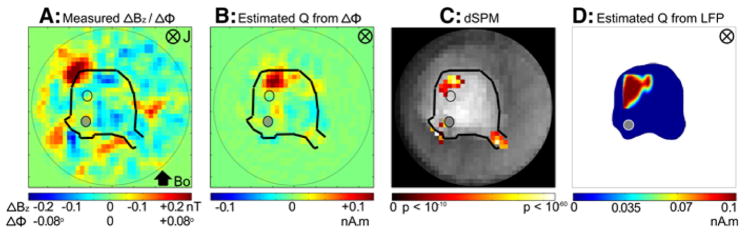
The ability to detect neuronal currents with high spatiotemporal resolution using magnetic resonance imaging (MRI) is important for studying human brain function in both health and disease. While significant progress has been made, we still lack evidence showing that it is possible to measure an MR signal time-locked to neuronal currents with a temporal waveform matching concurrently recorded local field potentials (LFPs). Also lacking is evidence that such MR data can be used to image current distribution in active tissue. Since these two results are lacking even in vitro, we obtained these data in an intact isolated whole cerebellum of turtle during slow neuronal activity mediated by metabotropic glutamate receptors using a gradient-echo EPI sequence (TR=100ms) at 4.7T. Our results show that it is possible (1) to reliably detect an MR phase shift time course matching that of the concurrently measured LFP evoked by stimulation of a cerebellar peduncle, (2) to detect the signal in single voxels of 0.1mm(3), (3) to determine the spatial phase map matching the magnetic field distribution predicted by the LFP map, (4) to estimate the distribution of neuronal current in the active tissue from a group-average phase map, and (5) to provide a quantitatively accurate theoretical account of the measured phase shifts. The peak values of the detected MR phase shifts were 0.27-0.37°, corresponding to local magnetic field changes of 0.67-0.93nT (for TE=26ms). Our work provides an empirical basis for future extensions to in vivo imaging of neuronal currents.
Copyright © 2016 Elsevier Inc. All rights reserved.
Figures
Similar articles
-
Modelling the magnetic signature of neuronal tissue.Neuroimage. 2007 Aug 1;37(1):137-48. doi: 10.1016/j.neuroimage.2007.04.033. Epub 2007 May 4. Neuroimage. 2007. PMID: 17544300
-
Investigation of MR signal modulation due to magnetic fields from neuronal currents in the adult human optic nerve and visual cortex.Magn Reson Imaging. 2006 Jul;24(6):681-91. doi: 10.1016/j.mri.2006.01.005. Epub 2006 Mar 13. Magn Reson Imaging. 2006. PMID: 16824962
-
Further steps toward direct magnetic resonance (MR) imaging detection of neural action currents: optimization of MR sensitivity to transient and weak currents in a conductor.Magn Reson Med. 2006 May;55(5):1038-46. doi: 10.1002/mrm.20857. Magn Reson Med. 2006. PMID: 16602069
-
The neural basis of the blood-oxygen-level-dependent functional magnetic resonance imaging signal.Philos Trans R Soc Lond B Biol Sci. 2002 Aug 29;357(1424):1003-37. doi: 10.1098/rstb.2002.1114. Philos Trans R Soc Lond B Biol Sci. 2002. PMID: 12217171 Free PMC article. Review.
-
Advances in functional imaging of the human cerebellum.Curr Opin Neurol. 2010 Aug;23(4):382-7. doi: 10.1097/WCO.0b013e32833be837. Curr Opin Neurol. 2010. PMID: 20581682 Review.
Cited by
-
Neuronal current imaging: An experimental method to investigate electrical currents in dogs with idiopathic epilepsy.J Vet Intern Med. 2021 Nov;35(6):2828-2836. doi: 10.1111/jvim.16270. Epub 2021 Oct 8. J Vet Intern Med. 2021. PMID: 34623697 Free PMC article.
-
[Fontanel compensation for infant electroencephalography forward modeling method].Sheng Wu Yi Xue Gong Cheng Xue Za Zhi. 2024 Dec 25;41(6):1085-1094. doi: 10.7507/1001-5515.202307003. Sheng Wu Yi Xue Gong Cheng Xue Za Zhi. 2024. PMID: 40000196 Free PMC article. Chinese.
-
In vivo magnetic recording of single-neuron action potentials Abbreviated title: In vivo magnetic single-neuron action potentials.bioRxiv [Preprint]. 2024 May 30:2023.06.30.547194. doi: 10.1101/2023.06.30.547194. bioRxiv. 2024. PMID: 37425851 Free PMC article. Preprint.
-
Boundary Element Fast Multipole Method for Enhanced Modeling of Neurophysiological Recordings.IEEE Trans Biomed Eng. 2021 Jan;68(1):308-318. doi: 10.1109/TBME.2020.2999271. Epub 2020 Dec 21. IEEE Trans Biomed Eng. 2021. PMID: 32746015 Free PMC article.
-
Can MRI Be Used as a Sensor to Record Neural Activity?Sensors (Basel). 2023 Jan 25;23(3):1337. doi: 10.3390/s23031337. Sensors (Basel). 2023. PMID: 36772381 Free PMC article. Review.
References
-
- Allen PJ, Josephs O, Turner R. A method for removing imaging artifact from continuous EEG recorded during functional MRI. NeuroImage. 2000;12(2):230–239. - PubMed
-
- Bandettini PA, Petridou N, Bodurka J. Direct detection of neuronal activity with MRI: fantasy, possibility, or reality? Appl Magn Reson. 2005;29(1):65–88.
-
- Bianciardi M, et al. Combination of BOLD-fMRI and VEP recordings for spin-echo MRI detection of primary magnetic effects caused by neuronal currents. Magn Reson Imaging. 2004;22(10):1429–1440. - PubMed
-
- Blagoev KB, et al. Modelling the magnetic signature of neuronal tissue. NeuroImage. 2007;37(1):137–148. - PubMed
Publication types
MeSH terms
Grants and funding
LinkOut - more resources
Full Text Sources
Other Literature Sources
Medical
