. 2016:12:50.
doi: 10.1007/s11306-016-0971-3. Epub 2016 Feb 8.

Ion mobility mass spectrometry enhances low-abundance species detection in untargeted lipidomics

Affiliations

Ion mobility mass spectrometry enhances low-abundance species detection in untargeted lipidomics

Abdul Basit et al. Metabolomics. 2016.

Abstract

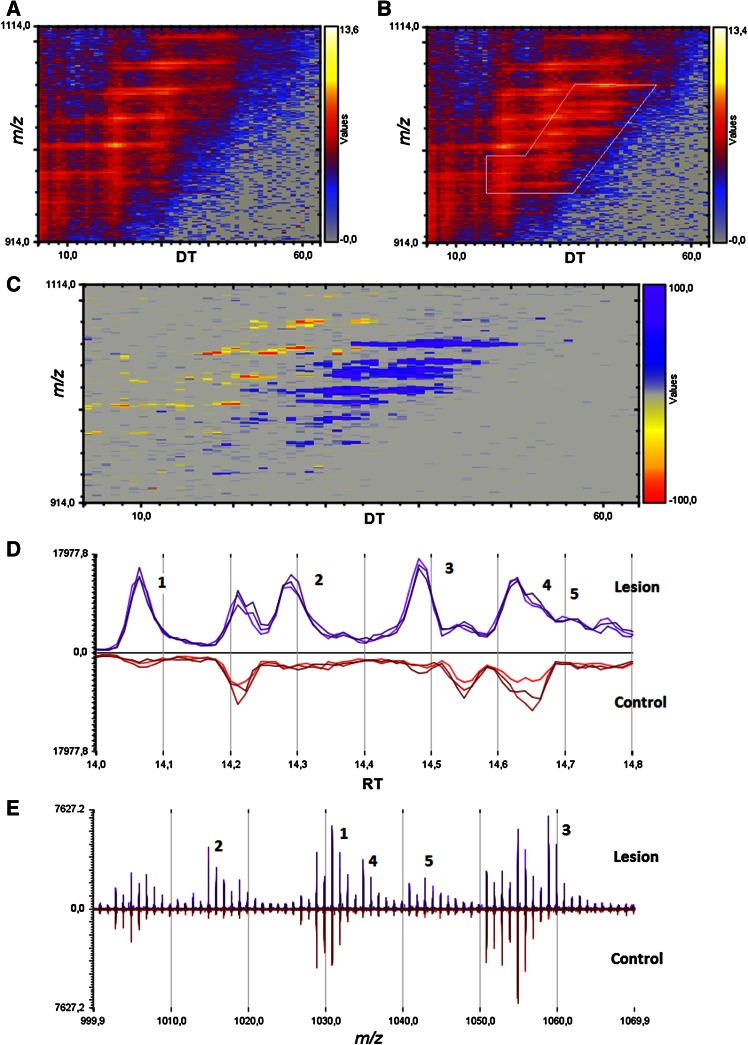
We describe a simple method for the detection of low intensity lipid signals in complex tissue samples, based on a combination of liquid chromatography/mass spectrometry and ion mobility mass spectrometry. The method relies on visual and software-assisted analysis of overlapped mobilograms (diagrams of mass-to-charge ratio, m/z, vs drift time, DT) and was successfully applied in untargeted lipidomics analyses of mouse brain tissue to detect relatively small variations in a scarce class of phospholipids (N-acyl phosphatidylethanolamines) generated during neural tissue damage, against a background of hundreds of lipid species. Standard analytical tools, including Principal Component Analysis, failed to detect such changes.

Keywords: Ion-mobility mass spectrometry; N-acyl phosphatidylethanolamines; Neuroinflammation; Untargeted lipidomics.


Figures

Fig. 1
Fig. 1
Principal Component Analysis score plots of untargeted lipidomics dataset for ESI+ and ESI modes (Panels A and B respectively). The data reveal tissue (substantia nigra vs striatum) but no pathology-related clustering
Fig. 2
Fig. 2
Mobilogram analysis of the same dataset reported in Fig. 1. Panels A and B: DT versus m/z mobilograms of lesioned (A) and control (B) striatal tissue. Panel C fusion map obtained by overlapping control (yellow to red) and lesion (blue to violet) tissue mobilograms. A well-defined family of signals (m/z = 1000–1100) is highlighted in violet (elevated in lesioned tissue). In Panel B, the corresponding signals are delimited by a white polygon. Panel D differential LC-MS chromatogram showing 5 peaks unequivocally elevated in lesioned striatum. Panel E differential mass spectrum showing the corresponding upregulated m/z values
Fig. 3
Fig. 3
Panel A The extracted ion currents of the 5 signals described in Fig. 2 magnified 100 folds to become visible when compared to the corresponding 50–1200 m/z total ion current (upper trace). Panel B representative mass spectrum of molecule 5 (1042.82 m/z, ESI+). The corresponding peak is magnified tenfolds. Panel C overlapped extracted ion traces of fragment ion m/z = 310.31 from control (black trace) and lesioned hemisphere (red trace). Panel D overlapped extracted ion traces of fragments m/z = 310.31 (red) and a fragment ion of sphingoid base (m/z = 246.26 d18:1; black trace)
Fig. 4
Fig. 4
Fatty acyl chain composition of the observed NAPEs
Fig. 5
Fig. 5
Tandem mass spectra analyses of brain-derived NAPE (18:0/22:6/N18:0) under ESI+ (Panel A) and ESI (Panel B) conditions
Fig. 6
Fig. 6
NAPE levels in control (empty bar) and lesioned (red bar) mouse striatum. ***P < 0.01, 2 tailed t test, N = 10 per group

References

    1. Armirotti A, Basit A, Realini N, Caltagirone C, Bossu P, Spalletta G, Piomelli D. Sample preparation and orthogonal chromatography for broad polarity range plasma metabolomics: Application to human subjects with neurodegenerative dementia. Analytical Biochemistry. 2014;455:48–54. doi: 10.1016/j.ab.2014.03.019. - DOI - PubMed
    1. Astarita G, Ahmed F, Piomelli D. Identification of biosynthetic precursors for the endocannabinoid anandamide in the rat brain. Journal of Lipid Research. 2008;49:48–57. doi: 10.1194/jlr.M700354-JLR200. - DOI - PubMed
    1. Astarita G, Piomelli D. Towards a whole-body systems [multi-organ] lipidomics in Alzheimer’s disease. Prostaglandins Leukotrienes and Essential Fatty Acids. 2011;85:197–203. doi: 10.1016/j.plefa.2011.04.021. - DOI - PMC - PubMed
    1. Baker PR, Armando AM, Campbell JL, Quehenberger O, Dennis EA. Three-dimensional enhanced lipidomics analysis combining UPLC, differential ion mobility spectrometry, and mass spectrometric separation strategies. Journal of Lipid Research. 2014;55:2432–2442. doi: 10.1194/jlr.D051581. - DOI - PMC - PubMed
    1. Basit A, Piomelli D, Armirotti A. Rapid evaluation of 25 key sphingolipids and phosphosphingolipids in human plasma by LC-MS/MS. Analytical and Bioanalytical Chemistry. 2015;407:5189–5198. doi: 10.1007/s00216-015-8585-6. - DOI - PMC - PubMed