

Seasonal Dynamics of Phlebotomine Sand Fly Species Proven Vectors of Mediterranean Leishmaniasis Caused by Leishmania infantum
- PMID: 26900688
- PMCID: PMC4762948
- DOI: 10.1371/journal.pntd.0004458
Seasonal Dynamics of Phlebotomine Sand Fly Species Proven Vectors of Mediterranean Leishmaniasis Caused by Leishmania infantum
Abstract
Background: The recent geographical expansion of phlebotomine vectors of Leishmania infantum in the Mediterranean subregion has been attributed to ongoing climate changes. At these latitudes, the activity of sand flies is typically seasonal; because seasonal phenomena are also sensitive to general variations in climate, current phenological data sets can provide a baseline for continuing investigations on sand fly population dynamics that may impact on future scenarios of leishmaniasis transmission. With this aim, in 2011-2013 a consortium of partners from eight Mediterranean countries carried out entomological investigations in sites where L. infantum transmission was recently reported.
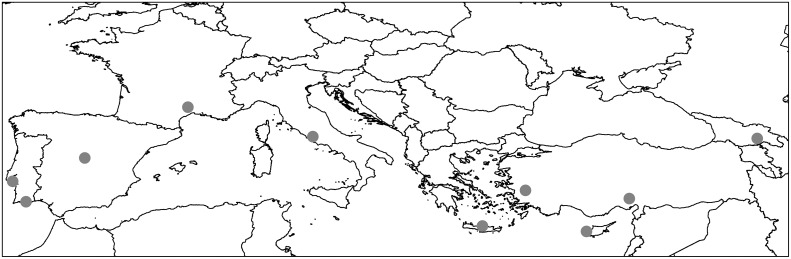
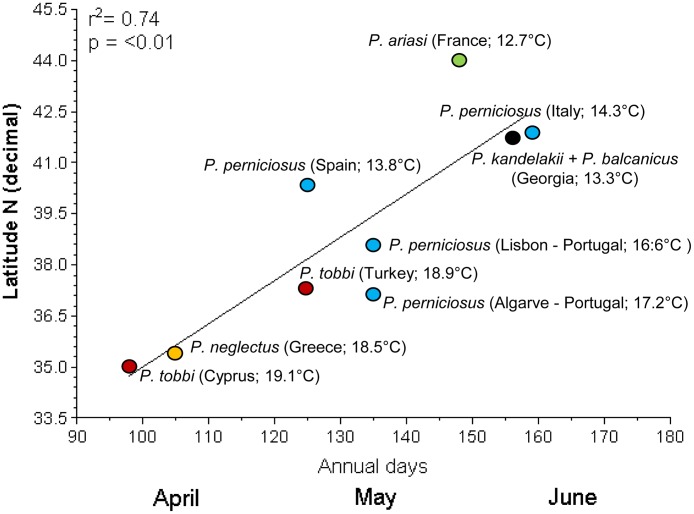
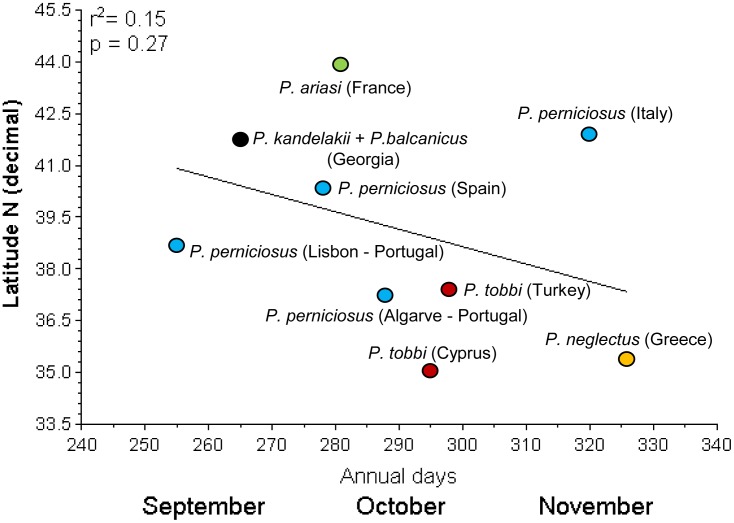
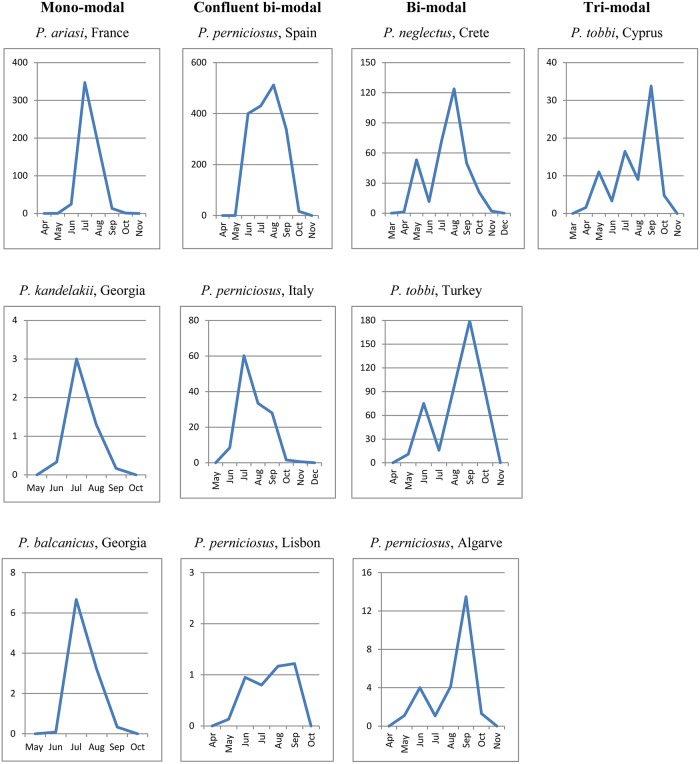
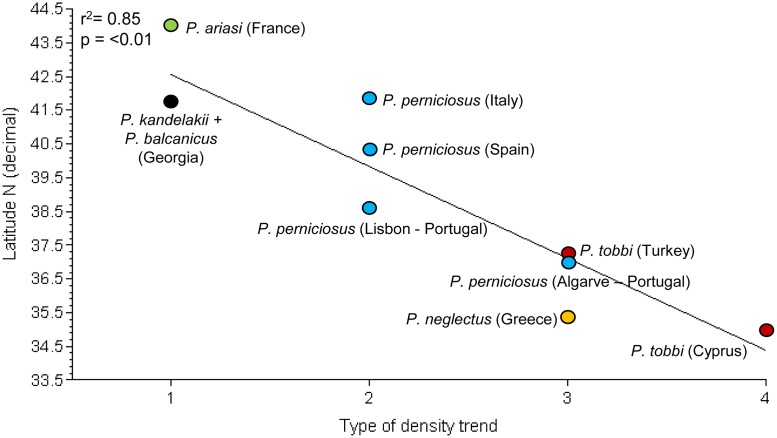
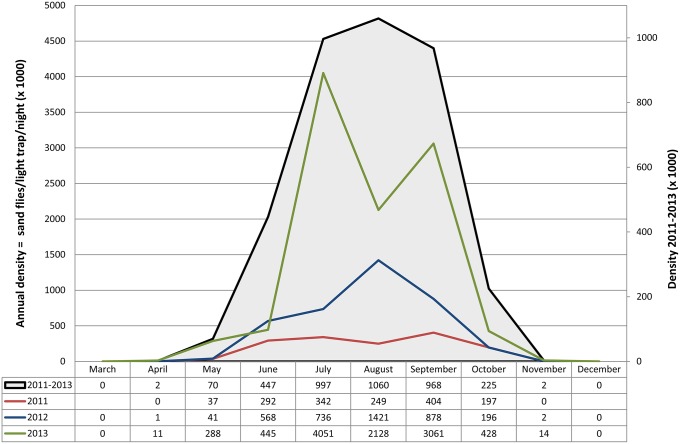
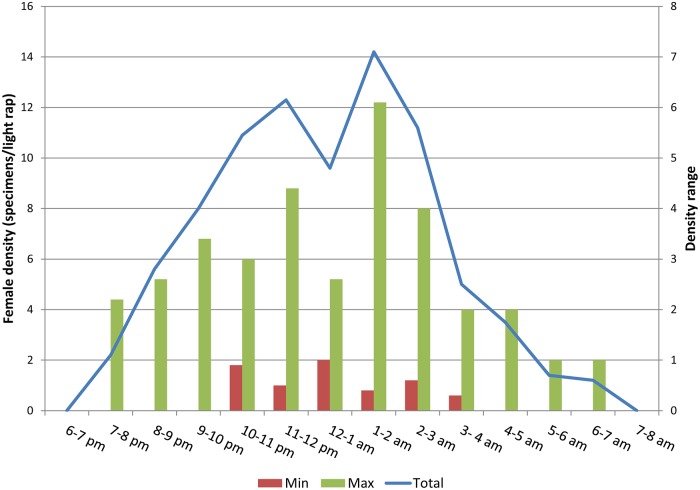
Methods/principal findings: A common protocol for sand fly collection included monthly captures by CDC light traps, complemented by sticky traps in most of the sites. Collections were replicated for more than one season in order to reduce the effects of local weather events. In each site, the trapping effort was left unchanged throughout the survey to legitimate inter-seasonal comparisons. Data from 99,000 collected specimens were analyzed, resulting in the description of seasonal dynamics of 56,000 sand flies belonging to L. infantum vector species throughout a wide geographical area, namely P. perniciosus (Portugal, Spain and Italy), P. ariasi (France), P. neglectus (Greece), P. tobbi (Cyprus and Turkey), P. balcanicus and P. kandelakii (Georgia). Time of sand fly appearance/disappearance in collections differed between sites, and seasonal densities showed variations in each site. Significant correlations were found between latitude/mean annual temperature of sites and i) the first month of sand fly appearance, that ranged from early April to the first half of June; ii) the type of density trend, varying from a single peak in July/August to multiple peaks increasing in magnitude from May through September. A 3-modal trend, recorded for P. tobbi in Cyprus, represents a novel finding for a L. infantum vector. Adults ended the activity starting from mid September through November, without significant correlation with latitude/mean annual temperature of sites. The period of potential exposure to L.infantum in the Mediterranean subregion, as inferred by adult densities calculated from 3 years, 37 sites and 6 competent vector species, was associated to a regular bell-shaped density curve having a wide peak center encompassing the July-September period, and falling between early May to late October for more than 99% of values. Apparently no risk for leishmaniasis transmission took place from December through March in the years considered. We found a common pattern of nocturnal females activity, whose density peaked between 11 pm and 2 am.
Conclusions: Despite annual variations, multiple collections performed over consecutive years provided homogeneous patterns of the potential behavior of leishmaniasis vectors in selected sites, which we propose may represent sentinel areas for future monitoring. In the investigated years, higher potential risk for L. infantum transmission in the Mediterranean was identified in the June-October period (97% relative vector density), however such risk was not equally distributed throughout the region, since density waves of adults occurred earlier and were more frequent in southern territories.
Conflict of interest statement
The authors have declared that no competing interests exist.
Figures

References
-
- Killick-Kendrick R. The biology and control of Phlebotomine sand flies. Clin Dermatol 1999; 17: 279–289 - PubMed
-
- Young DG, Duncan MA. Guide to the identification and geographic distribution of Lutzomyia sandflies in Mexico, the West Indies, Central and South America (Diptera: Psychodidae). Mem Am Entomol Inst 1994; 54: 1–881.
-
- World Health Organization. Control of the leishmaniasis. Report of a Meeting of the WHO Expert Committee on the Control of Leishmaniases, 22–26 March 2010. Geneva: WHO Technical Report Series 949
Publication types
MeSH terms
LinkOut - more resources
Full Text Sources
Other Literature Sources
Medical
Molecular Biology Databases
Miscellaneous
