

Infant birth weight and third trimester maternal plasma markers of vascular integrity: the MIREC study
- PMID: 26900787
- PMCID: PMC4841026
- DOI: 10.3109/1354750X.2015.1134663
Infant birth weight and third trimester maternal plasma markers of vascular integrity: the MIREC study
Abstract
Background: There is paucity of information on mechanisms constituting adverse birth outcomes. We assessed here the relationship between vascular integrity and adverse birth effects.
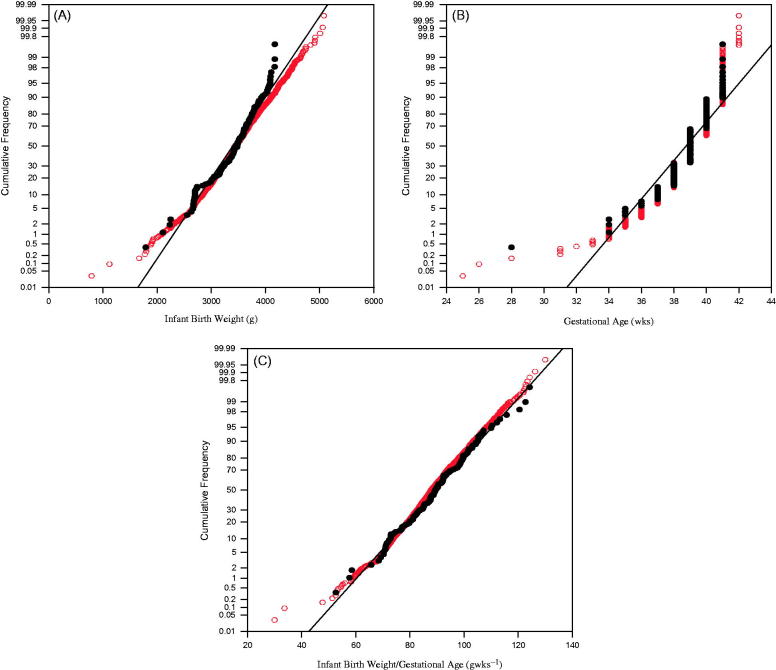
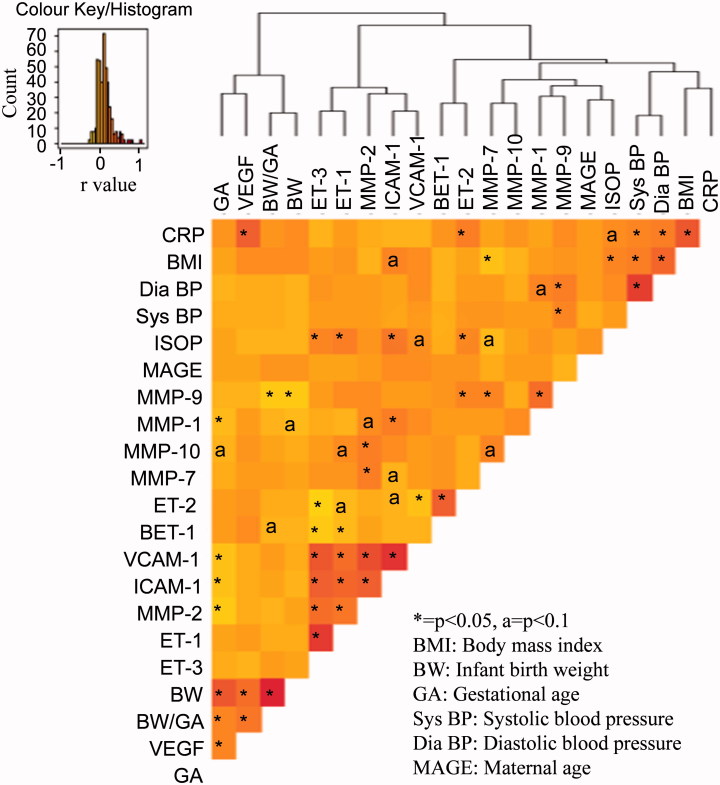
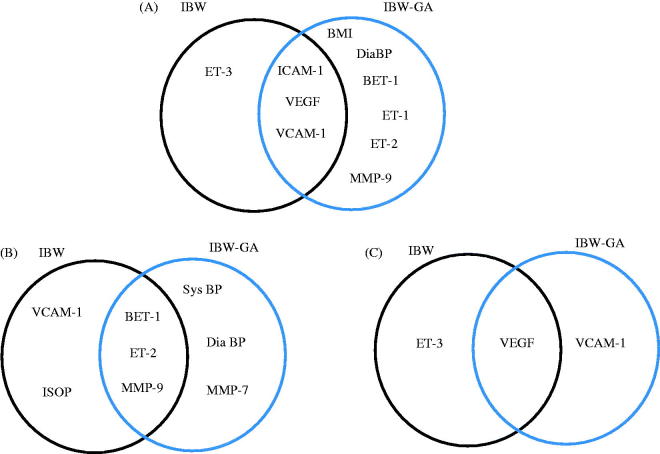
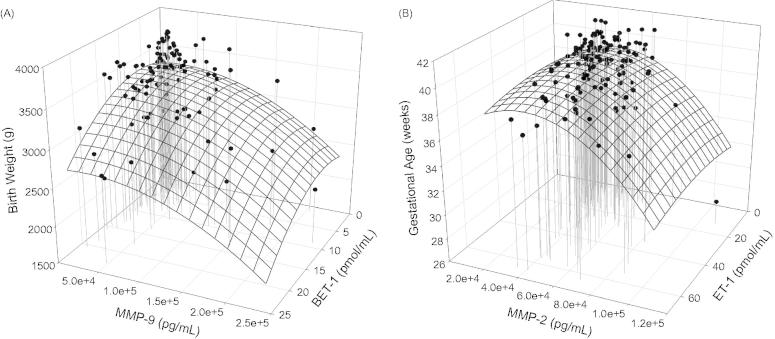
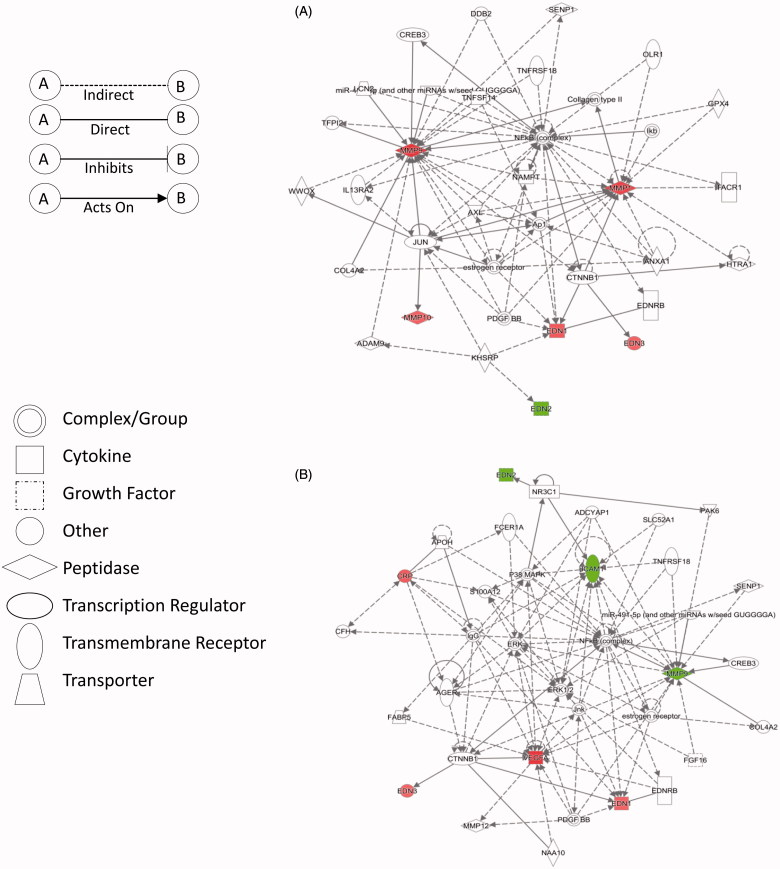
Methods and results: Third trimester maternal plasma (n = 144) from the Maternal-Infant Research on Environmental Chemicals Study (MIREC) was analysed for vascular, inflammatory and oxidative stress markers by HPLC-fluorescence, protein array and EIA method. Analysis of the <25th and >75th percentile birth weight subgroups revealed markers associated with birth weight (ETs, MMP-9, VEGF, and 8-isoPGF-2α) and gestational age (ET-1, MMP-2, and VEGF).
Conclusions: Mechanistic insights into adverse birth outcome pathways can be achieved by integrating information on multiple biomarkers, physiology using systems biology approach.
Keywords: Gestational age; infant birth weight; maternal plasma biomarkers; oxidative stress; vascular function.
Figures
References
-
- Abu-Saad K, Fraser D. Maternal nutrition and birth outcomes. Epidemiol Rev. 2010;32:5–25. - PubMed
-
- Akaike H. A new look at the statistical model identification. IEEE Trans Autom Control. 1974;19:716–23.
-
- Alsuwaida A, Mousa D, Al-Harbi A, et al. Impact of early chronic kidney disease on maternal and fetal outcomes of pregnancy. J Matern Fetal Neonatal Med. 2011;24:1432–6. - PubMed
-
- Arbuckle TE, Fraser WD, Fisher M, et al. Cohort profile: the maternal-infant research on environmental chemicals research platform. Paediatr Perinat Epidemiol. 2013;27:415–25. - PubMed
-
- Arslan M, Yazici G, Erdem A, et al. Endothelin 1 and leptin in the pathophysiology of intrauterine growth restriction. Int J Gynaecol Obstet. 2004;84:120–6. - PubMed
Publication types
MeSH terms
Substances
Grants and funding
LinkOut - more resources
Full Text Sources
Other Literature Sources
Medical
Miscellaneous