. 2016 Apr;17(4):379-86.
doi: 10.1038/ni.3386. Epub 2016 Feb 22.

Control of T cell antigen reactivity via programmed TCR downregulation

Affiliations

Control of T cell antigen reactivity via programmed TCR downregulation

Alena M Gallegos et al. Nat Immunol. 2016 Apr.

Abstract

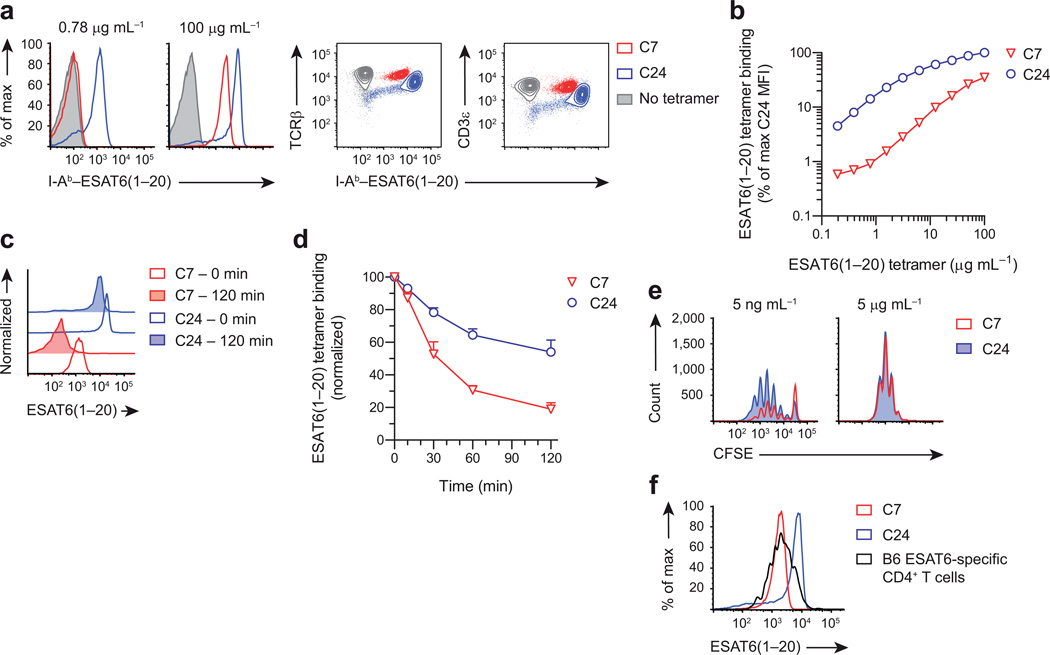
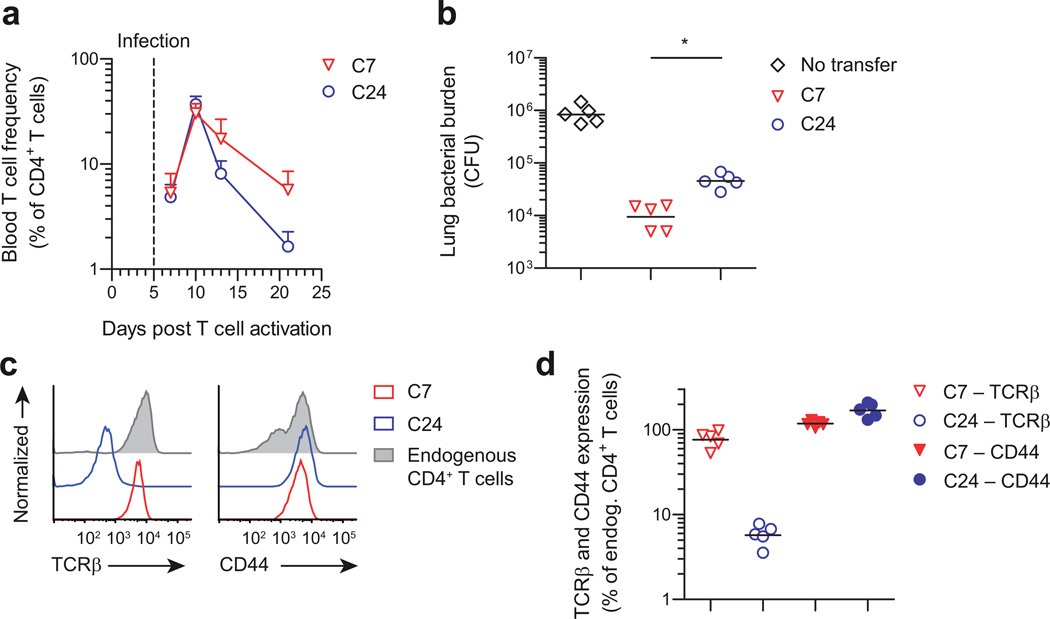
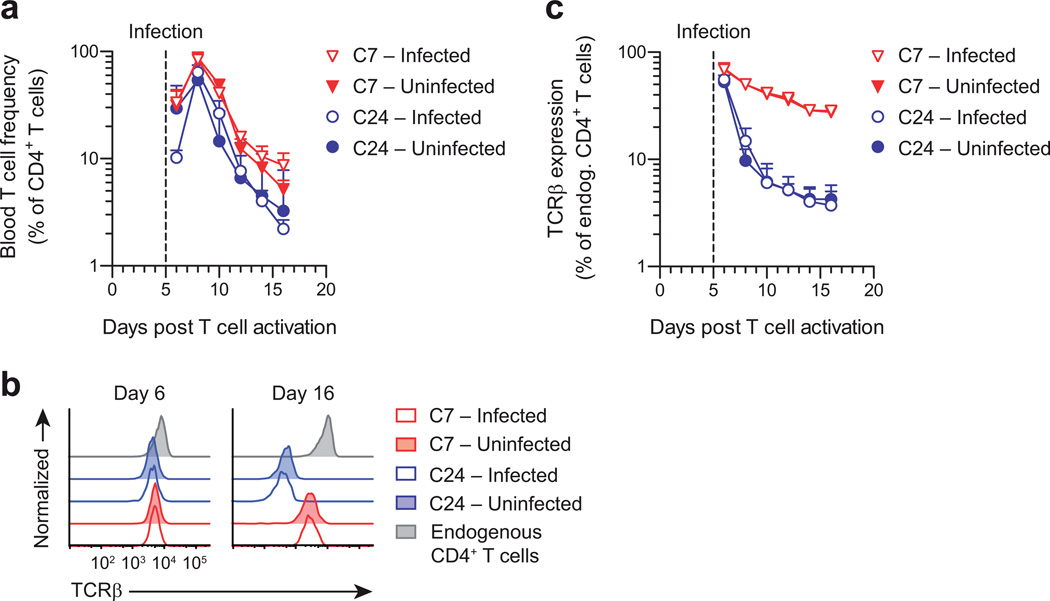
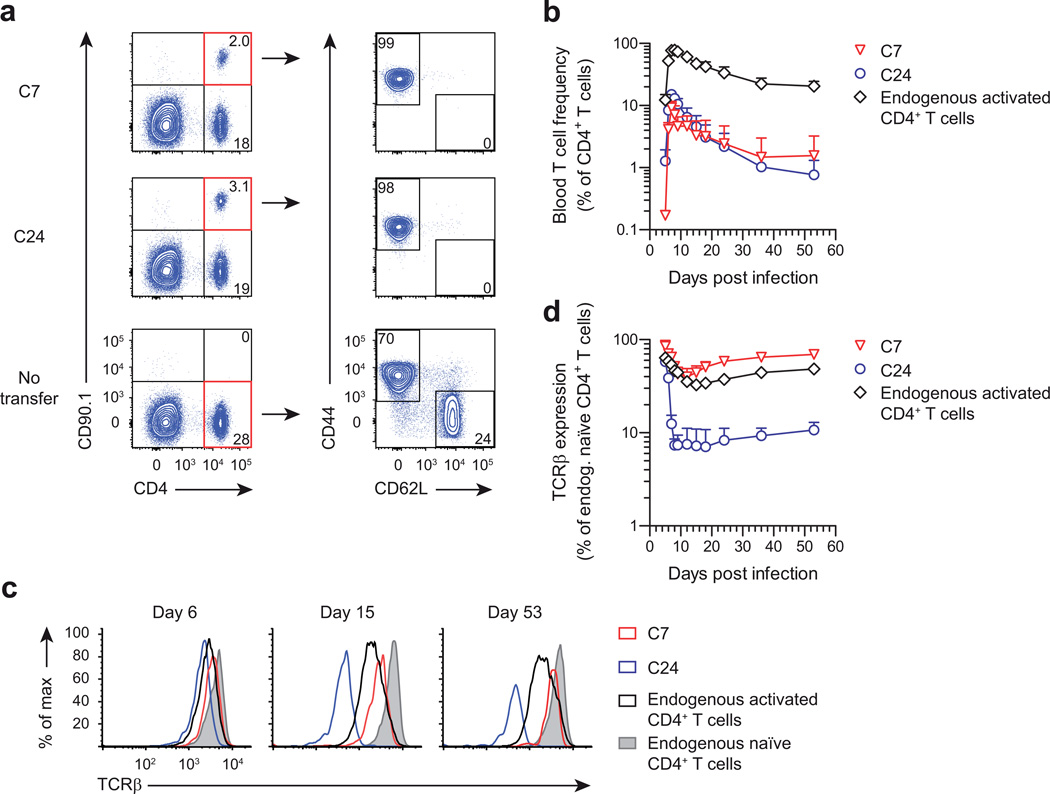
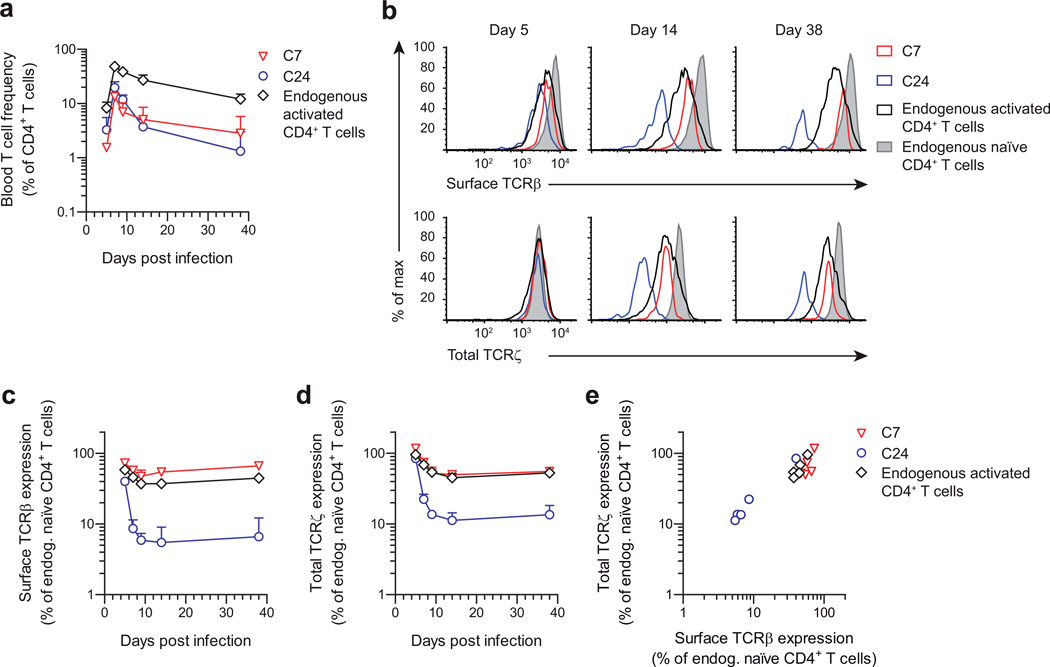
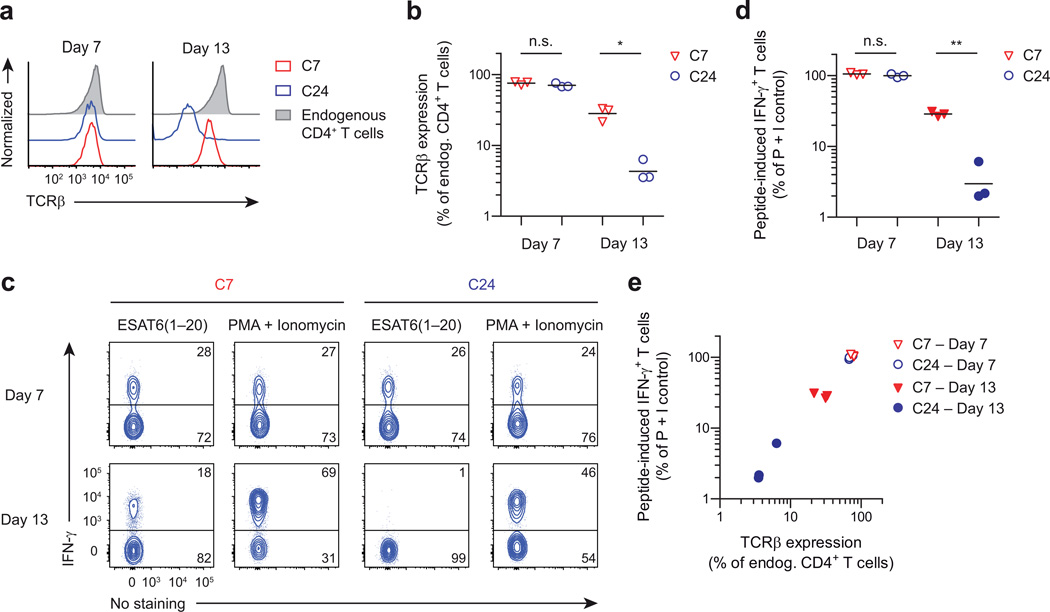
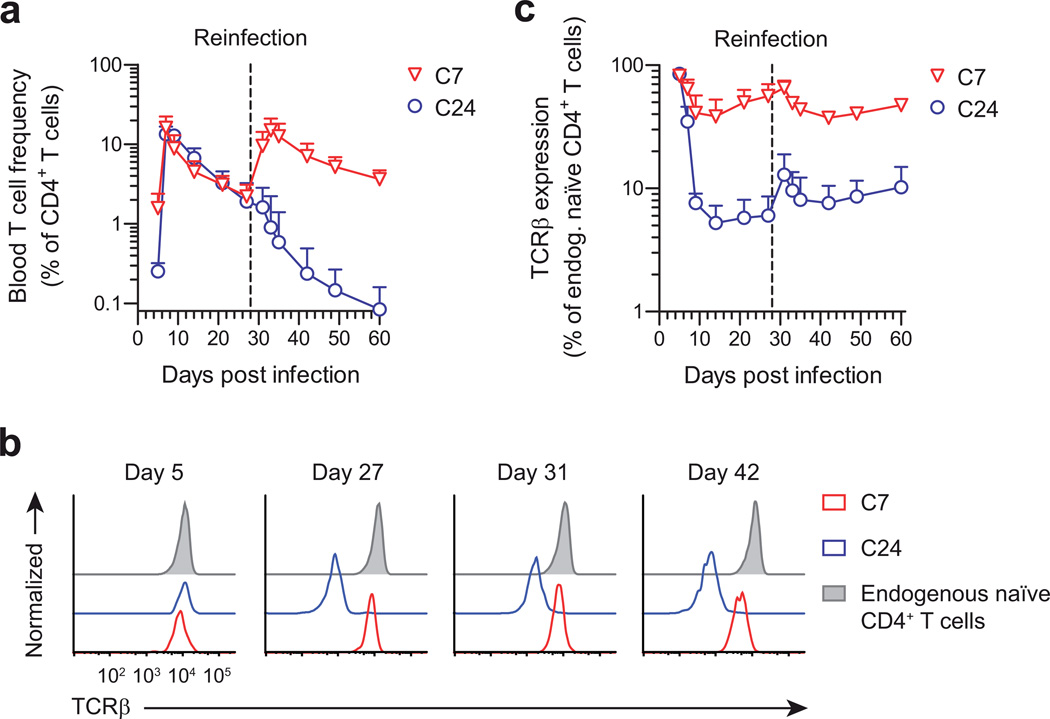
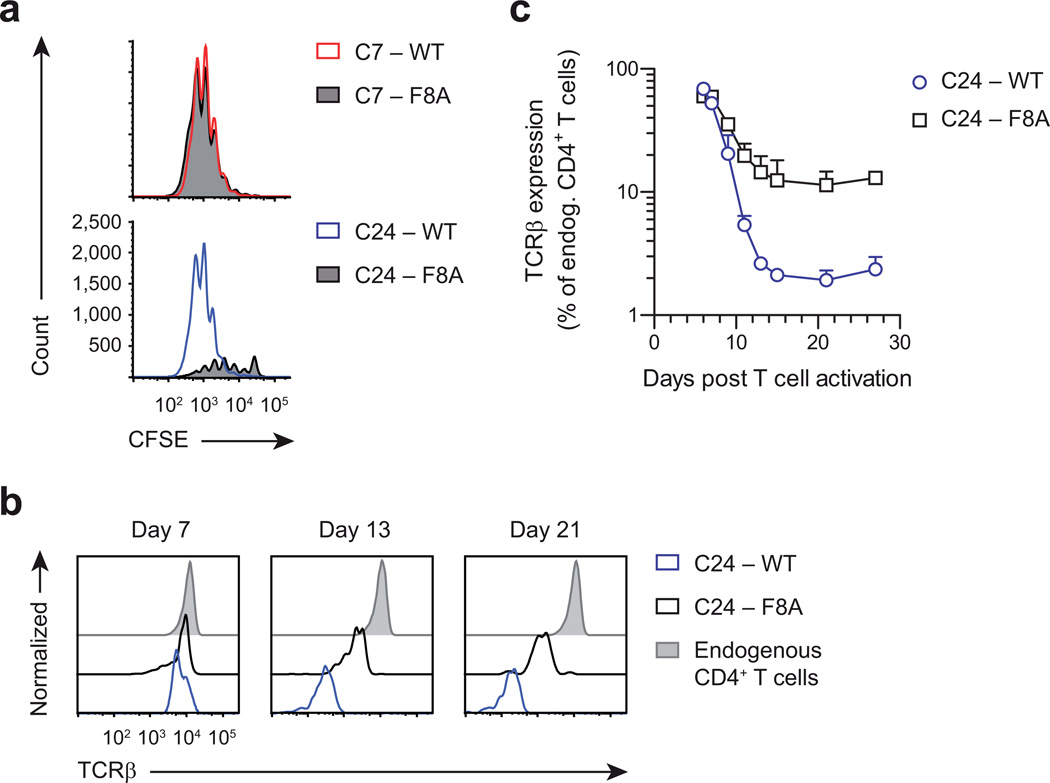
The T cell antigen receptor (TCR) is unique in that its affinity for ligand is unknown before encounter and can vary by orders of magnitude. How the immune system regulates individual T cells that display very different reactivity to antigen remains unclear. Here we found that activated CD4(+) T cells, at the peak of clonal expansion, persistently downregulated their TCR expression in proportion to the strength of the initial antigen recognition. This programmed response increased the threshold for cytokine production and recall proliferation in a clone-specific manner and ultimately excluded clones with the highest antigen reactivity. Thus, programmed downregulation of TCR expression represents a negative feedback mechanism for constraining T cell effector function with a suitable time delay to thereby allow pathogen control while avoiding excess inflammatory damage.


Figures

Figure 1
Figure 1
C7 and C24 are TCR transgenic CD4+ T cells with intermediate and very high avidity for ESAT6(1–20). (a) Flow cytometry showing I-Ab–ESAT6(1–20) tetramer binding of naïve C7 and C24 T cells stained with different tetramer concentrations. The level of TCRβ and CD3ε expression is shown as a control. (b) Quantification of ESAT6(1–20) tetramer binding as a function of tetramer concentration. Tetramer binding was quantified using the median fluorescence intensity (MFI) and normalized to C24. (c) Flow cytometry showing ESAT6(1–20) tetramer dissociation of naïve C7 and C24 T cells stained with 50 µg mL−1 tetramer. (d) Quantification of ESAT6(1–20) tetramer dissociation as a function of time. (e) Flow cytometry showing CFSE dilution of C7 and C24 T cells activated in vitro with different ESAT6(1–20) peptide concentrations for 4 days. (f) Flow cytometry showing ESAT6(1–20) tetramer binding of C7 and C24 T cells, as well as endogenous CD4+ T cells stained with 50 µg mL−1 tetramer. The latter cells were pulled-down from the lungs of a representative C57BL/6J (B6) mouse, 28 days after infection with M. tuberculosis. Data are from one experiment representative of two independent experiments (mean + s.d. of n = 3 male mice per group (d) or n = 5 male mice per group (f)).
Figure 2
Figure 2
Differential capacity of C7 and C24 TH1 cells to control M. tuberculosis infection. (a) Blood frequency of mice that received 5 × 10⁶ CD90.1+ C7 or C24 TH1 cells, which had been activated in vitro for 4 days, following which the mice were infected with M. tuberculosis (b) Lung bacterial burden of T cell recipients described in a, 16 days after infection. ‘No transfer’ mice did not receive any T cells. Horizontal bars depict geometric mean. (c,d) Flow cytometry showing TCRβ and CD44 expression of lung C7 and C24 TH1 cells from the recipient mice described in b. Individual flow plots are shown in c and aggregate data are shown in d. Endogenous CD4+ T cells were identified as CD90.1 CD4+ T cells. Antibody binding was quantified using the MFI and normalized to the signal obtained for endogenous CD4+ T cells. Horizontal bars depict geometric mean. * P < 0.001 (unpaired two-tailed Student’s t test). Data are from one experiment representative of three independent experiments (mean + s.d. of n = 5 female mice per group (a)).
Figure 3
Figure 3
C7 and C24 TH1 cells undergo graded TCR downregulation that is programmed during initial activation. (a) Blood frequency of mice that received 106 CD90.1+ C7 or C24 TH1 cells, which had been activated in vitro for 3 days, following which the mice were either infected with M. tuberculosis, or left uninfected. (b,c) Flow cytometry showing TCRβ expression kinetics of blood C7 and C24 TH1 cells from the recipient mice described in a. Individual flow plots are shown in b and aggregate data are shown in c. Endogenous CD4+ T cells were identified as CD90.1 CD4+ T cells. Note that in the blood, C7 T cells appear to display greater TCR downregulation compared to in the lung (as shown in Fig. 2d). Data are from one experiment representative of two independent experiments (mean + s.d. of n = 3 male mice per group (a,c)).
Figure 4
Figure 4
Programmed TCR downregulation is a general feature of activated CD4+ T cells. (a) Flow cytometry showing blood frequency of mice that received 104 naïve CD90.1+ C7 or C24 CD4+ T cells, or did not receive any cells (no transfer), and were infected with recombinant L. monocytogenes-ESAT6. Blood samples were analyzed on day 7 post infection. Gating on CD90.1+ C7 or C24 CD4+ T cells revealed that these cells uniformly expressed an activated phenotype (CD44hi CD62L). In contrast, gating on CD90.1 endogenous CD4+ T cells in ‘no transfer’ recipients revealed two subpopulations, with cells expressing either an activated or a naïve (CD44lo CD62L+) phenotype. Numbers depict the percentage of gated cells. (b) Blood frequency of C7 and C24 CD4+ T cells, as well as endogenous activated CD4+ T cells from the recipient mice described in a. Endogenous activated CD4+ T cells were defined as CD44hi CD62L CD4+ T cells in ‘no transfer’ recipients. (c,d) Flow cytometry showing TCRβ expression kinetics of blood C7 and C24 CD4+ T cells, as well as endogenous activated and naïve CD4+ T cells from the recipient mice described in a. Individual flow plots are shown in c and aggregate data are shown in d. Endogenous naïve CD4+ T cells were defined as CD44lo CD62L+ CD4+ T cells in ‘no transfer’ recipients. Data are from one experiment representative of two independent experiments (mean + s.d. of n = 5 male mice per group (b,d)).
Figure 5
Figure 5
Programmed TCR downregulation is associated with TCRζ degradation. (a) Blood frequency of mice that received 104 naïve CD90.1+ C7 or C24 CD4+ T cells, or did not receive any cells (no transfer), and were infected with recombinant L. monocytogenes-ESAT6. Endogenous activated CD4+ T cells were defined as CD44hi CD62L CD4+ T cells in ‘no transfer’ recipients. (b–d) Flow cytometry showing surface TCRβ and total TCRζ expression kinetics of blood C7 and C24 CD4+ T cells, as well as endogenous activated and naïve CD4+ T cells from the recipient mice described in a. Individual flow plots are shown in b and aggregate data are shown in c and d. Endogenous naive CD4+ T cells were defined as CD44lo CD62L+ CD4+ T cells in ‘no transfer’ recipients. (e) Pearson correlation of surface TCRβ and total TCRζ expression of C7 and C24 CD4+ T cells, as well as endogenous activated CD4+ T cells (r = 0.86; P < 0.001). Data are from one experiment representative of two independent experiments (mean + s.d. of n = 5 male mice per group (a,c,d) or mean of n = 5 per group (e)).
Figure 6
Figure 6
Programmed TCR downregulation controls CD4+ T cell cytokine production. (a,b) Flow cytometry showing splenocyte TCRβ expression of mice that received 106 CD90.1+ C7 or C24 TH1 cells, which had been activated in vitro for 4 days. Individual flow plots are shown in a and aggregate data are shown in b. Endogenous CD4+ T cells were identified as CD90.1 CD4+ T cells. Horizontal bars depict geometric mean. (c,d) Flow cytometry showing IFN-γ production of splenic C7 and C24 TH1 cells from the recipient mice described in a. Cells were restimulated with either ESAT6(1–20) peptide or PMA + Ionomycin to determine both the TCR-dependent and TCR-independent capacity for cytokine production. Individual flow plots are shown in c and aggregate data are shown in d. Data are expressed as the percentage of peptide-induced IFN-γ+ T cells normalized to the percentage of PMA + Ionomycin-induced IFN-γ+ T cells. Horizontal bars depict geometric mean. (e) Pearson correlation of TCRβ expression and TCR-dependent IFN-γ production of C7 and C24 TH1 cells (r = 0.98; P < 0.001). n.s., not significant. * P = 0.003 and ** P < 0.001 (unpaired two-tailed Student’s t test). Data are from one experiment representative of two independent experiments (mean of n = 3 male mice per group (e)).
Figure 7
Figure 7
Programmed TCR downregulation controls CD4+ T cell recall proliferation. (a) Blood frequency of mice that received 104 naïve CD90.1+ C7 or C24 CD4+ T cells, and were infected with recombinant L. monocytogenes-ESAT6 on day 0 and reinfected with the same bacteria on day 28. (b,c) Flow cytometry showing TCRβ expression kinetics of blood C7 and C24 CD4+ T cells from the recipient mice described in a. Individual flow plots are shown in b and aggregate data are shown in c. Endogenous naïve CD4+ T cells were identified as CD44lo CD62L+ CD4+ T cells. Data are from one experiment representative of three independent experiments (mean + s.d. of n = 5 male mice per group (a,c)).
Figure 8
Figure 8
Programmed TCR downregulation is driven by the strength of initial antigen recognition. (a) Flow cytometry showing CFSE dilution of C7 and C24 T cells activated with 5 µg mL−1 ESAT6(1–20) wild-type (WT) or F8A peptide for 4 days. (b,c) Flow cytometry showing blood TCRβ expression of mice that received 106 CD90.1+ C24 TH1 cells, which had been activated in vitro with either ESAT6(1–20) WT or F8A peptide for 4 days. Individual flow plots are shown in b and aggregate data are shown in c. Endogenous CD4+ T cells were identified as CD90.1 CD4+ T cells. Data are from one experiment representative of two independent experiments (mean + s.d. of n = 5 male mice per group (c)).

Similar articles

Cited by

References

    1. Nikolich-Zugich J, Slifka MK, Messaoudi I. The many important facets of T-cell repertoire diversity. Nat Rev Immunol. 2004;4:123–132. - PubMed
    1. van Heijst JW, et al. Quantitative assessment of T cell repertoire recovery after hematopoietic stem cell transplantation. Nat Med. 2013;19:372–377. - PMC - PubMed
    1. Busch DH, Pamer EG. T cell affinity maturation by selective expansion during infection. J Exp Med. 1999;189:701–710. - PMC - PubMed
    1. Corse E, Gottschalk RA, Allison JP. Strength of TCR-peptide/MHC interactions and in vivo T cell responses. J Immunol. 2011;186:5039–5045. - PubMed
    1. King CG, et al. T cell affinity regulates asymmetric division, effector cell differentiation, and tissue pathology. Immunity. 2012;37:709–720. - PMC - PubMed

Publication types

MeSH terms

Substances