

Label-free capture of breast cancer cells spiked in buffy coats using carbon nanotube antibody micro-arrays
- PMID: 26901310
- PMCID: PMC5065025
- DOI: 10.1088/0957-4484/27/13/13LT02
Label-free capture of breast cancer cells spiked in buffy coats using carbon nanotube antibody micro-arrays
Abstract
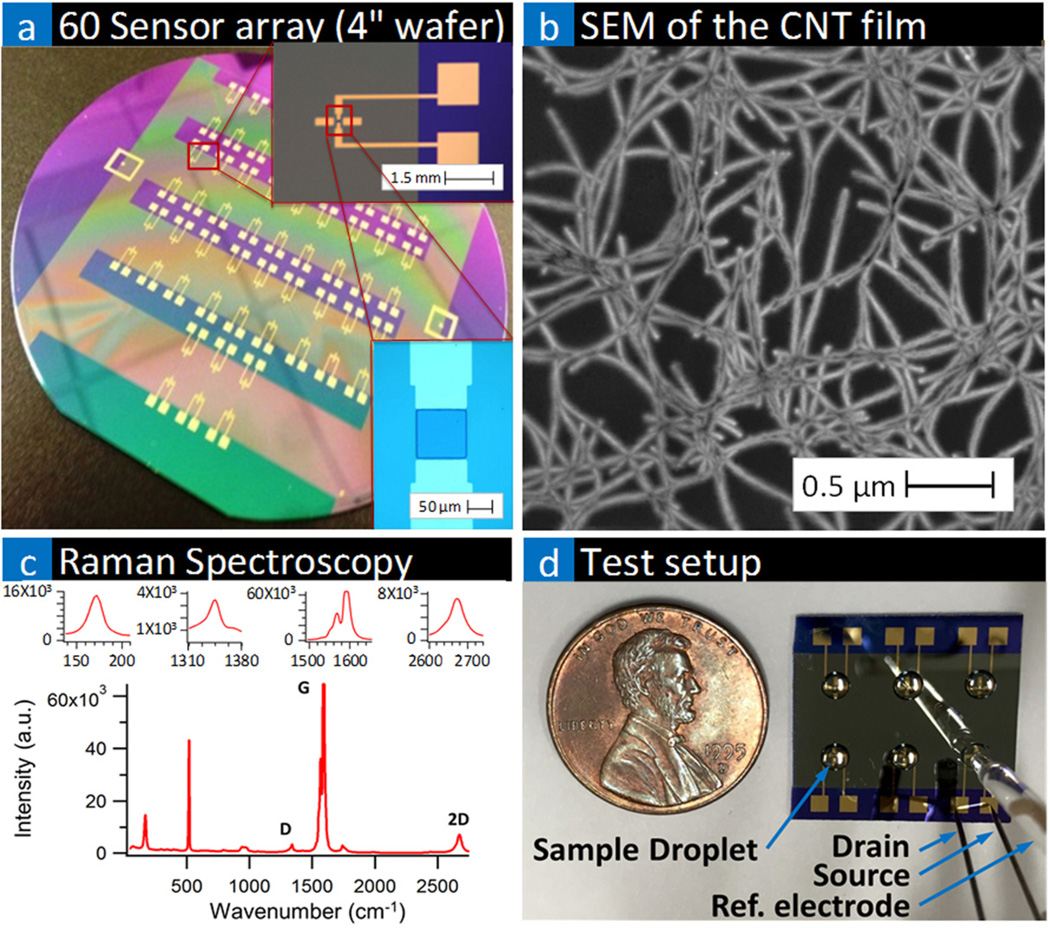
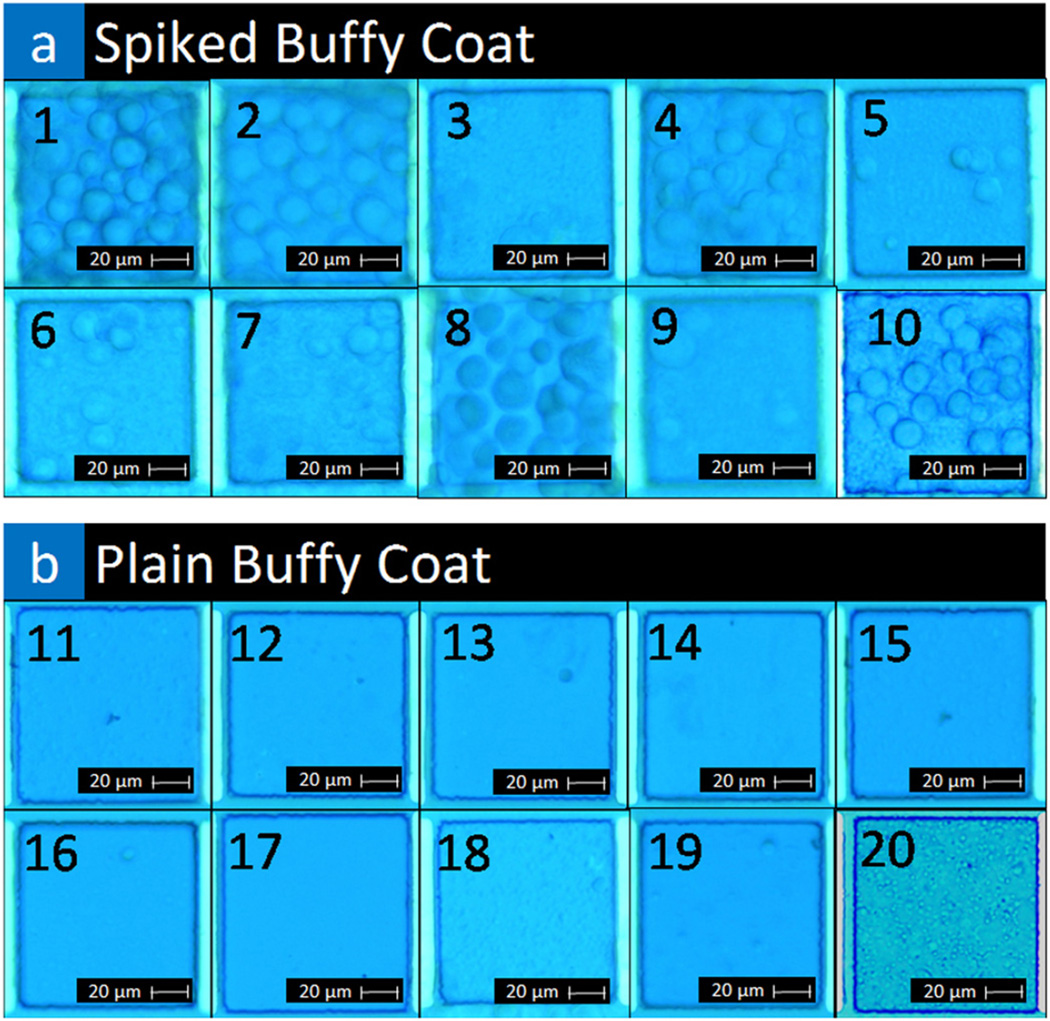
We demonstrate the rapid and label-free capture of breast cancer cells spiked in buffy coats using nanotube-antibody micro-arrays. Single wall carbon nanotube arrays were manufactured using photo-lithography, metal deposition, and etching techniques. Anti-epithelial cell adhesion molecule (EpCAM) antibodies were functionalized to the surface of the nanotube devices using 1-pyrene-butanoic acid succinimidyl ester functionalization method. Following functionalization, plain buffy coat and MCF7 cell spiked buffy coats were adsorbed on to the nanotube device and electrical signatures were recorded for differences in interaction between samples. A statistical classifier for the 'liquid biopsy' was developed to create a predictive model based on dynamic time warping to classify device electrical signals that corresponded to plain (control) or spiked buffy coats (case). In training test, the device electrical signals originating from buffy versus spiked buffy samples were classified with ∼100% sensitivity, ∼91% specificity and ∼96% accuracy. In the blinded test, the signals were classified with ∼91% sensitivity, ∼82% specificity and ∼86% accuracy. A heatmap was generated to visually capture the relationship between electrical signatures and the sample condition. Confocal microscopic analysis of devices that were classified as spiked buffy coats based on their electrical signatures confirmed the presence of cancer cells, their attachment to the device and overexpression of EpCAM receptors. The cell numbers were counted to be ∼1-17 cells per 5 μl per device suggesting single cell sensitivity in spiked buffy coats that is scalable to higher volumes using the micro-arrays.
Figures


Similar articles
-
Ultrasensitive Label-Free Sensing of IL-6 Based on PASE Functionalized Carbon Nanotube Micro-Arrays with RNA-Aptamers as Molecular Recognition Elements.Biosensors (Basel). 2017 Apr 17;7(2):17. doi: 10.3390/bios7020017. Biosensors (Basel). 2017. PMID: 28420169 Free PMC article.
-
Classification of biosensor time series using dynamic time warping: applications in screening cancer cells with characteristic biomarkers.Open Access Med Stat. 2016;2016(6):21-29. doi: 10.2147/OAMS.S104731. Epub 2016 Jun 18. Open Access Med Stat. 2016. PMID: 27942497 Free PMC article.
-
Static micro-array isolation, dynamic time series classification, capture and enumeration of spiked breast cancer cells in blood: the nanotube-CTC chip.Nanotechnology. 2016 Nov 4;27(44):44LT03. doi: 10.1088/0957-4484/27/44/44LT03. Epub 2016 Sep 29. Nanotechnology. 2016. PMID: 27680886 Free PMC article.
-
Liquid biopsy using the nanotube-CTC-chip: capture of invasive CTCs with high purity using preferential adherence in breast cancer patients.Lab Chip. 2019 Jun 7;19(11):1899-1915. doi: 10.1039/c9lc00274j. Epub 2019 May 3. Lab Chip. 2019. PMID: 31049504
-
Employing Raman spectroscopy to qualitatively evaluate the purity of carbon single-wall nanotube materials.J Nanosci Nanotechnol. 2004 Sep;4(7):691-703. doi: 10.1166/jnn.2004.116. J Nanosci Nanotechnol. 2004. PMID: 15570946 Review.
Cited by
-
Ultrasensitive Label-Free Sensing of IL-6 Based on PASE Functionalized Carbon Nanotube Micro-Arrays with RNA-Aptamers as Molecular Recognition Elements.Biosensors (Basel). 2017 Apr 17;7(2):17. doi: 10.3390/bios7020017. Biosensors (Basel). 2017. PMID: 28420169 Free PMC article.
-
Classification of biosensor time series using dynamic time warping: applications in screening cancer cells with characteristic biomarkers.Open Access Med Stat. 2016;2016(6):21-29. doi: 10.2147/OAMS.S104731. Epub 2016 Jun 18. Open Access Med Stat. 2016. PMID: 27942497 Free PMC article.
-
Carbon nanotubes in microfluidic lab-on-a-chip technology: current trends and future perspectives.Microfluid Nanofluidics. 2017 Sep;21(9):151. doi: 10.1007/s10404-017-1989-1. Epub 2017 Sep 5. Microfluid Nanofluidics. 2017. PMID: 30881265 Free PMC article.
-
Static micro-array isolation, dynamic time series classification, capture and enumeration of spiked breast cancer cells in blood: the nanotube-CTC chip.Nanotechnology. 2016 Nov 4;27(44):44LT03. doi: 10.1088/0957-4484/27/44/44LT03. Epub 2016 Sep 29. Nanotechnology. 2016. PMID: 27680886 Free PMC article.
-
Carbon nanotube field-effect transistor (CNT-FET)-based biosensor for rapid detection of SARS-CoV-2 (COVID-19) surface spike protein S1.Bioelectrochemistry. 2022 Feb;143:107982. doi: 10.1016/j.bioelechem.2021.107982. Epub 2021 Oct 15. Bioelectrochemistry. 2022. PMID: 34715586 Free PMC article.
References
-
- Shulze A, Downward J. Navigating gene expression using microarrays-a technology review. Nat. Cell Biol. 2001;3:E190–E195. - PubMed
-
- Dmitriev AA, et al. Genetic and epigenetic analysis of non-small cell lung cancer with NotI-microarrays. Epigenetics. 2012;7:502–513. - PubMed
-
- Flach J, Dicker F, Schnittger S, Schindela S, Kohlmann A, Haferlach T, Kern W, Haferlach C. An accumulation of cytogenetic and molecular genetic events characterizes the progression from MDS to secondary AML: an analysis of 38 paired samples analyzed by cytogenetics, molecular mutation analysis and SNP microarray profiling. Leukemia. 2011;25:713–718. - PubMed
-
- Weidenhammer EM, Kahl BF, Wang L, Wang L, Duhon M, Jackson JA, Slater M, Xu X. Multiplexed, targeted gene expression profiling and genetic analysis on electronic microarrays. Clin. Chem. 2002;48:1873–1882. - PubMed
Publication types
MeSH terms
Substances
Grants and funding
LinkOut - more resources
Full Text Sources
Other Literature Sources
Medical
Miscellaneous