. 2016 Feb 22;11(2):e0138866.
doi: 10.1371/journal.pone.0138866. eCollection 2016.

Predicting Progression from Mild Cognitive Impairment to Alzheimer's Dementia Using Clinical, MRI, and Plasma Biomarkers via Probabilistic Pattern Classification

Affiliations

Predicting Progression from Mild Cognitive Impairment to Alzheimer's Dementia Using Clinical, MRI, and Plasma Biomarkers via Probabilistic Pattern Classification

Igor O Korolev et al. PLoS One. .

Abstract

Background: Individuals with mild cognitive impairment (MCI) have a substantially increased risk of developing dementia due to Alzheimer's disease (AD). In this study, we developed a multivariate prognostic model for predicting MCI-to-dementia progression at the individual patient level.

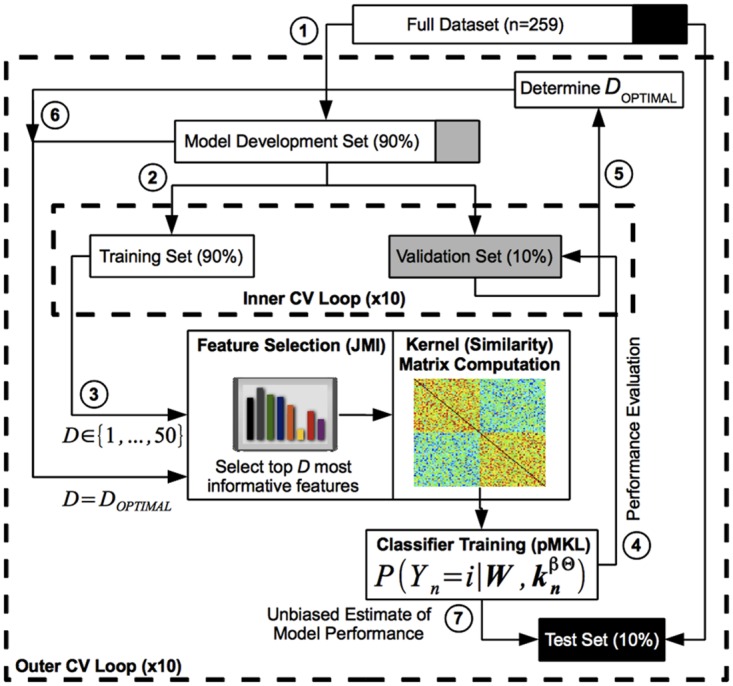
Methods: Using baseline data from 259 MCI patients and a probabilistic, kernel-based pattern classification approach, we trained a classifier to distinguish between patients who progressed to AD-type dementia (n = 139) and those who did not (n = 120) during a three-year follow-up period. More than 750 variables across four data sources were considered as potential predictors of progression. These data sources included risk factors, cognitive and functional assessments, structural magnetic resonance imaging (MRI) data, and plasma proteomic data. Predictive utility was assessed using a rigorous cross-validation framework.

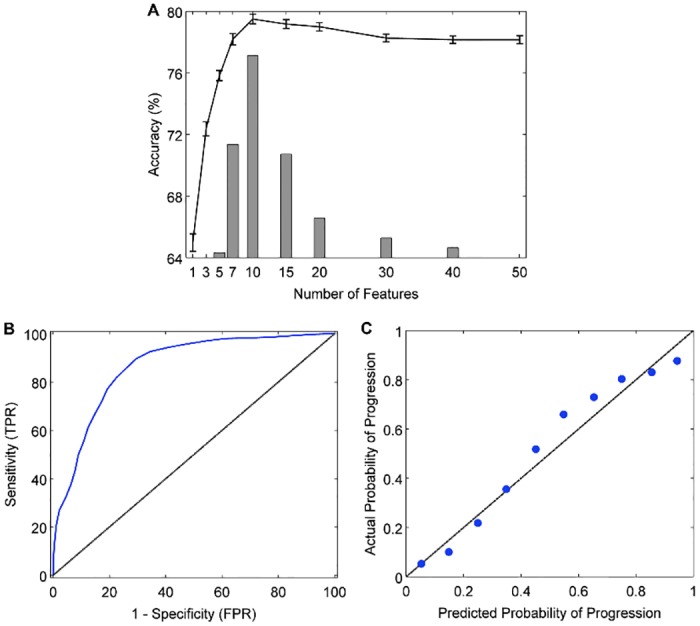
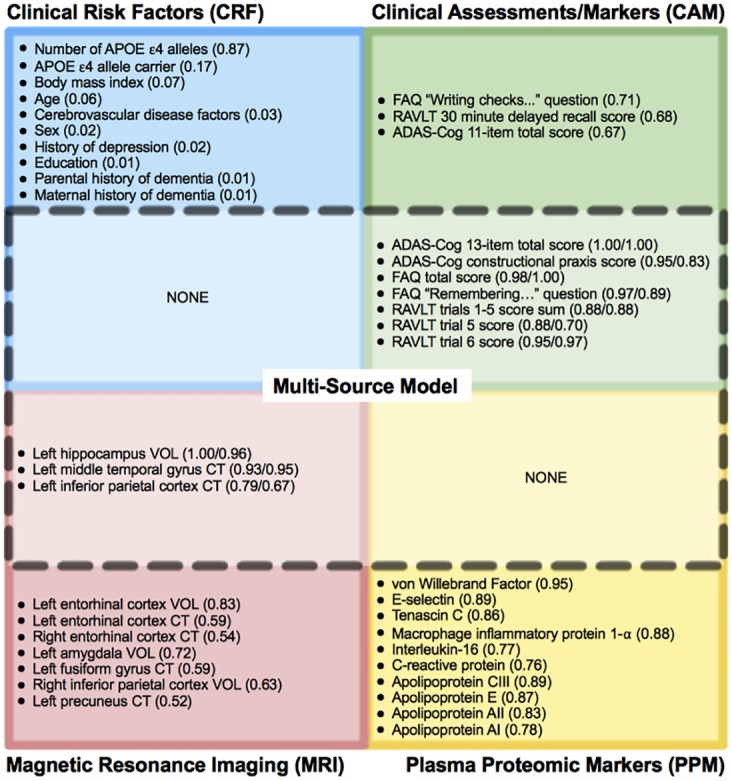
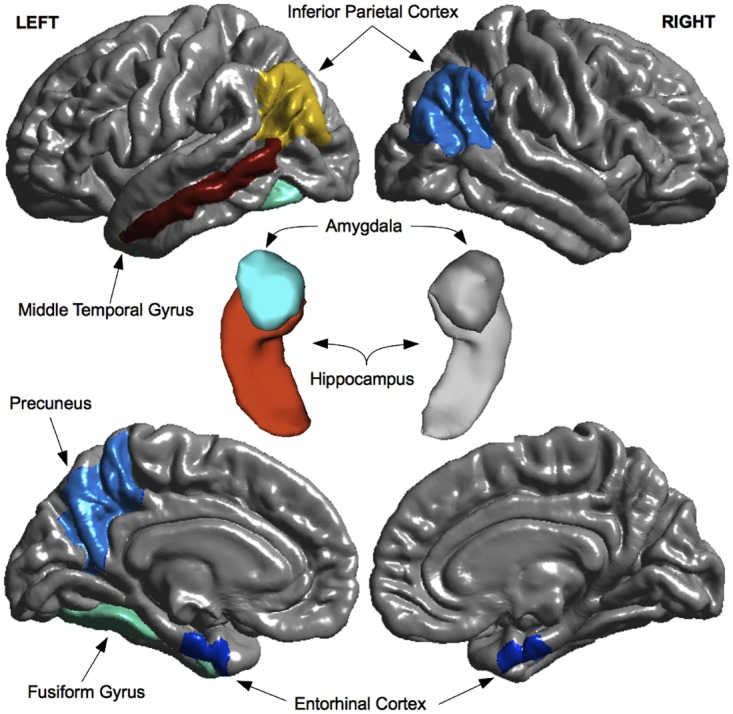
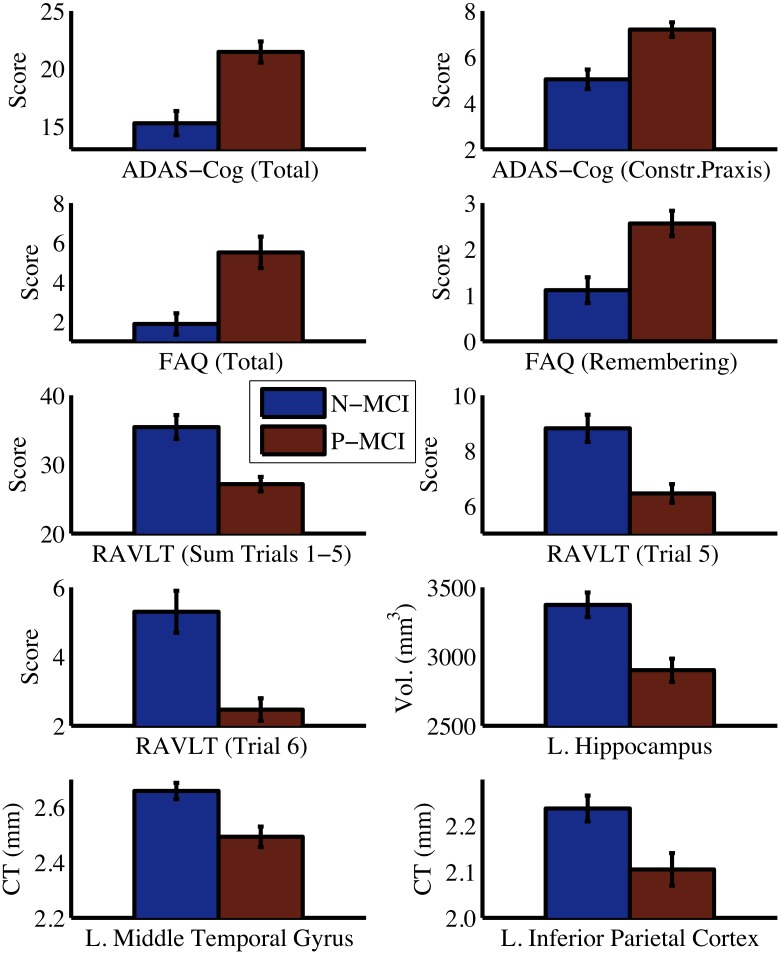
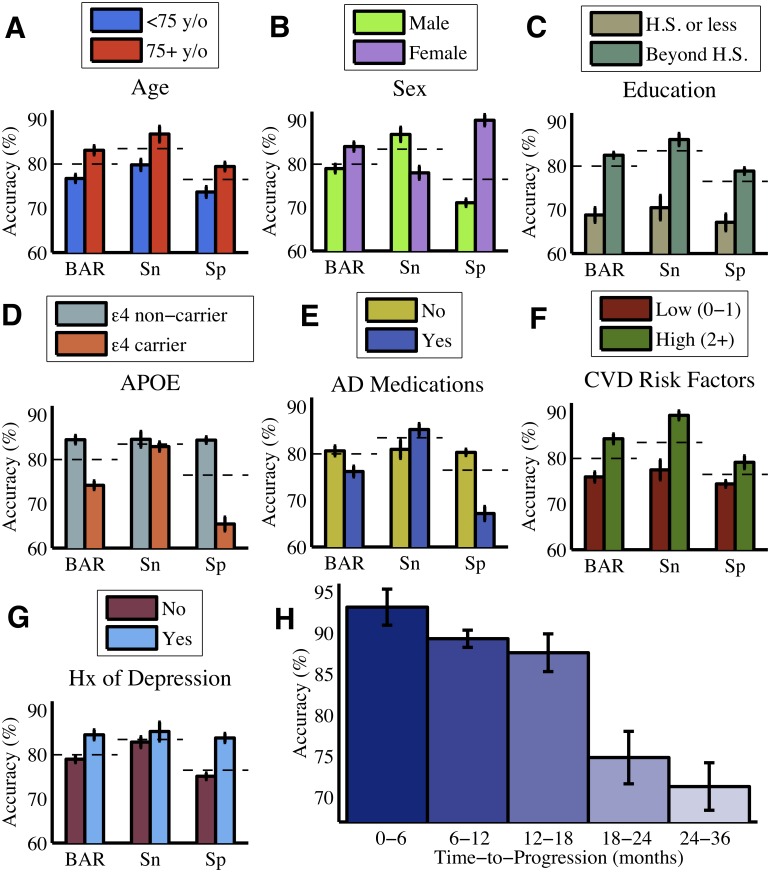
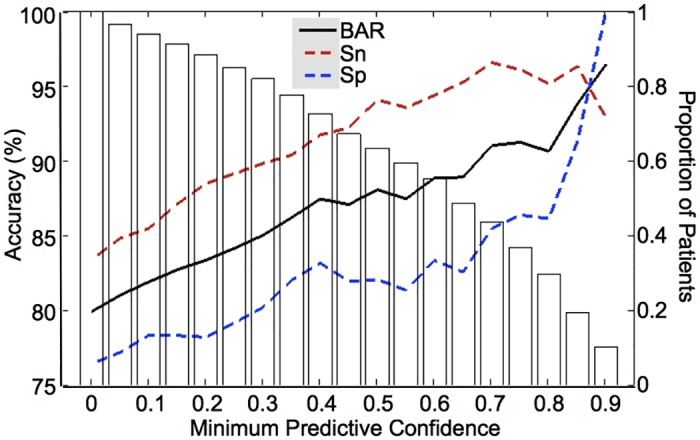
Results: Cognitive and functional markers were most predictive of progression, while plasma proteomic markers had limited predictive utility. The best performing model incorporated a combination of cognitive/functional markers and morphometric MRI measures and predicted progression with 80% accuracy (83% sensitivity, 76% specificity, AUC = 0.87). Predictors of progression included scores on the Alzheimer's Disease Assessment Scale, Rey Auditory Verbal Learning Test, and Functional Activities Questionnaire, as well as volume/cortical thickness of three brain regions (left hippocampus, middle temporal gyrus, and inferior parietal cortex). Calibration analysis revealed that the model is capable of generating probabilistic predictions that reliably reflect the actual risk of progression. Finally, we found that the predictive accuracy of the model varied with patient demographic, genetic, and clinical characteristics and could be further improved by taking into account the confidence of the predictions.

Conclusions: We developed an accurate prognostic model for predicting MCI-to-dementia progression over a three-year period. The model utilizes widely available, cost-effective, non-invasive markers and can be used to improve patient selection in clinical trials and identify high-risk MCI patients for early treatment.


Conflict of interest statement

Competing Interests: The authors have declared that no competing interests exist.

Figures

Fig 1
Fig 1. Nested 10-fold cross-validation (CV) procedure for model development and evaluation.
(1) In the outer CV loop, the dataset was partitioned into the 'Model Development Set' and 'Test Set'. (2) In the inner CV loop, the 'Model Development Set' was further partitioned into the 'Training Set' and 'Validation Set'. (3) Several classifiers were trained using only the 'Training Set' and a varying number (1–50) of the most informative features, as identified with the Joint Mutual Information (JMI) method. (4) These classifiers were evaluated on the 'Validation Set', and (5) the number of features that produced maximal classification accuracy was selected as the optimal number of features (DOPTIMAL). (6) The final model was then constructed by training a classifier using the 'Model Development Set' and the optimal number of JMI-based features, DOPTIMAL. (7) An unbiased estimate of model performance was obtained by evaluating the final model on the held out 'Test Set', which was not used during feature selection, model (parameter) selection, or final model construction. Both the outer and inner CV loops used a 10-fold CV design.
Fig 2
Fig 2. Performance curves for the best performing (MKL-Gaussian) model.
A: The learning curve shows validation accuracy as a function of the number of features in the model (line graph with 95% confidence intervals). Juxtaposed is a histogram showing the frequency with which a given number of features was identified as the optimal (most accurate) number of features across 100 trials of the 10x10 cross-validation experiment (median = 10 ± 3). B: Receiver operating characteristic curve (blue line; AUC = 0.87), showing the trade-off between sensitivity (true positive rate, TPR) and 1 –specificity (false positive rate, FPR). The area under the curve (AUC) measures how well the model discriminates between N-MCI and P-MCI patients. The black diagonal line represents random classifier performance (AUC = 0.5). C: Calibration curve, indicating the degree to which the model's predicted probabilities (risk) of MCI-to-dementia progression agree with the actual probabilities of progression. With a perfectly calibrated model, we expect complete agreement between predicted and actual probabilities (diagonal line).
Fig 3
Fig 3. Top 10 most frequently selected features as baseline predictors of MCI-to-dementia progression.
Features are shown separately for each single-source model: CRF (blue), CAM (green), MRI (red), PPM (yellow). A subset of these features (dashed line) was selected as part of both the single-kernel (CONCAT) and the multiple-kernel (MKL-Gaussian) multi-source models and included only CAM and MRI features. The selection frequency across 100 trials of the 10x10 cross-validation experiment is shown in parentheses as: (#) for single-source model only or (#/#) for both single/multi-source (MKL-Gaussian) models. APOE = apolipoprotein E, ADAS-Cog = Alzheimer's Disease Assessment Scale–Cognitive sub-scale, FAQ = Functional Activities Questionnaire, RAVLT = Rey Auditory Verbal Learning Test, VOL = volume, CT = cortical thickness.
Fig 4
Fig 4. Regional MRI predictors of MCI-to-dementia progression.
Morphometric measures (volumes and cortical thickness) for brain regions shown in both warm and cool colors were selected as predictors in the single-source MRI model. Morphometric measures for a subset of these regions, shown in warm colors (red, orange, yellow), were also selected as predictors in multi-source (CONCAT and MKL-Gaussian) models. Regions of interest are overlaid on top of 3-D model reconstructions of the brain (gray). Top row: lateral view of the cerebral hemispheres. Center: close-up view of the hippocampus-amygdala complex. Bottom row: medial view of the cerebral hemispheres.
Fig 5
Fig 5. Comparison between N-MCI and P-MCI groups on baseline predictor variables.
Error bars are 95% confidence intervals. Significant group differences were present for all predictor variables (all P < 0.001). Vol. = volume, CT = cortical thickness, ADAS-Cog = Alzheimer's Disease Assessment Scale–Cognitive sub-scale, FAQ = Functional Activities Questionnaire, RAVLT = Rey Auditory Verbal Learning Test, L. = Left, Constr. = Constructional
Fig 6
Fig 6. Effect of patient characteristics on classification accuracy.
The classification accuracy of the model (MKL-Gaussian) varied with baseline demographic (A-C), genetic (D), and clinical (E-G) characteristics. Panel E compares MCI patients who were on a regimen of AD medications versus those who were not. Panel F compares patients according to the number of pre-existing conditions in their medical history that are considered to be cerebrovascular disease (CVD) risk factors, including diabetes mellitus, coronary artery disease, hypertension, smoking, hyperlipidemia, and stroke. The classification accuracy of the model varied inversely with time to progression for P-MCI patients (H). The overall accuracy of the model (as found in Table 2) is shown for reference as a dashed line. Error bars represent 95% confidence intervals across cross-validation trials. BAR = Balanced Accuracy Rate, Sn = Sensitivity, Sp = Specificity, y/o = years old, H.S. = high school, Hx = history, APOE = apolipoprotein E, AD = Alzheimer's disease.
Fig 7
Fig 7. Model accuracy as a function of predictive confidence.
Increasing the minimum confidence required to make predictions resulted in improved model accuracy (solid and dashed lines; left y-axis), albeit at the cost of a decreasing proportion of MCI patients for whom "high confidence" predictions could be made (white bars; right y-axis). Predictive confidence was defined as the difference between the predicted probabilities for the N-MCI and P-MCI groups. BAR = Balanced Accuracy Rate, Sn = Sensitivity, Sp = Specificity.

Similar articles

Cited by

References

    1. Barnes DE, Yaffe K. The projected effect of risk factor reduction on Alzheimer’s disease prevalence. Lancet Neurol. 2011;10: 819–828. 10.1016/S1474-4422(11)70072-2 - DOI - PMC - PubMed
    1. Holtzman DM, Morris JC, Goate AM. Alzheimer’s disease: the challenge of the second century. Sci Transl Med. 2011;3: 77sr1 10.1126/scitranslmed.3002369 - DOI - PMC - PubMed
    1. Petersen RC, Roberts RO, Knopman DS, Boeve BF, Geda YE, Ivnik RJ, et al. Mild cognitive impairment: ten years later. Arch Neurol. 2009;66: 1447–1455. 10.1001/archneurol.2009.266 - DOI - PMC - PubMed
    1. Korolev IO. Alzheimer’s Disease: A Clinical and Basic Science Review. Medical Student Research Journal. 2014;4: 24–33.
    1. Manly JJ, Tang M-X, Schupf N, Stern Y, Vonsattel J-PG, Mayeux R. Frequency and course of mild cognitive impairment in a multiethnic community. Ann Neurol. 2008;63: 494–506. 10.1002/ana.21326 - DOI - PMC - PubMed

Publication types