. 2016 Feb 22;12(2):e1005886.
doi: 10.1371/journal.pgen.1005886. eCollection 2016 Feb.

C-terminal Src Kinase Gates Homeostatic Synaptic Plasticity and Regulates Fasciclin II Expression at the Drosophila Neuromuscular Junction

Affiliations

C-terminal Src Kinase Gates Homeostatic Synaptic Plasticity and Regulates Fasciclin II Expression at the Drosophila Neuromuscular Junction

Ashlyn M Spring et al. PLoS Genet. .

Abstract

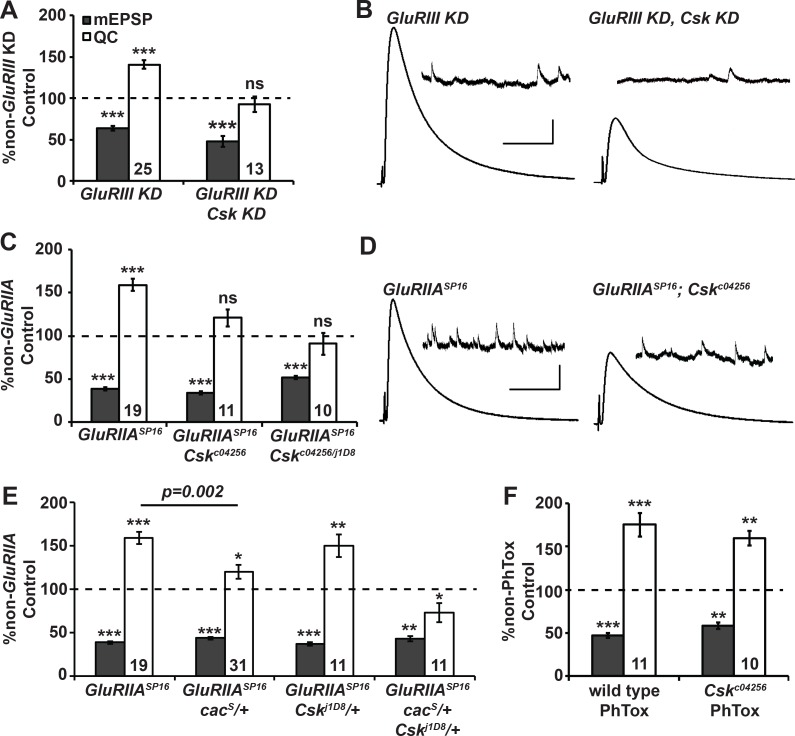
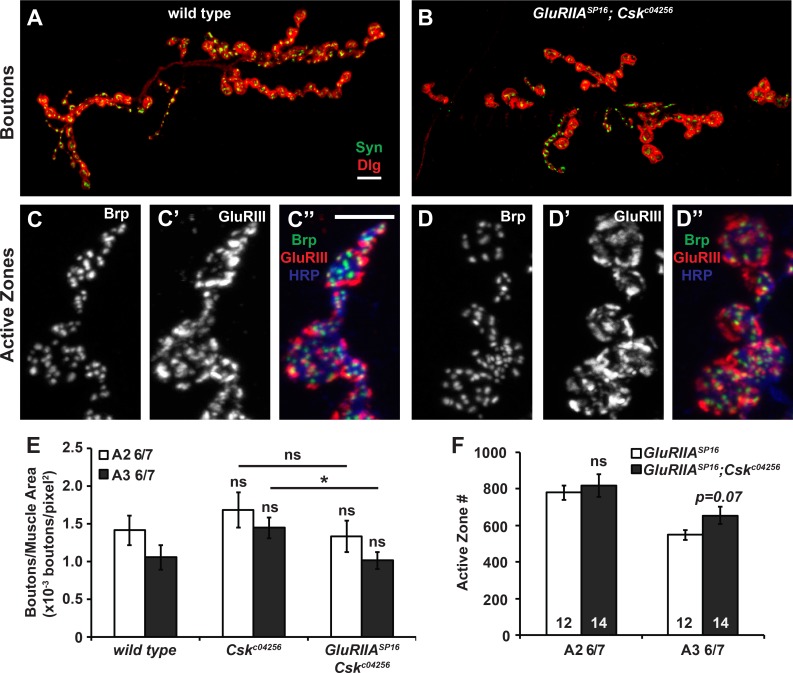
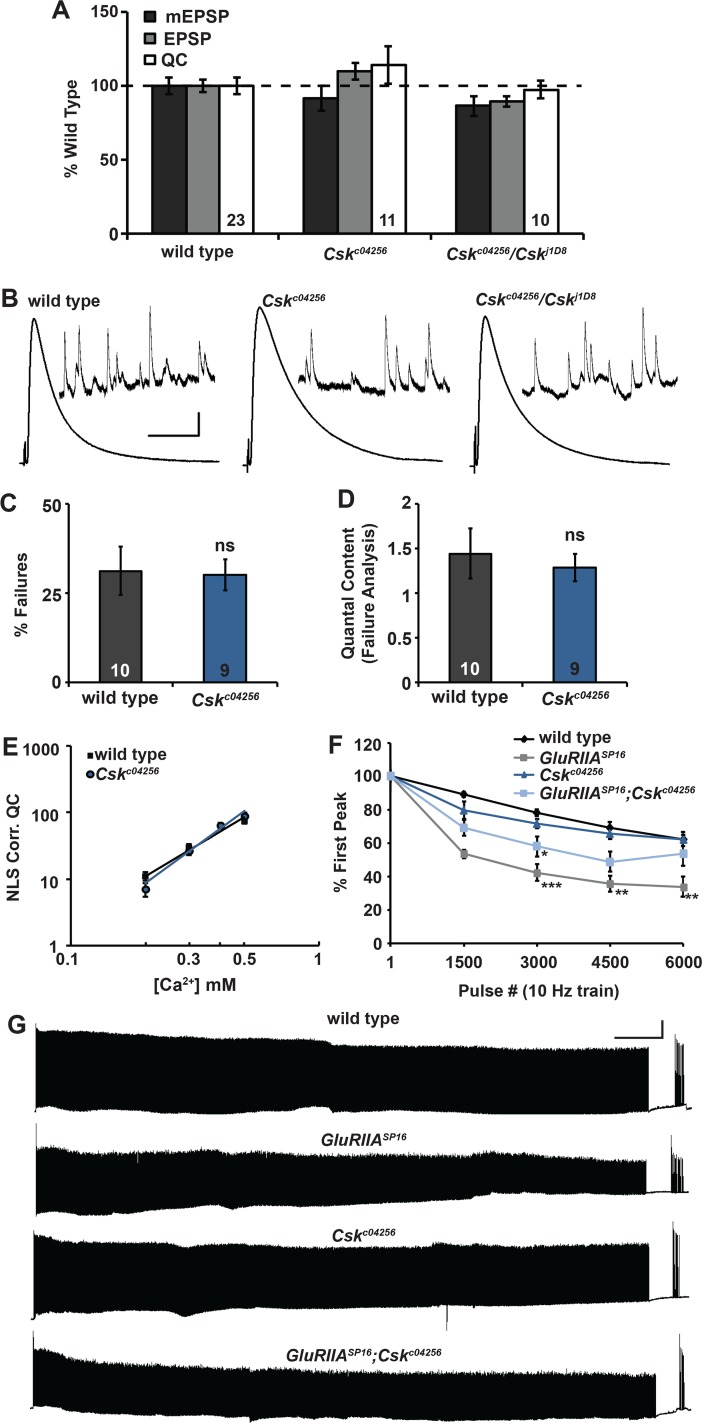
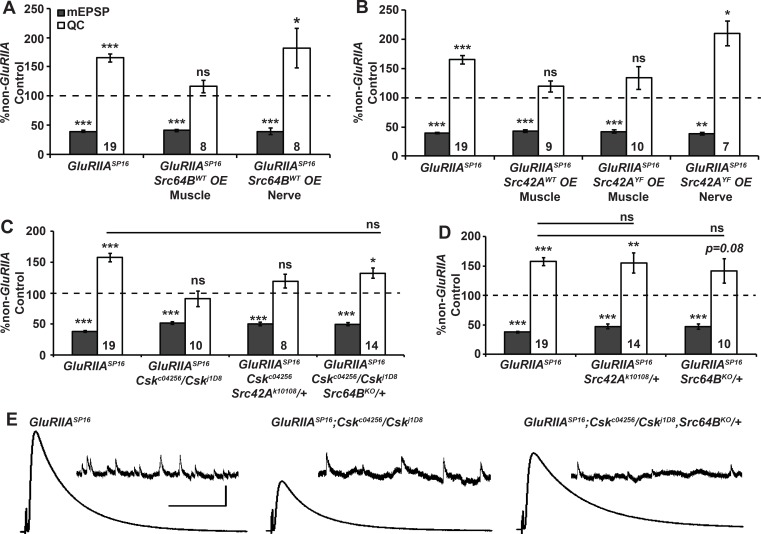
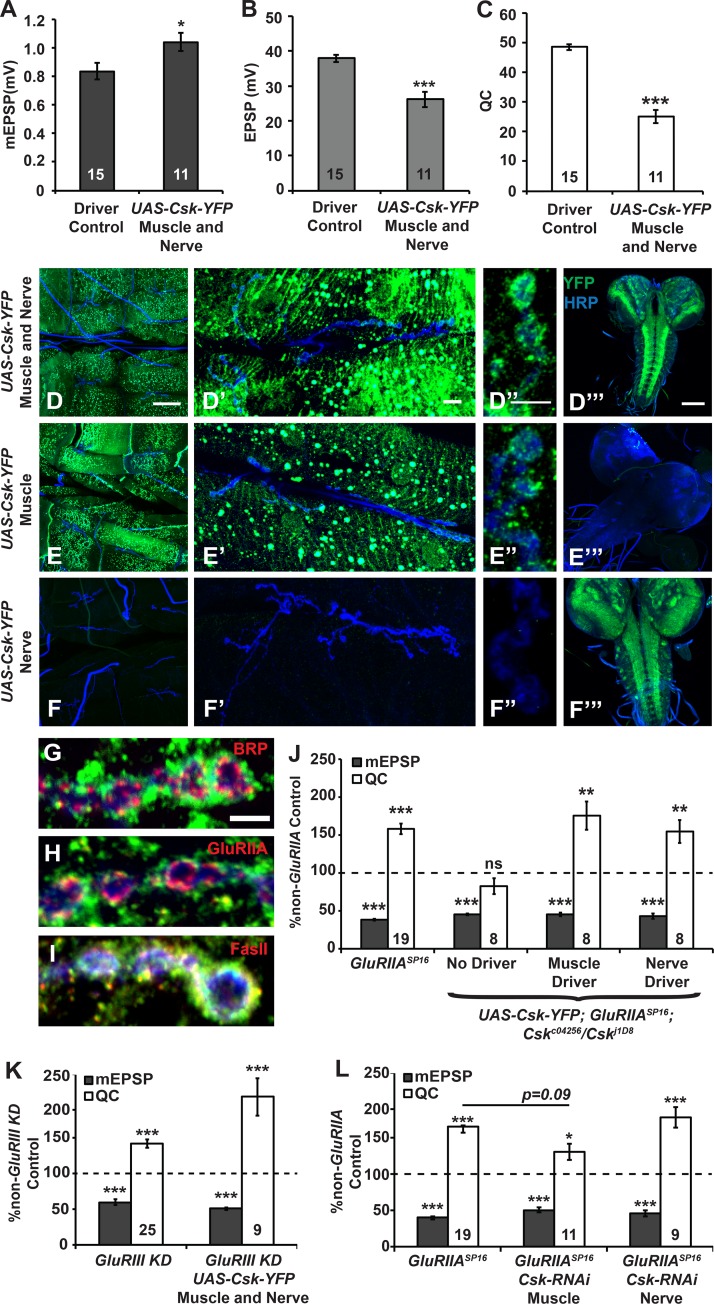
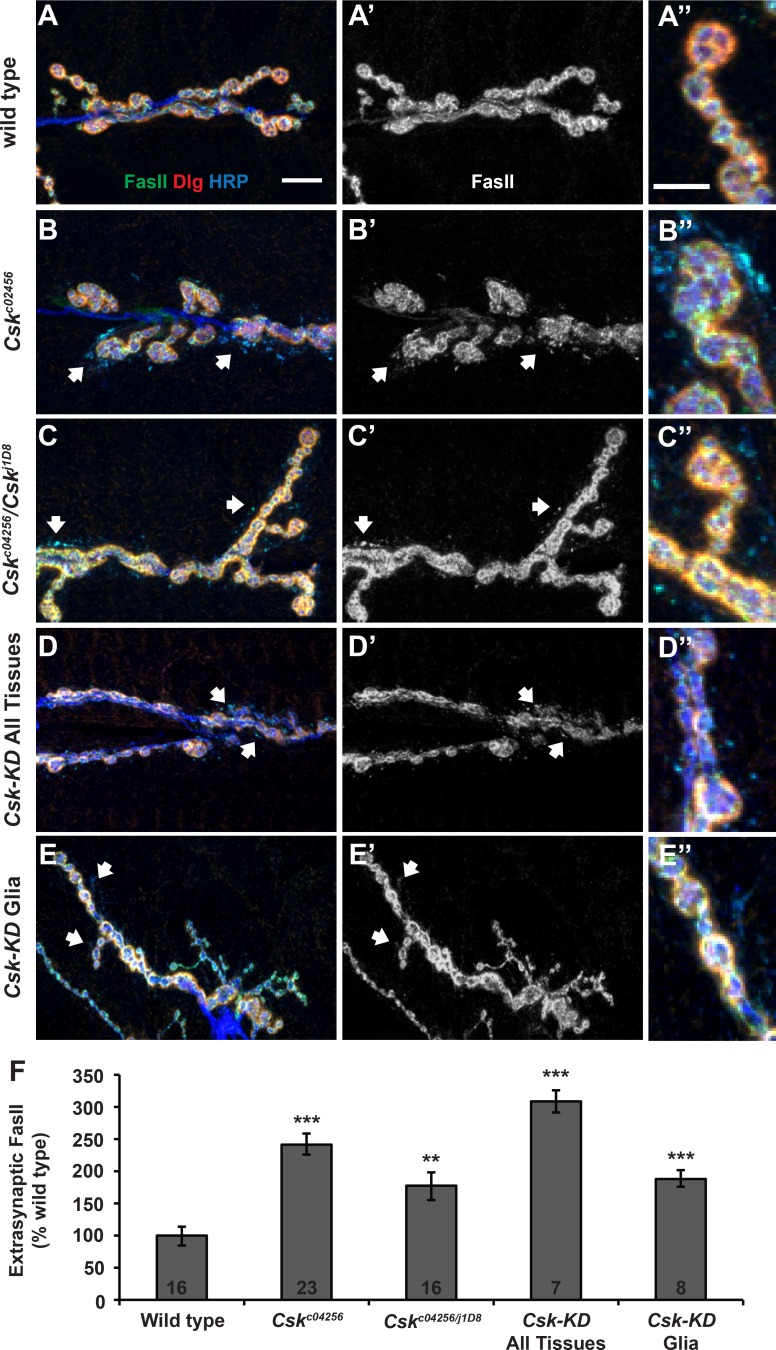
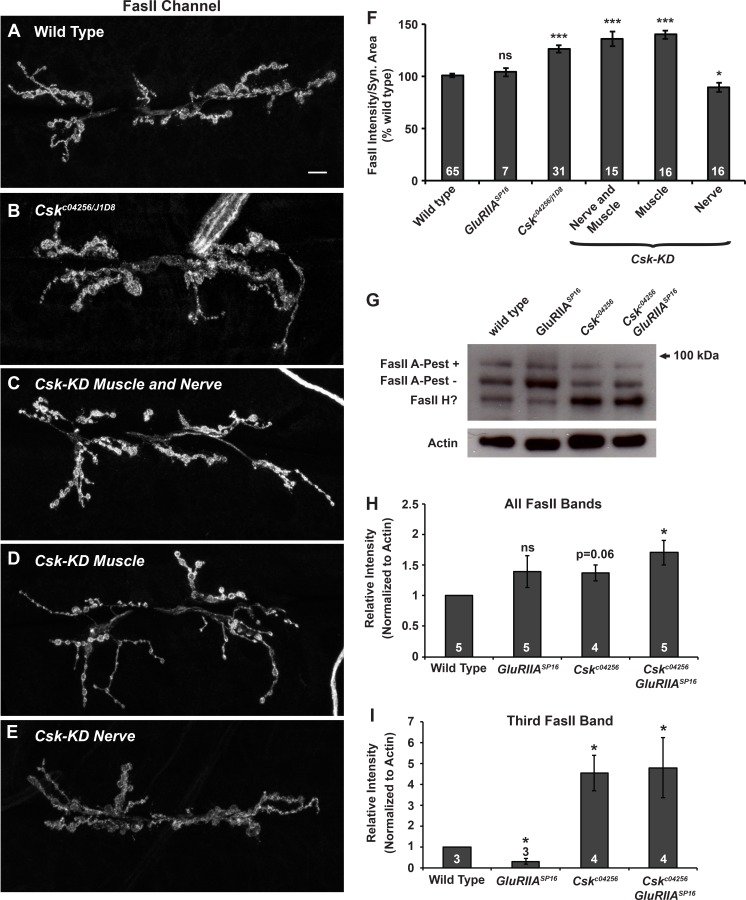
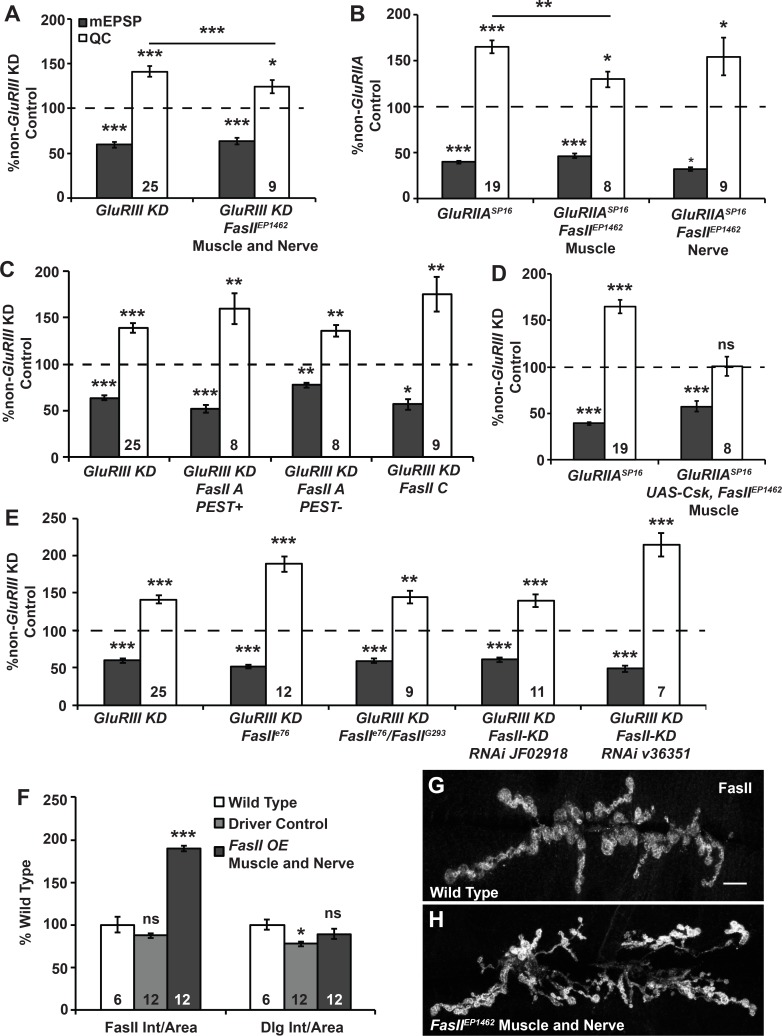
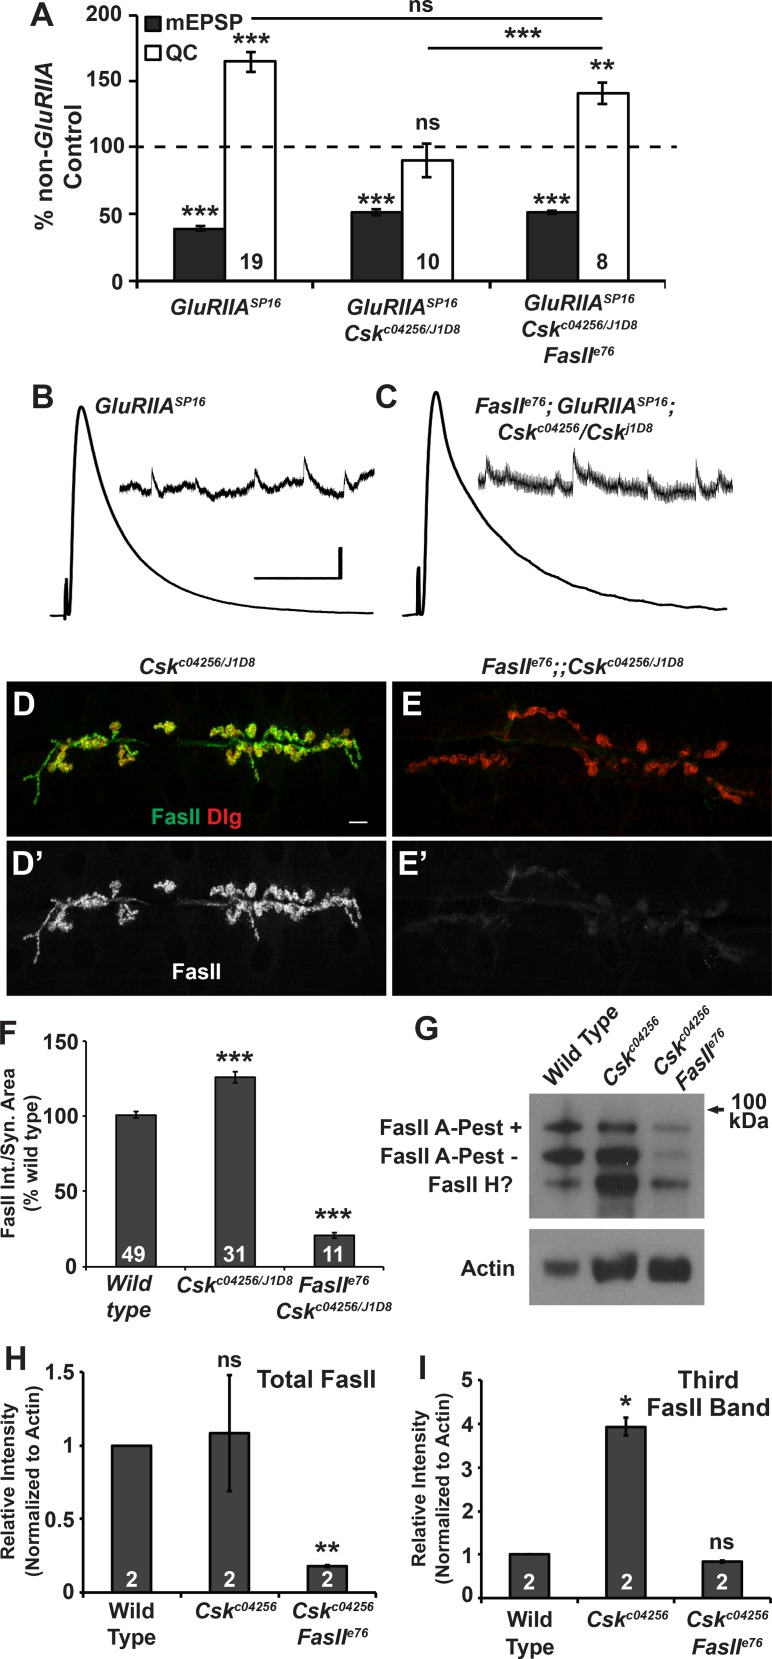
Forms of homeostatic plasticity stabilize neuronal outputs and promote physiologically favorable synapse function. A well-studied homeostatic system operates at the Drosophila melanogaster larval neuromuscular junction (NMJ). At the NMJ, impairment of postsynaptic glutamate receptor activity is offset by a compensatory increase in presynaptic neurotransmitter release. We aim to elucidate how this process operates on a molecular level and is preserved throughout development. In this study, we identified a tyrosine kinase-driven signaling system that sustains homeostatic control of NMJ function. We identified C-terminal Src Kinase (Csk) as a potential regulator of synaptic homeostasis through an RNAi- and electrophysiology-based genetic screen. We found that Csk loss-of-function mutations impaired the sustained expression of homeostatic plasticity at the NMJ, without drastically altering synapse growth or baseline neurotransmission. Muscle-specific overexpression of Src Family Kinase (SFK) substrates that are negatively regulated by Csk also impaired NMJ homeostasis. Surprisingly, we found that transgenic Csk-YFP can support homeostatic plasticity at the NMJ when expressed either in the muscle or in the nerve. However, only muscle-expressed Csk-YFP was able to localize to NMJ structures. By immunostaining, we found that Csk mutant NMJs had dysregulated expression of the Neural Cell Adhesion Molecule homolog Fasciclin II (FasII). By immunoblotting, we found that levels of a specific isoform of FasII were decreased in homeostatically challenged GluRIIA mutant animals-but markedly increased in Csk mutant animals. Additionally, we found that postsynaptic overexpression of FasII from its endogenous locus was sufficient to impair synaptic homeostasis, and genetically reducing FasII levels in Csk mutants fully restored synaptic homeostasis. Based on these data, we propose that Csk and its SFK substrates impinge upon homeostatic control of NMJ function by regulating downstream expression or localization of FasII.


Conflict of interest statement

The authors have declared that no competing interests exist.

Figures

Fig 1
Fig 1. Csk is required for long-term homeostatic plasticity at the NMJ.
(A) RNAi-mediated Csk knock down blocks synaptic homeostasis. Miniature excitatory postsynaptic potential amplitudes (mEPSP; gray) and quantal content (QC; white) normalized to genetic controls (dashed line) lacking a homeostatic challenge (non-GluRIII knockdown control). For both GluRIII and Csk, RNAi-mediated knock down is driven by the simultaneous presence of pre- and postsynaptic GAL4 drivers (see Methods and S1 Table for full genotypes). (B) Representative electrophysiological traces. Scale bar for EPSP (mEPSP): y = 5 mV (0.5 mV), x = 50 ms (1 s). (C) Normalized mEPSP and QC for GluRIIASP16 mutant, GluRIIASP16; Cskc04256 double mutant, and GluRIIASP16; Cskc04256/Cskj1D8 double mutant NMJs. GluRIIA; Csk NMJs did not execute homeostatic increases in QC compared to baseline controls. (D) Representative electrophysiological traces. Scale bars as in B. (E) Normalized mEPSP and QC for GluRIIASP16 mutant, cacS/+; GluRIIASP16 mutant, GluRIIASP16; Cskj1D8/+ double mutant, and cacS/+; GluRIIASP16; Cskj1D8/+ triple mutant NMJs. (F) Normalized mEPSP and QC for Cskc02456 mutants treated with philanthotoxin-433 (PhTox). * p < 0.05, ** p < 0.01, *** p < 0.001, ns—not significant (p > 0.1) by Student’s T-test comparing homeostatically challenged mutants to their unchallenged (non-GluRIII KD, non-GluRIIA, or non-PhTox) genetic controls.
Fig 2
Fig 2. Csk mutant NMJs display normal growth.
Bouton staining of (A) wild-type and (B) GluRIIASP16;Cskc04256 NMJs. Boutons were stained presynaptically by anti-Synapsin (green) and postsynaptically by anti-Dlg (red). Scale bar = 10 μm. (C-D”) Active zone staining of (C-C”) GluRIIASP16 and (D-D”) GluRIIASP16;Cskc04256 mutant NMJs. The neuron is marked by HRP (blue), presynaptic active zones are marked by Brp (C, D, and green), and glutamate receptors are marked by GluRIII (C’, D’, and red). Scale bar = 5 μm. (E) Quantification of the bouton staining shown in A and B, muscle 6/7 synapse, segments A2 or A3 as indicated. Values shown are number of boutons per muscle area. See S1 Fig for non-normalized bouton number and muscle area. (F) Quantification of the active zone staining shown in C and D. Active zones were counted using Imaris 3D rendering software. * p < 0.05, ** p < 0.01, *** p < 0.001, ns—not significant (p > 0.1) by Student’s T-test.
Fig 3
Fig 3. Csk mutant NMJs display normal baseline neurotransmission.
(A) Values for mEPSP amplitude (black), EPSP amplitude (gray), and quantal content (QC; white) normalized to wild type (dashed line). No measures were significantly different from wild type. (B) Representative electrophysiological traces for the data shown in A. Scale bar for EPSP (mEPSP) traces: y = 5 mV (0.5 mV), x = 50 ms (1 s). (C and D) Failure analysis of wild type and Csk mutant NMJs. (C) % of total stimulus events that failed to produce an evoked response. (D) Quantal content calculated from failure analysis, QC = ln(# trials/# failures). (E) Calcium cooperativity curve from NMJs of wild type and Csk mutant animals. Quantal content corrected for non-linear summation (NLS) was determined at the extracellular calcium concentrations shown. (F) Average values for EPSP amplitudes as a percent of the initial EPSP amplitude at pulse 1, 1500, 3000, 4500, and 6000 of a 6000 pulse, 10 Hz train. (G) Representative electrophysiological traces for the data shown in F. Scale bar x = 1 min, y = 10 mV. For A-E, * p < 0.05, ** p < 0.01, *** p < 0.001, ns—not significant (p > 0.1) by Student’s T-test. For (F), * p < 0.05, ** p < 0.01, *** p < 0.001, ns—not significant (p > 0.1) by ANOVA (Tukey’s post-hoc) when comparing to wild type.
Fig 4
Fig 4. Csk genetically opposes Src family kinases in the context of synaptic homeostasis.
(A-D) Values for mEPSP amplitude (gray) and quantal content (QC; white) normalized to genetic controls that lack a homeostatic challenge (non-GluRIIA Control, dashed line). (A-B) Muscle-specific SFK overexpression (OE) impairs synaptic homeostasis, while neuron-specific OE does not. (C) Src64B/+ mutation partially suppresses the GluRIIA; Csk block of synaptic homeostasis. (D) Src42A/+ and Src64B/+ genetic conditions do not confer homeostatic defects on their own. (E) Representative electrophysiological traces for data shown in C. Scale bar for EPSP (mEPSP) traces: y = 5 mV (0.5 mV), x = 50 ms (1 s). * p < 0.05, ** p < 0.01 *** p < 0.001 ns—not significant (p > 0.1) by Student’s T-test of homeostatically challenged mutants directly to their unchallenged (non-GluRIIA) controls or by ANOVA (Tukey’s post-hoc) when comparing across multiple homeostatically-challenged genotypes in a dataset.
Fig 5
Fig 5. Transgenic Csk is sufficient for homeostatic compensation either presynaptically or postsynaptically.
Average values for (A) mEPSP amplitude, (B) EPSP amplitude, and (C) quantal content (QC) for GAL4 driver control (concurrent elaV(C155)-Gal4, Sca-Gal4, BG57-Gal4) NMJs and those overexpressing YFP-tagged Csk on both sides of the synapse. (D-F”‘) Representative images of Csk-YFP localization at the NMJ and in the CNS, as detected by immunostaining when the construct is expressed on both sides of the synapse (D-D”), only in the muscle (E-E”), or only in neurons (F-F”‘). Neurons are marked by an anti-HRP antibody (blue) and Csk-YFP is shown in green. (D, E, and F) Images showing abdominal segments that include muscles 6/7 and images that show boutons at the NMJ. (D’, E’, and F’) Images showing a single muscle 6/7 synapse. (D”, E”, and F”) Images showing boutons from a muscle 6/7 synapse at high magnification. (D”‘, E”‘, and F”‘) Images showing the larval central nervous system. (G-I) Bouton localization of Csk-YFP (green) relative to Bruchpilot (Brp, G), the GluRIIA subunit (H), or Fasciclin II (FasII, I) at muscle 6/7 synapses at which Csk-YFP is expressed only in the muscle. (J-L) Average values for mEPSP amplitude (gray) and quantal content (QC; white) normalized to genetic controls (dashed line) that lack a homeostatic challenge (non-GluRIIA Control). * p < 0.05, ** p < 0.01, *** p < 0.001, ns—not significant (p > 0.1) by Student’s T-test of homeostatically challenged mutants to their unchallenged (non-GluRIIA) controls and by ANOVA (Tukey’s post-hoc) when comparing across multiple homeostatically-challenged genotypes in a dataset.
Fig 6
Fig 6. Glial Csk regulates Fasciclin II localization at the NMJ.
(A-E) Immunostaining of anti-FasII (green), anti-Dlg (red), and anti-HRP (blue) at NMJs with the following genotypes: (A-A”) wild type, (B-B”) Cskc04256, (C-C”) Cskc04256/Cskj1D8, (D-D”) Csk-RNAi expressed in the whole animal (Tubulin-Gal4), and (E-E”) Csk-RNAi expressed only in glia (Nrv2-Gal4). Extra-synaptic FasII was defined as FasII signal found outside the Dlg-stained region. Areas with high levels of extra-synaptic FasII are indicated with white arrows. Scale bar = 10 μm for A and 5 μm for A”. (F) Relative levels of extra-synaptic FasII debris (extra-synaptic FasII staining area/total FasII staining area) present at the synapse. Values are represented as a percent of wild type to allow for appropriate comparison between multiple immunostaining experiments. For details on quantification of extra-synaptic FasII levels, see Methods. * p < 0.05, ** p < 0.01, *** p < 0.001 by Student’s T-test compared to wild type.
Fig 7
Fig 7. Expression of a Fasciclin II isoform is lowered during synaptic homeostasis and regulated by Csk.
(A-E) Representative images of FasII immunostaining at NMJs that are (A) wild type, (B) Cskc04256/Cskj1D8, (C) expressing Csk-RNAi in muscle and neurons, (D) expressing Csk-RNAi in only muscle, and (E) expressing Csk-RNAi in only neurons. (F) Average values for synaptic FasII fluorescence intensity normalized to synapse area and normalized to wild type. (G) Western blot of FasII (DSHB 1D4 antibody) in protein extracts from whole third instar larvae. (H, I) Relative quantification of (H) total FasII intensity and (I) the intensity of the lowest molecular weight FasII band (the ‘third band’). Quantification in H and I is shown as a fold change relative to wild type. Values on/above bars indicate the number of biological replicates for each genotype. * p < 0.05, ** p < 0.01, *** p < 0.001, ns—not significant (p > 0.2) by Student’s T-test compared to wild type.
Fig 8
Fig 8. Excess FasII impairs synaptic homeostasis.
(A-E) Values for mEPSP amplitude (gray) and quantal content (QC; white) normalized to genetic controls (dashed line) that lack a homeostatic challenge (non-GluRIII KD or non-GluRIIA controls). (A) Trans-synaptic FasII overexpression (O/E) from the FasII endogenous locus (FasIIEP1462) shows partial impairment of synaptic homeostasis, as does (B) muscle-specific overexpression with FasIIEP1462. (C) Overexpressing specific isoforms of FasII does not impair homeostatic compensation. (D) Overexpressing Csk-YFP in addition to FasIIEP1462 fails to suppress the homeostatic defects of FasII O/E seen in B. (E) Neither FasII loss-of-function mutations nor FasII knockdown (KD) impairs synaptic homeostasis. (F) Average values for synaptic FasII and Dlg fluorescence intensity normalized to synapse area. (G-H) Representative images of FasII immunostaining for trans-synaptic FasII overexpression. Scale bar = 10 μm. * p < 0.05, ** p < 0.01, *** p < 0.001, ns—not significant (p > 0.08) by Student’s T-test comparing homeostatically challenged mutants to their unchallenged (non-GluRIIA) controls.
Fig 9
Fig 9. Reducing FasII levels in GluRIIA; Csk mutants restores homeostatic compensation.
A) Values for mEPSP amplitude (gray) and quantal content (QC; white) normalized to genetic controls (dashed line) that lack a homeostatic challenge. FasII; GluRIIA; Csk triple mutants have intact homeostatic plasticity. (B-C) Representative electrophysiological traces for data shown in A. Scale bar for EPSP (mEPSP) traces: y = 5 mV (0.5 mV), x = 50 ms (1 s). (D-E’) Representative images of NMJs stained for FasII (green, gray channel) and Dlg (red) for (D, D’) Csk mutant and (E, E’) FasII, Csk double mutant NMJs. Scale bar = 10 μm. (F) Quantification of FasII staining intensities per synapse area for the genotypes shown in D-E’. (G) Western blot of FasII (DSHB 1D4 antibody) in protein extracts from whole third instar larvae. (H, I) Relative quantification of (H) total FasII intensity and (I) the intensity of the lowest molecular weight FasII band (the ‘third band’). Values are fold changes relative to wild type. * p < 0.05, ** p < 0.01, *** p < 0.001, ns—not significant (p > 0.4) by Student’s T-test and for the bars in A, which are p-values from ANOVA (Tukey’s post-hoc) comparison between the three genotypes shown.

References

    1. Davis GW (2013) Homeostatic signaling and the stabilization of neural function. Neuron 80: 718–728. 10.1016/j.neuron.2013.09.044 - DOI - PMC - PubMed
    1. Marder E, Goaillard JM (2006) Variability, compensation and homeostasis in neuron and network function. Nat Rev Neurosci 7: 563–574. - PubMed
    1. Perez-Otano I, Ehlers MD (2005) Homeostatic plasticity and NMDA receptor trafficking. Trends Neurosci 28: 229–238. - PubMed
    1. Pozo K, Goda Y (2010) Unraveling mechanisms of homeostatic synaptic plasticity. Neuron 66: 337–351. 10.1016/j.neuron.2010.04.028 - DOI - PMC - PubMed
    1. Turrigiano GG (2008) The self-tuning neuron: synaptic scaling of excitatory synapses. Cell 135: 422–435. 10.1016/j.cell.2008.10.008 - DOI - PMC - PubMed

Publication types

MeSH terms

LinkOut - more resources