Comparative Study
. 2016 Feb 22;11(2):e0149866.
doi: 10.1371/journal.pone.0149866. eCollection 2016.

Comparative Analysis of Technologies for Quantifying Extracellular Vesicles (EVs) in Clinical Cerebrospinal Fluids (CSF)

Affiliations
Comparative Study

Comparative Analysis of Technologies for Quantifying Extracellular Vesicles (EVs) in Clinical Cerebrospinal Fluids (CSF)

Johnny C Akers et al. PLoS One. .

Abstract

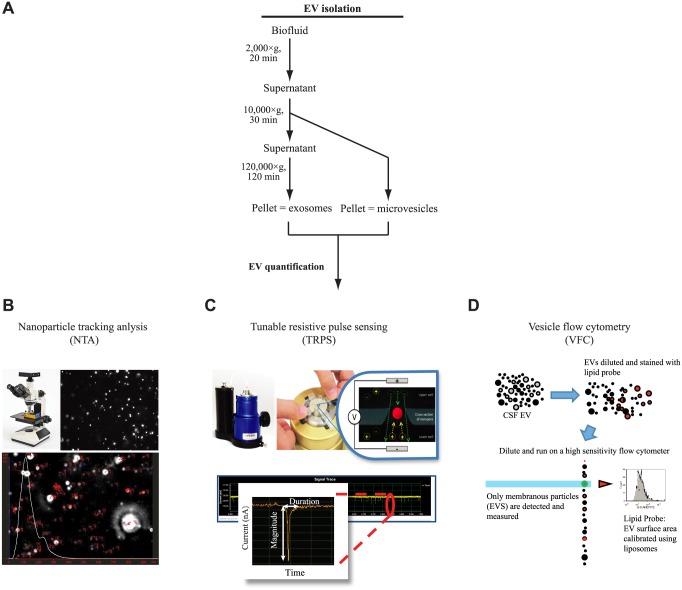
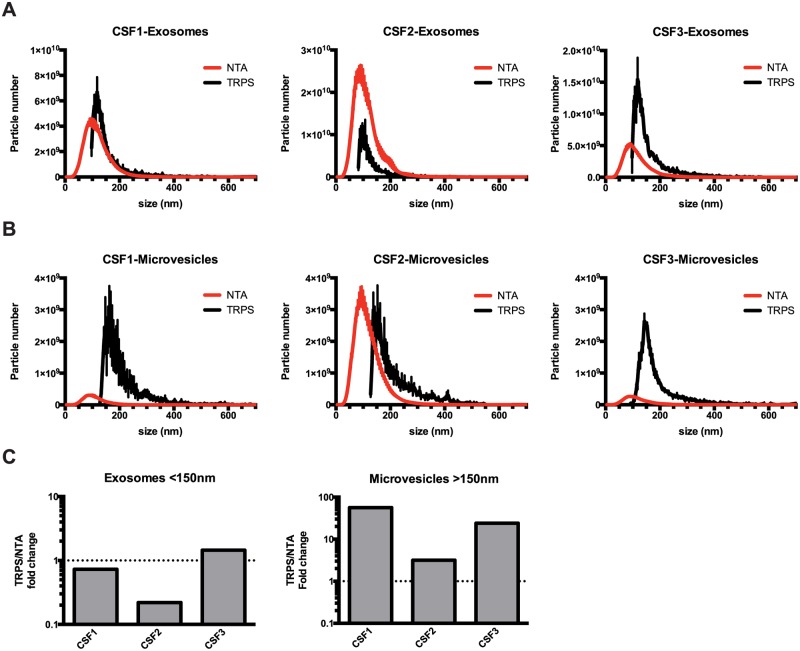
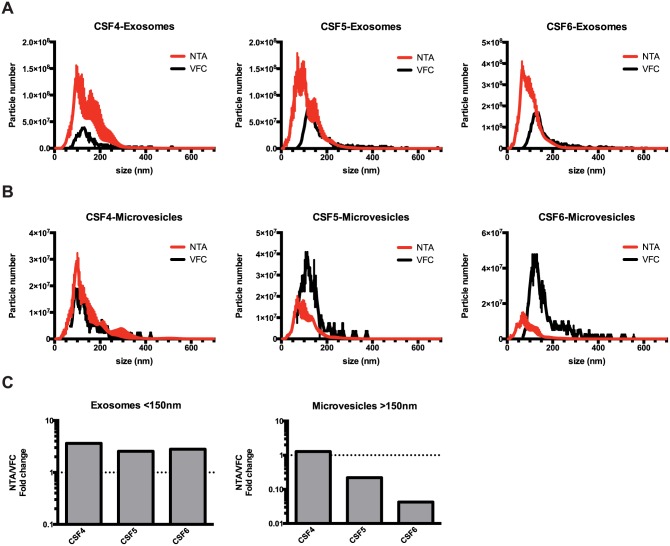
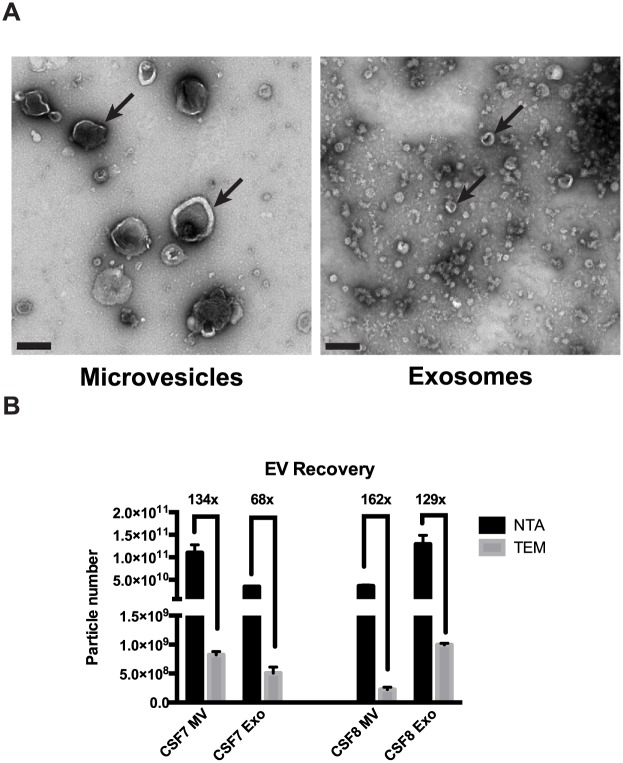
Extracellular vesicles (EVs) have emerged as a promising biomarker platform for glioblastoma patients. However, the optimal method for quantitative assessment of EVs in clinical bio-fluid remains a point of contention. Multiple high-resolution platforms for quantitative EV analysis have emerged, including methods grounded in diffraction measurement of Brownian motion (NTA), tunable resistive pulse sensing (TRPS), vesicle flow cytometry (VFC), and transmission electron microscopy (TEM). Here we compared quantitative EV assessment using cerebrospinal fluids derived from glioblastoma patients using these methods. For EVs <150 nm in diameter, NTA detected more EVs than TRPS in three of the four samples tested. VFC particle counts are consistently 2-3 fold lower than NTA and TRPS, suggesting contribution of protein aggregates or other non-lipid particles to particle count by these platforms. While TEM yield meaningful data in terms of the morphology, its particle count are consistently two orders of magnitude lower relative to counts generated by NTA and TRPS. For larger particles (>150 nm in diameter), NTA consistently detected lower number of EVs relative to TRPS. These results unveil the strength and pitfalls of each quantitative method alone for assessing EVs derived from clinical cerebrospinal fluids and suggest that thoughtful synthesis of multi-platform quantitation will be required to guide meaningful clinical investigations.


Conflict of interest statement

Competing Interests: The authors declare no conflicts of interest. Chia-Chun Fu is an employee of Izon Science. This does not alter the authors' adherence to PLOS ONE policies on sharing data and materials.

Figures

Fig 1
Fig 1. EV quantitative analysis.
(A) Schematic representation of protocol used for the isolation of CSF microvesicles and exosomes. (B) In nanoparticles tracking analysis, light scattered by EVs is captured by digital camera over a series of frames. The rate of the particle movement is then used to calculate particle size using the Stokes—Einstein equation. (C) In tunable resistive pulse sensing, EVs change the electrical resistance as they pass through a pore-based sensor resulting in a resistive pulse signal. Signals obtained from the measurements can then be used to calculate the size, concentration and charge of each particle by correlating the signal back to a set of known standards. (D) In Vesicle flow cytometry, EVs were stained with an optimized concentration of a fluorogenic lipophilic probe, di-8-ANEPPS, and detected on a custom high sensitivity flow cytometer. Vesicle diameter was estimated by comparison to di-8-stained liposomes.
Fig 2
Fig 2. Comparison of EV quantification by NTA and TRPS.
EVs were isolated from CSF collected from glioblastoma patients by differential centrifugation into microvesicle (10,000×g) and exosome (120,000×g) fractions, and resuspended in PBS. Isolated EVs were analyzed by NTA or TRPS. (A) Size profile of CSF exosomes determined by NTA and TRPS. (B) Size profile of CSF microvesicles determined by NTA and TRPS. (C) Comparison of EV yield by size ranges.
Fig 3
Fig 3. Comparison of EV quantification by NTA and VFC.
CSF EVs isolated by differential centrifugation into microvesicle (10,000×g) and exosome (120,000×g) fractions were analyzed by NTA or VFC. (A) Size profile of CSF exosomes determined by NTA and VFC. (B) Size profile of CSF microvesicles determined by NTA and VFC. (C) Comparison of EV yield by size ranges.
Fig 4
Fig 4. Comparison of EV quantification by NTA and TEM.
CSF EVs were fractionated into microvesicles (10,000×g) and exosomes (120,000×g) by differential ultracentrifugation and then analyzed by NTA and TEM. (A) Representative TEM images, scale bar = 200nm. (B) Total EV count as determined by NTA and TEM. Fold difference in particle detected between NTA and TEM is denoted.

Similar articles

Cited by

References

    1. Akers J, Gonda D, Kim R, Carter B, Chen C. Biogenesis of extracellular vesicles (EV): exosomes, microvesicles, retrovirus-like vesicles, and apoptotic bodies. Journal of Neuro-Oncology. 2013;113(1):1–11. 10.1007/s11060-013-1084-8 - DOI - PMC - PubMed
    1. Shifrin DA Jr., Demory Beckler M, Coffey RJ, Tyska MJ. Extracellular vesicles: communication, coercion, and conditioning. Mol Biol Cell. 2013;24(9):1253–9. Epub 2013/05/01. 24/9/1253 [pii] 10.1091/mbc.E12-08-0572 - DOI - PMC - PubMed
    1. Raposo G, Nijman HW, Stoorvogel W, Liejendekker R, Harding CV, Melief CJ, et al. B lymphocytes secrete antigen-presenting vesicles. J Exp Med. 1996;183(3):1161–72. Epub 1996/03/01. - PMC - PubMed
    1. Al-Nedawi K, Meehan B, Micallef J, Lhotak V, May L, Guha A, et al. Intercellular transfer of the oncogenic receptor EGFRvIII by microvesicles derived from tumour cells. Nat Cell Biol. 2008;10(5):619–24. 10.1038/ncb1725 . - DOI - PubMed
    1. Melo SA, Sugimoto H, O'Connell JT, Kato N, Villanueva A, Vidal A, et al. Cancer exosomes perform cell-independent microRNA biogenesis and promote tumorigenesis. Cancer Cell. 2014;26(5):707–21. 10.1016/j.ccell.2014.09.005 - DOI - PMC - PubMed

Publication types