. 2016 Feb 22;11(2):e0149477.
doi: 10.1371/journal.pone.0149477. eCollection 2016.

Pitchfork and Gprasp2 Target Smoothened to the Primary Cilium for Hedgehog Pathway Activation

Affiliations

Pitchfork and Gprasp2 Target Smoothened to the Primary Cilium for Hedgehog Pathway Activation

Bomi Jung et al. PLoS One. .

Abstract

The seven-transmembrane receptor Smoothened (Smo) activates all Hedgehog (Hh) signaling by translocation into the primary cilia (PC), but how this is regulated is not well understood. Here we show that Pitchfork (Pifo) and the G protein-coupled receptor associated sorting protein 2 (Gprasp2) are essential components of an Hh induced ciliary targeting complex able to regulate Smo translocation to the PC. Depletion of Pifo or Gprasp2 leads to failure of Smo translocation to the PC and lack of Hh target gene activation. Together, our results identify a novel protein complex that is regulated by Hh signaling and required for Smo ciliary trafficking and Hh pathway activation.


Conflict of interest statement

Competing Interests: The authors have declared that no competing interests exist.

Figures

Fig 1
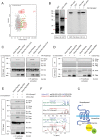
Fig 1. Smo, Gprasp2, and Pifo form a multimeric complex upon Shh signaling.
(A) Scatter plot of Pifo interactome. Green dots represent significant enriched (p>0.05) Pifo-interaction partners with some highlighted in red. X-axis shows the log2 ratios and Y-axis represents the log2 intensity of each protein. (B) Confirmation of protein interaction between Pifo and Gprasp2 in GST pull-down assay. GST and GST-mPifo fusion proteins (left panels, **) were subjected to pull-down in vitro translated HA-tagged hGPRASP2 (right panel, GST pull-down). (C, D, E) Determination of Pifo-Gprasp2-Smo multimeric complex formation in co-immunoprecipitation (co-IP). HEK293T cells transiently co-transfected with the indicated expression plasmids were treated with or without SAG (IP: Strep) or Shh (IP: HA and IP: Smo) and the cell lysates were then subjected to immunoprecipitation. Note that input (10%) and protein complexes were detected by immunoblotting with the indicated antibodies (B, C, E, F). (F) Confirmation of direct PPI between hSMO and hGPRASP2 by NMR. Zoomed views of aromatic region (top) and the aliphatic region (bottom) of 1H NMR spectra of the hSMO-WT and hSMO-CLD peptides were acquired before (blue and red lines) and after addition of hGPRASP2 (green and black lines). (G) Schematic illustration of the Smo ciliary targeting complex.
Fig 2
Fig 2. Shh signaling induces Smo ciliary targeting complex formation.
(A) Kinetics of Smo-Gprasp2-Pifo multimeric complex formation upon Shh treatment. Strep-Tactin sepharose-coupled mPifo was subjected to time-resolved affinity precipitations of native protein complexes formed upon Shh stimulation in PLCs. (B) Time-resolved endogenous co-IP of the Gprasp2-Smo ciliary targeting complex upon Shh stimulation in PLCs. Lysates from cells exposed to Shh for different time periods were subjected to immunoprecipitation with Anti-Smo antibody-conjugated beads. Immunoprecipitation with isotype-specific IgG antibodies served as negative control (** indicates non-specific bands). After immunoprecipitation, subsequent immunoblotting with the indicated antibodies determined dynamic changes in protein interactions (A, B). β-arrestin 1 and 2, well-known Smo interacting proteins, were used as a positive control. All error bars indicate the mean ± SD of three independent experiments. Data were analyzed using a two tailed unpaired t-test (* = p<0.1, ** = p<0.01).
Fig 3
Fig 3. Pifo is necessary for Shh target gene activation and translocation of Smo into the PC.
(A) The levels of Gli1 and Gli2 protein in Pifowt/wt, Pifowt/FD, and PifoFD/FD PLCs treated with or without Shh. Graphs represent quantification of immunoblot data that show the mean fold change of protein normalized to Actin levels. (B) Immortalization and generation of stably transfected Pifoflox/flox PLCs to analyze the requirement of Pifo in Smo ciliary translocation by quantitative live-cell imaging. Selected still images (B) and quantification (B, C) of confocal time-lapse movies of Pifoflox/flox PLCs and PifoFD/FD PLCs stably expressing Venus-tagged Arl13b and RFP-tagged Smo. Scale bar = 5 μm. >100 cilia per condition were analyzed. All error bars indicate the mean ± SD of three independent experiments. Data were analyzed using a two tailed unpaired t-test (** = p<0.01, *** = p<0.001)
Fig 4
Fig 4. Pifo is necessary and sufficient for ciliary localization of Smo and Shh target gene activation.
(A) Experimental scheme for generating Pifo conditional knock-out and Venus-Pifo rescued cell lines. (B) Induction kinetics of Gli1 and Gli2 protein in Pifowt/wt, PifoFD/FD, and two independent Venus-Pifo rescued PLC cell lines upon Shh stimulation. Note that expression levels of the endogenous (<) and Venus-tagged Pifo (*) were detected by α-Pifo (- indicates non-specific bands). Protein loading was controlled by Actin levels. Transduction efficiency of AdCre was evaluated by α-GFP. Mean ± SD of three independent experiments. Representative confocal image (C) and quantification (D) of ciliary Smo in Pifowt/wt, PifoFD/FD, and rescued PLCs. Scale bar = 2 μm. >100 cilia per condition were analyzed. All error bars indicate the mean ± SD of three independent experiments. Data were analyzed using a two tailed unpaired t-test (** = p<0.01, *** = p<0.001). (E) The fitted Pifo+ model dynamics (solid line) of Gli1 and 2 for the three different conditions (Pifowt/wt, PifoFD/FD and Rescue) relative to Shh activation (t = 0). Black circles, boxes and crosses denote experimental data in replicates, arbitrary units. Gray areas denote the confidence intervals for the parameter estimation. (F) Scheme showing hypothesized influence of Pifo on Shh target genes, Gli1 and 2, (dotted line) used for the mathematical model. Smo and Pifo support activation of Gli1 and 2, but Ptch inhibits the activation. Activated Gli1 and 2 (Gli1A and Gli2A) support both their own and Pifo expression levels.
Fig 5
Fig 5. Gprasp2 is required for ciliary localization of Smo and Shh target gene activation.
(A) Shh-induced protein levels after 48h of siRNA-mediated knock-down of Gprasp2 in PLCs. (B) Mouse Gprasp2 siRNA target sequences with Multiple species ClustalW alignment to human and mouse Gprasp2 and indicated siRNA seed region position. Determination of Smo-Pifo complex formation after depletion of mGprasp2 (C) and rescue of mGprasp2 depletion by introducing hGPRASP2 (D). 48h post-transfection with the indicated siRNA duplexes or co-transfection with the indicated siRNA duplexes and HA-tagged hGPRASP2, PLCs were stimulated with Shh and the lysates were subsequently subjected to Strep-Tactin sepharose-coupled mPifo. Input (10%) and endogenous Smo protein complexes were determined by immunoblotting with the indicated antibodies. Representative confocal image (E) and quantification (E, F) of endogenous ciliary Smo after 48 h of siRNA-mediated depletion of mGprasp2 in PLCs. Note that levels of Alexa Fluor 488 (high and low) correlates with different Gprasp2 knock-down efficiency. Scale bar = 25 μm. >100 cilia per condition were analyzed. All error bars indicate the mean ± SD of three independent experiments. Data were analyzed using a two tailed unpaired t-test (** = p<0.01).
Fig 6
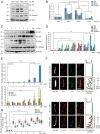
Fig 6. Rapid Shh induction of Pifo, Gprasp2 and Gli2 is regulated on transcriptional and post-translational level.
(A) The levels of Gli1, Pifo and Gprasp2 protein after treatment with Shh, SAG, or Cyc in PLCs. Graphs (B, D) represent quantification of immunoblot data that show the mean fold change of protein expression normalized to Actin levels. Characterization of induction kinetics of Gli1, Gli2, Pifo, and Gprasp2 proteins (C) and mRNAs (E) in response to Shh stimulation in PLCs. Representative confocal images for co-localization analysis of ciliary Pifo and Smo or Gprasp2 (F) and quantification (G) of ciliary accumulation in response to Shh stimulation. >100 cilia per condition were analyzed. All error bars indicate the mean ± SD of three independent experiments. Data were analyzed using a two tailed unpaired t-test (B, D, E) or a two way ANOVA (G) (* = p<0.1, ** = p<0.01, *** = p<0.001)
Fig 7
Fig 7. Hypothetical model of Smo transport and regulation by Pifo and Gprasp2 upon Shh signaling.
In the absence of Shh signaling (left), Ptch1 localizes to the PC and suppresses Smo translocation to PC. The proteolytically processed repressor forms of Gli (GliR) accumulate and enter the nucleus to inhibit target gene expression. In the presence of Shh (right), Pifo and Gprasp2 rapidly form a Smo ciliary targeting complex. This can be transported to the PC from 1. intracellular pools or 2. via lateral plasma membrane transport or 3. via the recycling endosome pathway. Smo transport into the PC is mediated through the kinesine II motor complex leading to accumulation of Gli activator forms (GliA) in the cytoplasm and nucleus for Shh target gene activation.

References

    1. Pazour GJ, Rosenbaum JL. Intraflagellar transport and cilia-dependent diseases. Trends Cell Biol. 2002;12(12):551–5. - PubMed
    1. Rosenbaum JL, Witman GB. Intraflagellar transport. Nat Rev Mol Cell Biol. 2002;3(11):813–25. - PubMed
    1. Pan J, Snell W. The primary cilium: keeper of the key to cell division. Cell. 2007;129(7):1255–7. - PubMed
    1. Santos N, Reiter JF. Building it up and taking it down: the regulation of vertebrate ciliogenesis. Dev Dyn. 2008;237:1972–81. 10.1002/dvdy.21540 - DOI - PMC - PubMed
    1. Kinzel D, Boldt K, Davis EE, Burtscher I, Trumbach D, Diplas B, et al. Pitchfork regulates primary cilia disassembly and left-right asymmetry. Dev Cell. 2010;19(1):66–77. 10.1016/j.devcel.2010.06.005 - DOI - PMC - PubMed

Publication types