. 2016 Feb 22;11(2):e0149220.
doi: 10.1371/journal.pone.0149220. eCollection 2016.

The Effects of Sub-Regional Climate Velocity on the Distribution and Spatial Extent of Marine Species Assemblages

Affiliations

The Effects of Sub-Regional Climate Velocity on the Distribution and Spatial Extent of Marine Species Assemblages

Kristin M Kleisner et al. PLoS One. .

Abstract

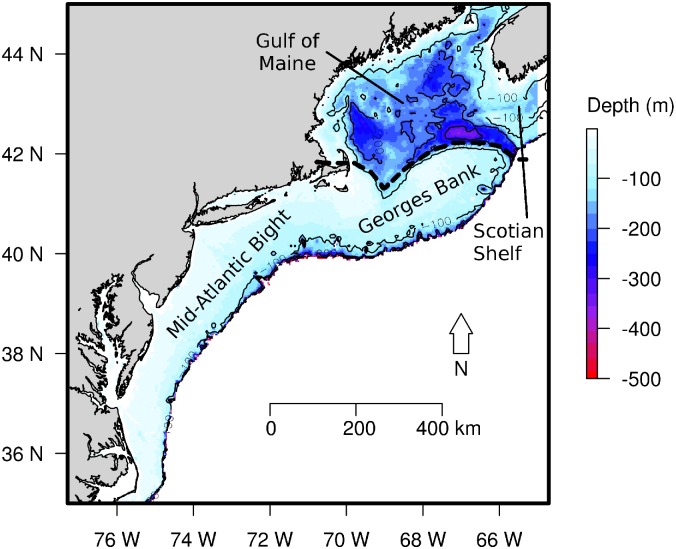
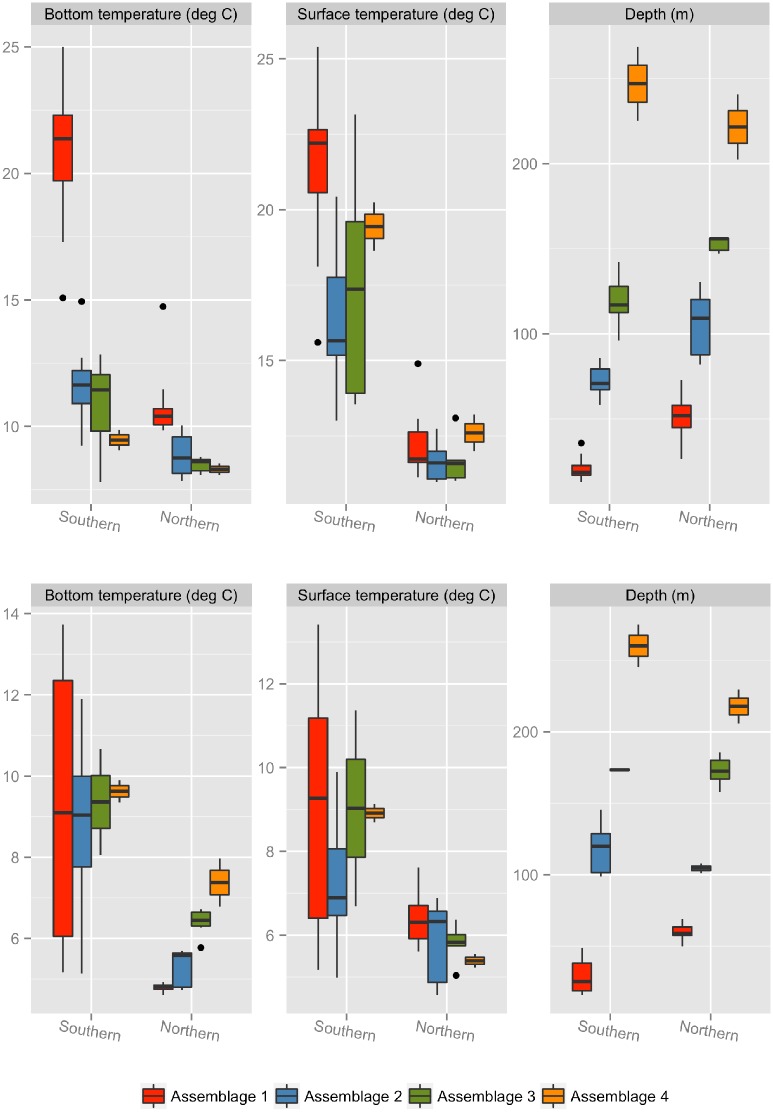
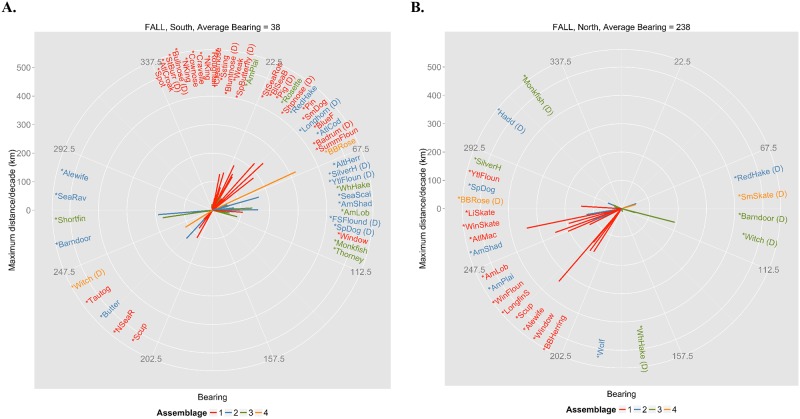
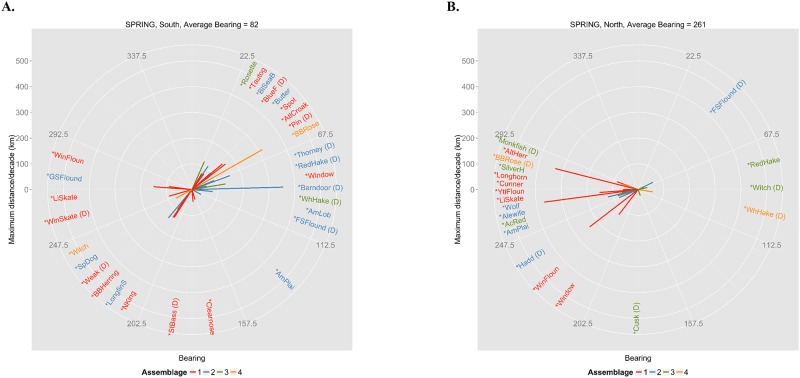
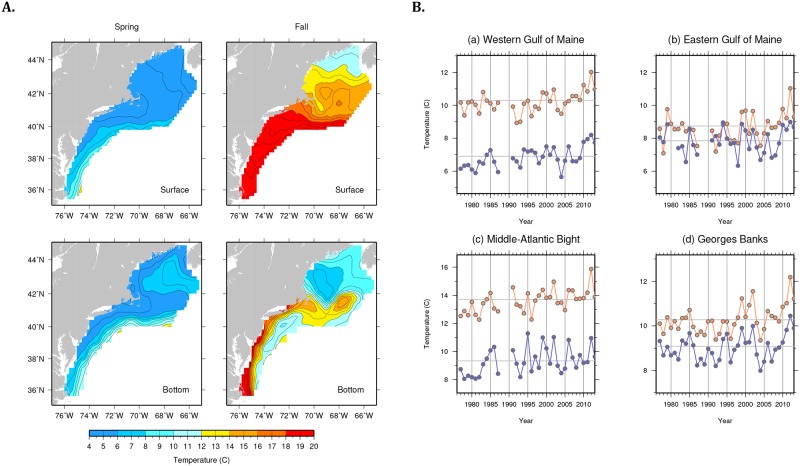
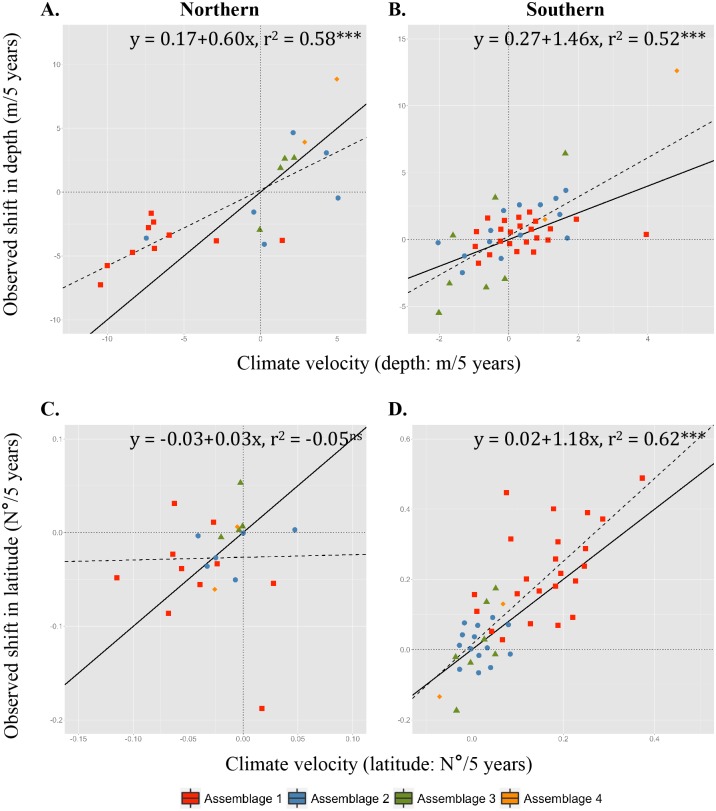
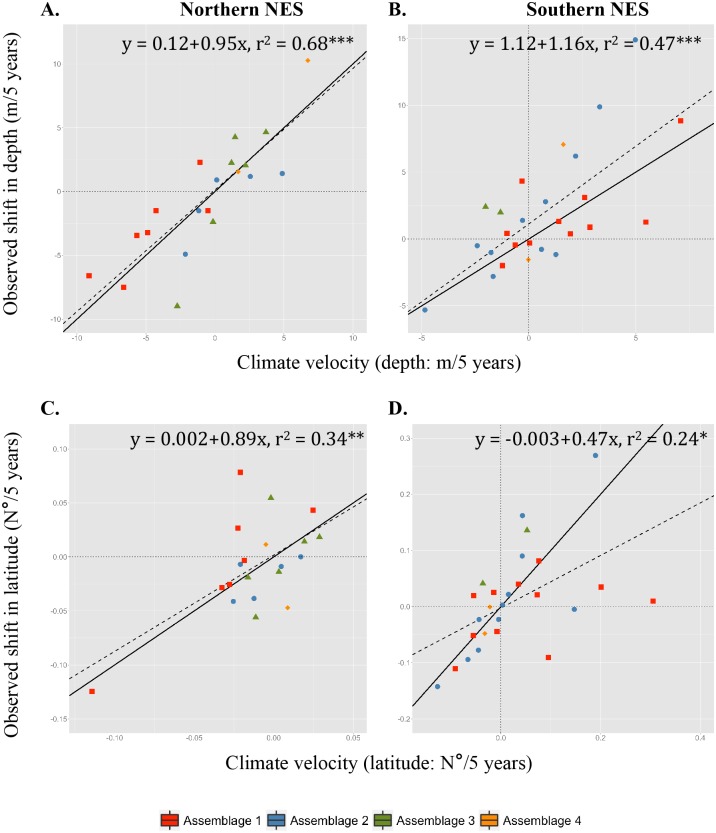
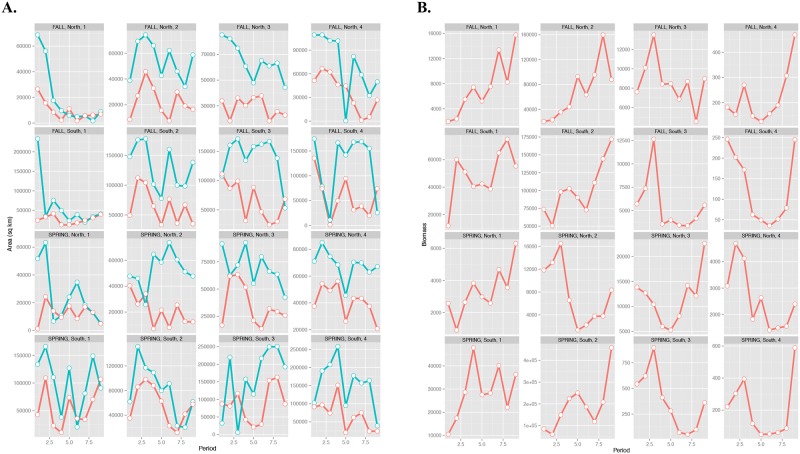
Many studies illustrate variable patterns in individual species distribution shifts in response to changing temperature. However, an assemblage, a group of species that shares a common environmental niche, will likely exhibit similar responses to climate changes, and these community-level responses may have significant implications for ecosystem function. Therefore, we examine the relationship between observed shifts of species in assemblages and regional climate velocity (i.e., the rate and direction of change of temperature isotherms). The assemblages are defined in two sub-regions of the U.S. Northeast Shelf that have heterogeneous oceanography and bathymetry using four decades of bottom trawl survey data and we explore temporal changes in distribution, spatial range extent, thermal habitat area, and biomass, within assemblages. These sub-regional analyses allow the dissection of the relative roles of regional climate velocity and local physiography in shaping observed distribution shifts. We find that assemblages of species associated with shallower, warmer waters tend to shift west-southwest and to shallower waters over time, possibly towards cooler temperatures in the semi-enclosed Gulf of Maine, while species assemblages associated with relatively cooler and deeper waters shift deeper, but with little latitudinal change. Conversely, species assemblages associated with warmer and shallower water on the broad, shallow continental shelf from the Mid-Atlantic Bight to Georges Bank shift strongly northeast along latitudinal gradients with little change in depth. Shifts in depth among the southern species associated with deeper and cooler waters are more variable, although predominantly shifts are toward deeper waters. In addition, spatial expansion and contraction of species assemblages in each region corresponds to the area of suitable thermal habitat, but is inversely related to assemblage biomass. This suggests that assemblage distribution shifts in conjunction with expansion or contraction of thermal habitat acts to compress or stretch marine species assemblages, which may respectively amplify or dilute species interactions to an extent that is rarely considered. Overall, regional differences in climate change effects on the movement and extent of species assemblages hold important implications for management, mitigation, and adaptation on the U.S. Northeast Shelf.


Conflict of interest statement

Competing Interests: The authors have declared that no competing interests exist.

Figures

Fig 1
Fig 1. Study area.
The Northeast U.S. Shelf illustrating the southern region: the Mid-Atlantic Bight and Georges Bank, and northern region: the Gulf of Maine with shaded bathymetry (meters depth).
Fig 2
Fig 2. Assemblage characteristics.
Boxplots of surface temperature, bottom temperature, and depth for each of the core species clusters in the Gulf of Maine (northern NES) or Mid-Atlantic Bight (southern NES) sampled during the NEFSC fall (top panels) and spring (bottom panels) bottom trawl surveys. Clusters in each region comprise different species, but are labeled 1 through 4 based on an increasing depth scale in each season and region.
Fig 3
Fig 3. Fall compass plot.
Bearing (0–360 degrees) and distance (km) between the centers of biomass in the first (1968–1978) and fourth (2001–2012) periods for each core species for (A) the Mid-Atlantic Bight and Georges Bank (southern NES) and (B) the Gulf of Maine (northern NES) sampled during the NEFSC fall bottom trawl surveys. Full species names corresponding to abbreviations are in S1 Table. The presence of a ‘(D)’ after an abbreviation refers to a species that has a significant deepening trend over the entire time series determined by linear regression.
Fig 4
Fig 4. Spring compass plot.
Bearing (0–360 degrees) and distance (km) between the centers of biomass in the first (1968–1978) and fourth (2001–2012) periods for each core species for (A) the Mid-Atlantic Bight and Georges Bank (southern NES) and (B) the Gulf of Maine and U.S. Scotian Shelf (northern NES) sampled during spring bottom trawl surveys. Full species names corresponding to abbreviations can be found in S1 Table. The presence of a ‘(D)’ after an abbreviation refers to a species that has a significant deepening trend over the entire time series.
Fig 5
Fig 5. Bottom and surface temperature on the U.S. Northeast Shelf.
(A) Interpolated, average (1977–2013) surface and bottom temperatures on the northeast shelf from the NEFSC spring and fall bottom trawl surveys. (B) Regional time series of bottom temperature (blue) and surface temperature (orange) computed as area-weighted means of all survey points within a given region. The horizontal lines in each panel represent the average over the reference period (1977–2013).
Fig 6
Fig 6. Fall climate velocities.
Slopes of observed versus predicted changes in depth (A, B) and latitude (C, D) for the northern NES: Gulf of Maine (A, C), and southern NES: Mid-Atlantic Bight/Georges Bank (B, D) sampled during the NEFSC fall bottom trawl surveys. Colors correspond to clusters (red: cluster 1N or 1S; blue: cluster 2N or 2S; green: cluster 3N or 3S; yellow: cluster 4N or 4S). Significance is indicated by ‘ns’: not significant; ‘*’: p < 0.05; ‘**’: p < 0.01; ‘***’: p < 0.001. The solid black line is the 1:1 relationship and the dashed black line corresponds to the linear model fit and provides a reference point for whether the clusters are moving faster or slower relative to climate velocity with respect to latitude and depth.
Fig 7
Fig 7. Spring climate velocities.
Slopes of observed versus predicted changes in depth (A, B) and latitude (C, D) for the Gulf of Maine (northern NES; A, C) and Mid-Atlantic Bight/Georges Bank (southern NES; B, D) sampled during the spring bottom trawl surveys. Colors correspond to the species clusters (red: cluster 1S; blue: cluster 2S; green: cluster 3S; yellow: cluster 4S). Significance is indicated by ‘ns’: not significant; ‘*’: p < 0.05; ‘**’: p < 0.01; ‘***’: p < 0.001. Solid black line is the 1:1 relationship and dashed black line corresponds to the linear model fit and provides a reference point for whether the clusters are moving faster or slower relative to climate velocity with respect to latitude and depth.
Fig 8
Fig 8. Assemblage spatial extent, thermal area, and biomass.
(A) Trends in five-year averages of assemblage spatial extent (blue lines) and predicted thermal habitat area (red lines). Area is defined by the kernel densities of the assemblage biomass with values greater than one standard deviation above the mean for the assemblages defined in each season and region. (B) Comparative trends five-year averages of summed biomass for each assemblage.

Similar articles

Cited by

References

    1. Root TL, Price JT, Hall KR, Schneider SH, Rosenzweig C, Pounds JA. Fingerprints of global warming on wild animals and plants. Nature. 2003;421(6918):57–60. 10.1038/nature01333 . - DOI - PubMed
    1. Parmesan C. Influences of species, latitudes and methodologies on estimates of phenological response to global warming. Global Change Biol. 2007;13:1860–72.
    1. Burrows MT, Schoeman DS, Richardson AJ, Molinos JG, Hoffmann A, Buckley LB, et al. Geographical limits to species-range shifts are suggested by climate velocity. Nature. 2014;507(7493):492–5. 10.1038/nature12976 . - DOI - PubMed
    1. Cheung WLL, Watson R, Pauly D. Signature of ocean warming in global fisheries catch. Nature. 2013;497:365–8. 10.1038/nature12156 - DOI - PubMed
    1. Nye JA, Link JS, Hare JA, Overholtz WJ. Changing spatial distribution of fish stocks in relation to climate and population size on the Northeast United States continental shelf. Marine Ecology Progress Series. 2009;393:111–29.

Publication types