. 2016 Mar 1;126(3):1093-108.
doi: 10.1172/JCI83379. Epub 2016 Feb 22.

Lymphatic endothelial cells are a replicative niche for Mycobacterium tuberculosis

Lymphatic endothelial cells are a replicative niche for Mycobacterium tuberculosis

Thomas R Lerner et al. J Clin Invest. .

Abstract

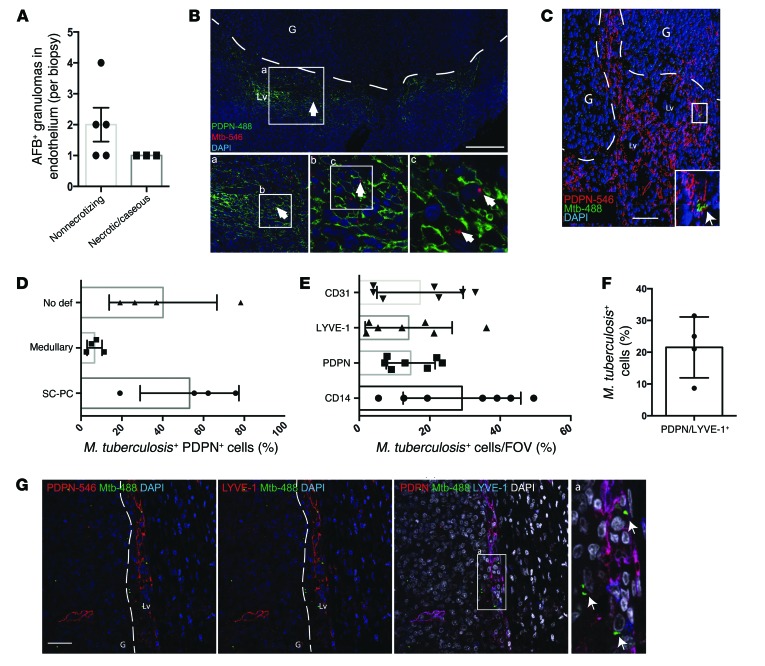
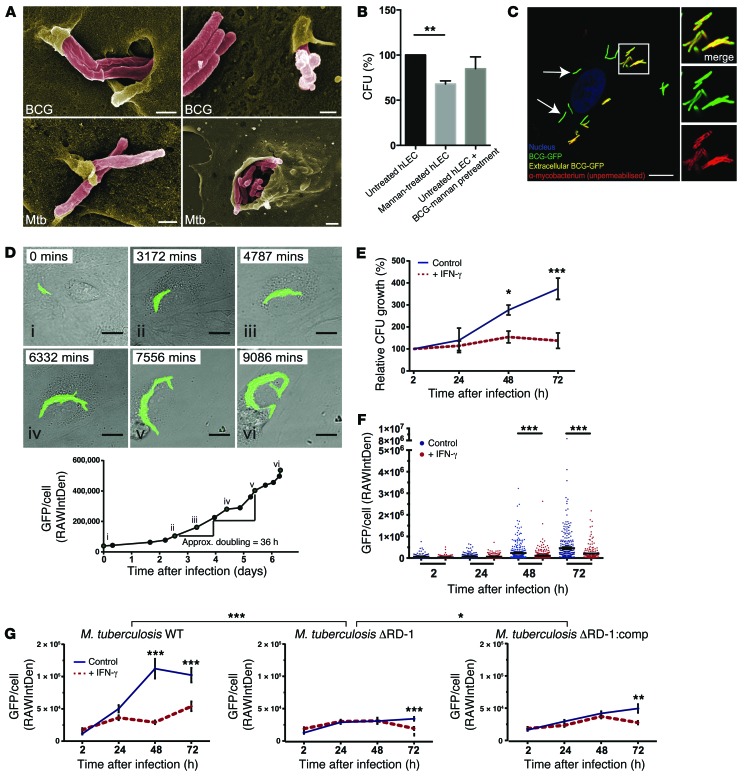
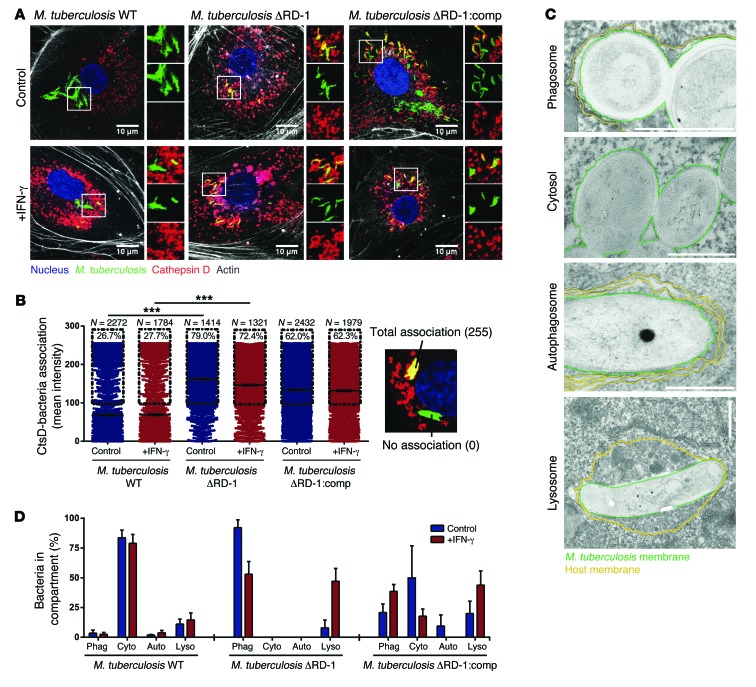
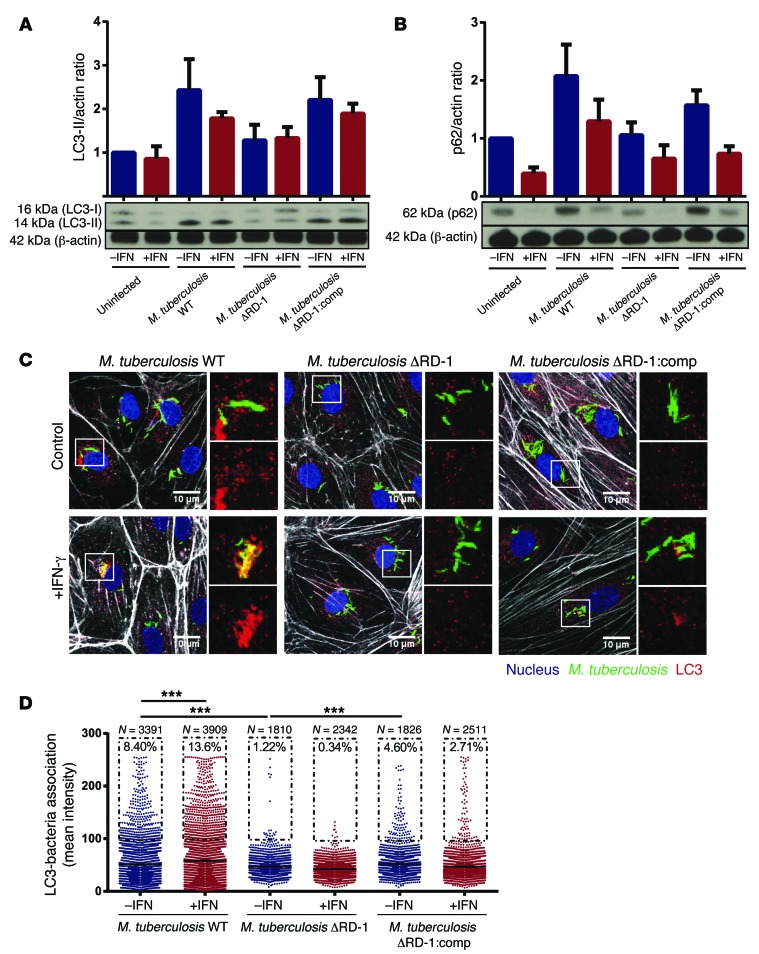
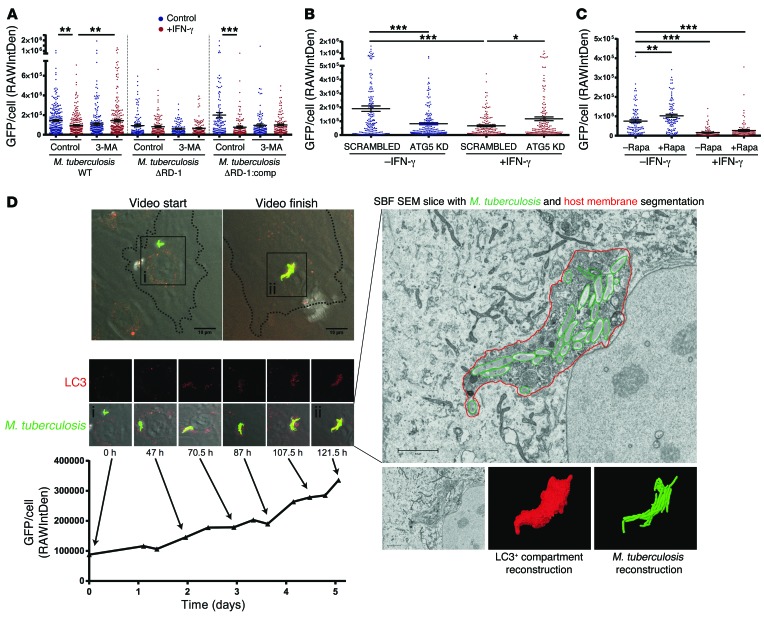
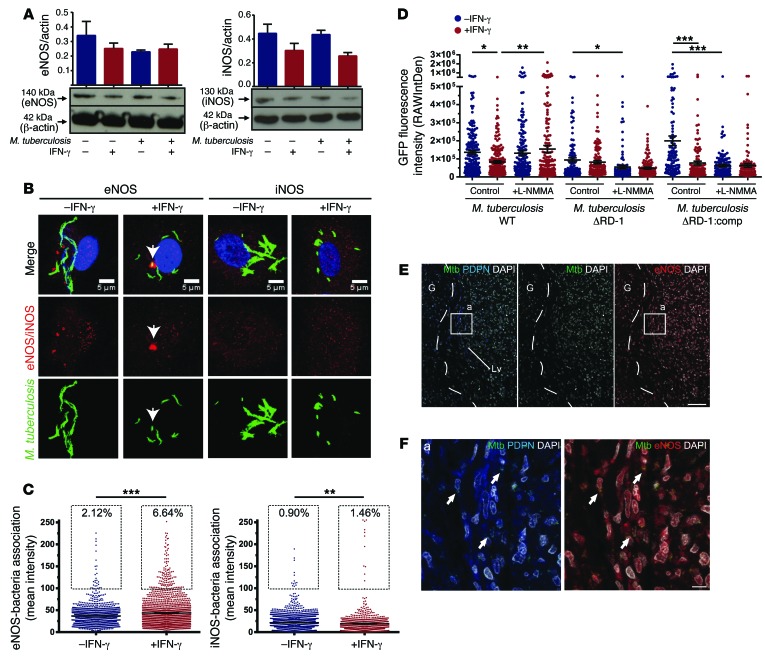
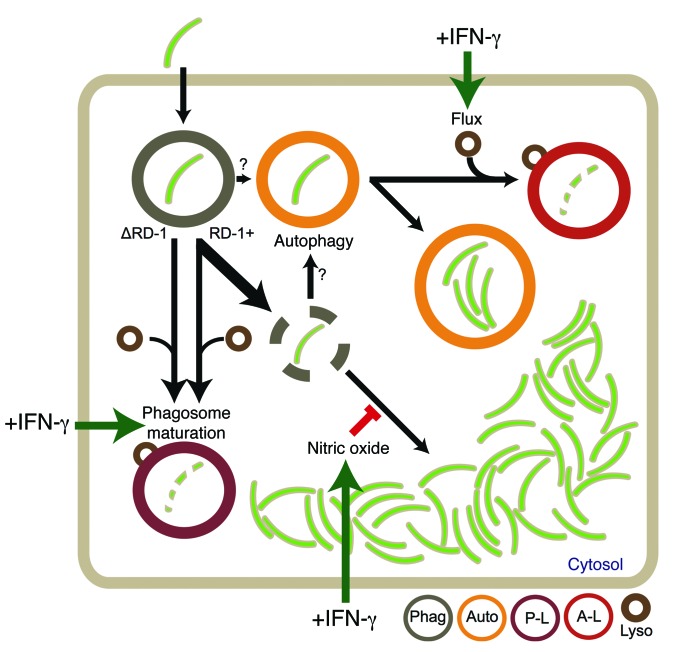
In extrapulmonary tuberculosis, the most common site of infection is within the lymphatic system, and there is growing recognition that lymphatic endothelial cells (LECs) are involved in immune function. Here, we identified LECs, which line the lymphatic vessels, as a niche for Mycobacterium tuberculosis in the lymph nodes of patients with tuberculosis. In cultured primary human LECs (hLECs), we determined that M. tuberculosis replicates both in the cytosol and within autophagosomes, but the bacteria failed to replicate when the virulence locus RD1 was deleted. Activation by IFN-γ induced a cell-autonomous response in hLECs via autophagy and NO production that restricted M. tuberculosis growth. Thus, depending on the activation status of LECs, autophagy can both promote and restrict replication. Together, these findings reveal a previously unrecognized role for hLECs and autophagy in tuberculosis pathogenesis and suggest that hLECs are a potential niche for M. tuberculosis that allows establishment of persistent infection in lymph nodes.


Figures

Figure 1
Figure 1. Primary hLECs host M. tuberculosis.
(A) The number and type of human lymph node granulomas that have AFB present within endothelial cells. Each symbol represents one biopsy. Within the 5 biopsies, there were 34 granulomas analyzed in total; 13 were positive for AFB within endothelial cells, and 21 were negative (all 21 were from 2 biopsies). (B) Representative histological sections from human patients after lymph node tissue resection surgery were stained for PDPN, M. tuberculosis, and nuclei (DAPI). Dashed line represents the border of the granuloma (G). Scale bar: 1 mm. Original magnification, ×5 (bottom left); ×3 (bottom middle and right). Sequential zooms of the top image are shown. Arrows point to examples of M. tuberculosis–infected cells. (C) VolumeJ 3D rendering of a tissue section of a human lymph node. Two granulomas are visible, with the dashed line representing their borders. The section was stained for PDPN–Alexa Fluor 546 (PDPN-546), M. tuberculosis–Alexa Fluor 488 (Mtb-488), and nuclei (DAPI). Lv, lymphatic vessels. Scale bar: 40 μm. Original magnification, ×10 (inset). (D) Semiquantitative analysis of the anatomical localization of the LECs positive for M. tuberculosis. SC-PC, subcapsular/paracortical; no def, not defined. (E) Quantitative analysis of the percentage of infected cells per field of view (FOV) for CD14 (myelocytic cells) and PDPN, LYVE-1, and CD31 (lymphatic and vascular endothelial cells). Seven lymph node samples were analyzed. (F) Quantitative analysis of the percentage of PDPN+/LYVE-1+ cells positive for M. tuberculosis. (G) Representative images showing PDPN+/LYVE-1+ cells containing M. tuberculosis (white arrows). Scale bar: 40 μm. Original magnification, ×17 (inset).
Figure 2
Figure 2. M. tuberculosis RD1-dependent replication in hLECs is restricted by IFN-γ.
(A) SEM of hLECs after 3 hours of infection with M. bovis BCG (BCG) or M. tuberculosis WT (false-colored red). Scale bar: 500 nm (top row and bottom left); 1 μm (bottom right). (B) Untreated hLECs were infected with BCG, and the intracellular CFU was measured after 5 hours (100%). hLECs treated with the MR ligand mannan for 2 hours had significantly reduced uptake of BCG. BCG pretreated with mannan was used as a negative control. Error bars represent mean ± SEM. (C) Representative image showing EGFP-BCG (white arrows, green fluorescence) and extracellular (yellow merged fluorescence) mycobacteria detected with an anti-mycobacterium antibody (red fluorescence) after 5 hours of infection. Scale bar: 10 μm. Original magnification, ×5 (inset). (D) Stills from Supplemental Video 1. Measurement of M. tuberculosis WT growth by live-cell imaging, as shown by EGFP intensity. Scale bar: 10 μm. (E) Growth of M. tuberculosis WT measured by CFU at 2 to 72 hours after infection in IFN-γ–activated (red dashed line) or resting (blue line) conditions. Growth is expressed as percentage increase from the 2-hour time point. Error bars represent mean ± SEM of 4 biological replicates. (F) Growth of M. tuberculosis WT inside hLECs measured by EGFP fluorescence per cell. IFN-γ–activated (red symbols) or resting (blue symbols) cells were fixed at 2, 24, 48, and 72 hours after infection. Symbols represent individual infected hLECs, and black bars represent mean ± SEM of 4 biological replicates. (G) Growth of M. tuberculosis WT, M. tuberculosis ΔRD1, and M. tuberculosis ΔRD1:comp inside hLECs measured by GFP fluorescence per cell, as in F. Error bars represent mean ± SEM of 3 biological replicates. *P < 0.05, **P < 0.01, ***P < 0.001, 1-way ANOVA with Tukey’s post-hoc test.
Figure 3
Figure 3. Subcellular localization of M. tuberculosis reveals a heterogeneous localization in hLECs.
(A) Representative images of hLECs infected with M. tuberculosis WT, M. tuberculosis ΔRD1, or M. tuberculosis ΔRD1:comp at 48 hours after infection in the presence or absence of IFN-γ. Images show bacteria expressing EGFP, endogenous cathepsin D–Alexa Fluor 546, F-actin labeled with Alexa Fluor 633–phalloidin, and DNA labeled with DAPI. Scale bar: 10 μm. Original magnification, ×5 (inset). (B) Quantification of the association of cathepsin D with M. tuberculosis WT, M. tuberculosis ΔRD1, or M. tuberculosis ΔRD1:comp from images such as those in A at 48 hours after infection. N is the total number of individual bacterial entities measured in each condition, and the percentages refer to the proportion of the cathepsin D+ population (i.e., the population within each dotted box). Error bars represent mean ± SEM from 3 biological replicates. ***P < 0.001, 1-way ANOVA with Tukey’s post-hoc test. (C) Example TEM images representing the observed localization of M. tuberculosis WT, M. tuberculosis ΔRD1, or M. tuberculosis ΔRD1:comp in hLECs at 48 hours after infection. “Phagosome” represents bacteria with a single surrounding host membrane; “Cytosol” represents bacteria with no surrounding host membranes; “Autophagosome” represents bacteria found with 2 or more surrounding host membranes; and “Lysosome” represents surrounded by a host membrane filled with vesicles. Scale bar: 500 nm. (D) Quantification of M. tuberculosis WT, M. tuberculosis ΔRD1, or M. tuberculosis ΔRD1:comp subcellular localizations within hLECs at 48 hours after infection with in activated (red bars) or resting (blue bars) cells. Quantification was performed by stereological analysis of TEM images of resin sections of hLECs. Error bars represent mean ± SEM from at least 2 biological replicates.
Figure 4
Figure 4. Autophagy induction by M. tuberculosis and localization in autophagosomes is RD1 dependent.
(A) Western blot and quantification of whole-cell total protein levels of LC3-II at 48 hours after infection (normalized to actin) in uninfected, M. tuberculosis WT, M. tuberculosis ΔRD1, or M. tuberculosis ΔRD1:comp infected hLEC samples in the presence (red bars) or absence (blue bars) of IFN-γ. Data represent mean ± SEM of at least 3 biological replicates. (B) Same as in A, but p62 levels were measured. (C) Representative images of hLECs infected with M. tuberculosis WT, M. tuberculosis ΔRD1, or M. tuberculosis ΔRD1:comp at 48 hours after infection in the presence or absence of IFN-γ. Images show bacteria expressing EGFP, endogenous LC3-Cy3, F-actin labeled with Alexa Fluor 633–phalloidin, and DNA labeled with DAPI. Scale bar: 10 μm. Original magnification, ×5 (inset). (D) Quantification of the association of LC3 with M. tuberculosis WT, M. tuberculosis ΔRD1, or M. tuberculosis ΔRD1:comp from images such as those in D at 48 hours after infection. N is the total number of individual bacterial entities measured in each condition, and the percentages refer to the proportion of the LC3+ population (i.e., the population within each dotted box). Error bars represent mean ± SEM from 3 biological replicates. ***P < 0.001, 1-way ANOVA with Tukey’s post-hoc test.
Figure 5
Figure 5. Autophagy promotes M. tuberculosis growth in resting hLEC.
(A) The growth (GFP fluorescence per cell) of M. tuberculosis WT, M. tuberculosis ΔRD1, or M. tuberculosis ΔRD1:comp after 48 hours of infection in hLECs treated or not (control) with 10 mM 3-MA in activated (red symbols) or resting (blue symbols) cells. Error bars represent mean ± SEM of at least 3 biological replicates. (B) The growth (EGFP fluorescence per cell) of M. tuberculosis WT after 48 hours of infection in control cells (SCRAMBLED) or cells with reduced ATG5 protein level (ATG5 KD) in resting (blue symbols) or activating (red symbols) conditions. Error bars represent mean ± SEM of 3 biological replicates. (C) The growth (EGFP fluorescence per cell) of M. tuberculosis WT after 48 hours of infection in control cells (–Rapa) or cells treated with 500 nM rapamycin (+Rapa) in resting (blue symbols) or activating (red symbols) conditions. Error bars represent mean ± SEM of 3 biological replicates. NS = P > 0.05; *P < 0.05, **P < 0.01, ***P < 0.001, 1-way ANOVA with Tukey’s post-hoc test. (D) Images taken from live-cell imaging of LC3-RFP–expressing hLECs infected with M. tuberculosis WT over 5 days in resting conditions. Scale bar: 10 μm. GFP fluorescence was plotted to show growth of the bacteria in an LC3+ compartment. The structure was relocated for serial block-face SEM analysis using a correlative workflow, and the serial electron images were manually segmented and rendered to create a 3D model of the bacteria (green) and the limiting membrane (red). Scale bar: 2.5 μm. See also Supplemental Videos 2 and 3.
Figure 6
Figure 6. NO production restricts the growth of cytosolic M. tuberculosis.
(A) Western blot and quantification of the whole-cell protein levels of eNOS and iNOS at 48 hours after infection (normalized to actin) in uninfected and M. tuberculosis WT–infected activated (red bars) or resting (blue bars) hLEC samples. Error bars represent mean ± SEM of 4 biological replicates. (B) Images showing representative areas of M. tuberculosis WT–infected hLECs after 48 hours of infection in activated or resting conditions. Images show bacteria expressing EGFP, endogenous eNOS– or iNOS–Alexa Fluor 546, and DNA labeled with DAPI. Arrows show bacteria and eNOS colocalization. Scale bar: 5 μm. (C) Quantification of the association of eNOS (top panel) and iNOS (bottom panel) with M. tuberculosis WT from images such as those in C at 48 hours after infection. The percentages refers to the proportion of the eNOS+/iNOS+ population (i.e., the population within each dotted box). Error bars represent mean ± SEM from at least 4 biological replicates. **P < 0.01, ***P < 0.001, 2-tailed Student’s t test. (D) The growth (GFP fluorescence per cell) of M. tuberculosis WT, M. tuberculosis ΔRD1, or M. tuberculosis ΔRD1:comp after 48 hours of infection in untreated (control) hLECs or hLECs treated with 250 μM l-NMMA in activated (red symbols) or resting (blue symbols) conditions. Error bars represent mean ± SEM of at least 3 biological replicates. *P < 0.05, **P < 0.01, ***P < 0.001, 1-way ANOVA with Tukey’s post-hoc test. (E) Representative histological section of human lymph nodes stained for PDPN, M. tuberculosis, eNOS, and nuclei (DAPI). The dotted line indicates the granulomatous area. Scale bar: 50 μm. (F) Images of the lymphatic vessel region showing localization of M. tuberculosis in PDPN+ and eNOS+ cells (white arrows). Scale bar: 10 μm.
Figure 7
Figure 7. Proposed model of M. tuberculosis dynamics in infected hLECs.
M. tuberculosis (green) are phagocytosed by hLECs and initially reside in the phagosome (brown). At 24 hours after infection, 70% to 90% of the bacteria escape into the cytosol, but this is strictly RD1 dependent. M. tuberculosis lacking RD1 and a small fraction of RD1+ M. tuberculosis are trafficked directly to phagolysosomes (P-L) and suffer restricted growth/killing (this process is also induced by IFN-γ). In the cytosol, M. tuberculosis can readily replicate, but this is restricted when IFN-γ is present via the relocalization of intracellular eNOS to generate NO in the immediate vicinity of the bacteria. A small population of M. tuberculosis also enters the autophagy pathway in an RD1-dependent manner, directly from the phagosome and/or via the cytosol. M. tuberculosis induces autophagosome formation and can replicate in an LC3+ compartment by blocking fusion of lysosomes with the autophagosome. Upon activation of hLECs by IFN-γ, autophagosome-lysosome fusion is restored (i.e., increased autophagic flux), and M. tuberculosis growth is restricted in autophagolysosomes (A-L).

References

    1. Sharma SK, Mohan A. Extrapulmonary tuberculosis. Indian J Med Res. 2004;120(4):316–353. - PubMed
    1. Behr MA, Waters WR. Is tuberculosis a lymphatic disease with a pulmonary portal? Lancet Infect Dis. 2014;14(4):250–255. - PubMed
    1. O’Garra A, Redford PS, McNab FW, Bloom CI, Wilkinson RJ, Berry MP. The immune response in tuberculosis. Annu Rev Immunol. 2013;31:475–527. doi: 10.1146/annurev-immunol-032712-095939. - DOI - PubMed
    1. Cooper AM, Dalton DK, Stewart TA, Griffin JP, Russell DG, Orme IM. Disseminated tuberculosis in interferon gamma gene-disrupted mice. J Exp Med. 1993;178(6):2243–2247. doi: 10.1084/jem.178.6.2243. - DOI - PMC - PubMed
    1. Al-Muhsen S, Casanova JL. The genetic heterogeneity of mendelian susceptibility to mycobacterial diseases. J Allergy Clin Immunol. 2008;122(6):1043–1051. doi: 10.1016/j.jaci.2008.10.037. - DOI - PubMed

Publication types