. 2016 Mar;26(3):304-19.
doi: 10.1038/cr.2016.23. Epub 2016 Feb 23.

Single-cell triple omics sequencing reveals genetic, epigenetic, and transcriptomic heterogeneity in hepatocellular carcinomas

Affiliations

Single-cell triple omics sequencing reveals genetic, epigenetic, and transcriptomic heterogeneity in hepatocellular carcinomas

Yu Hou et al. Cell Res. 2016 Mar.

Abstract

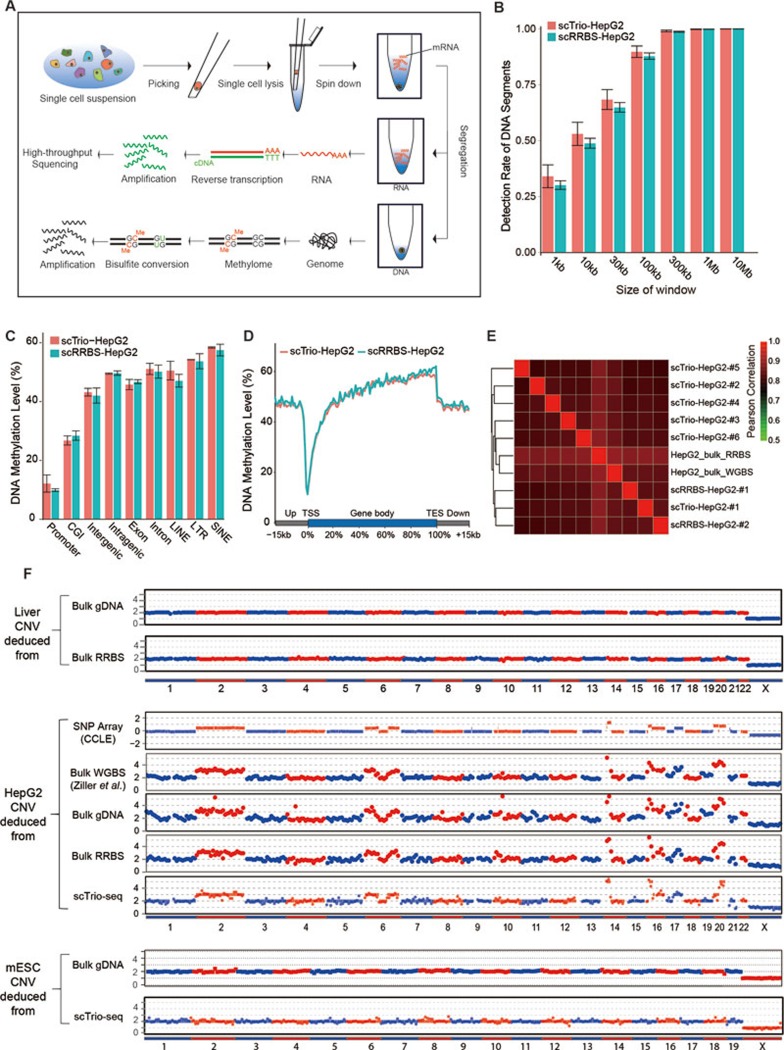
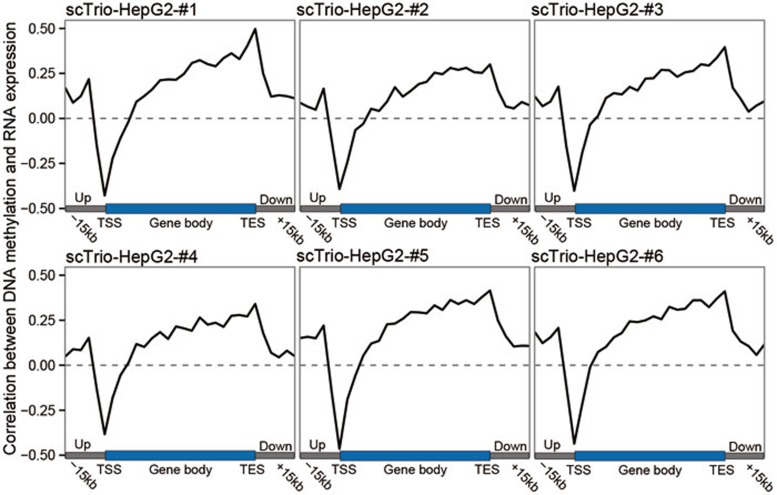
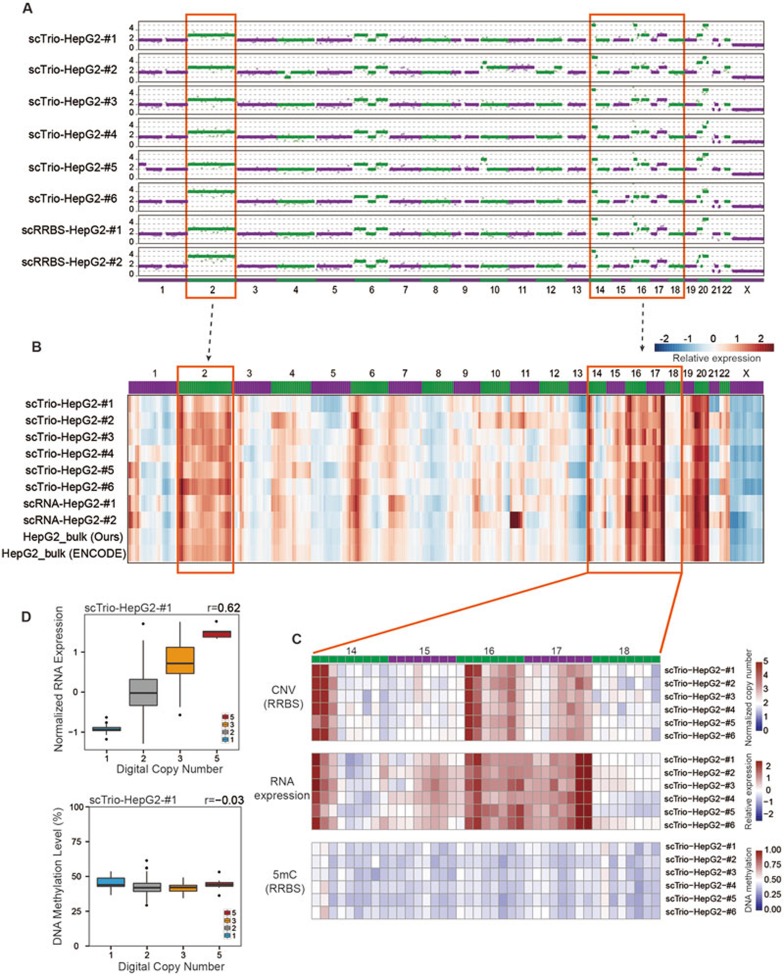
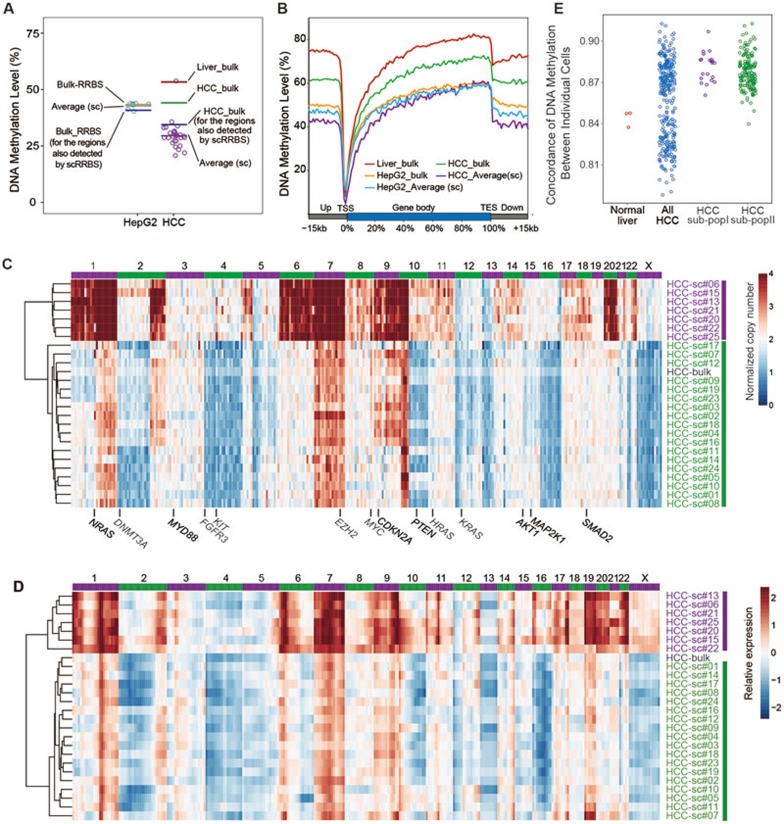
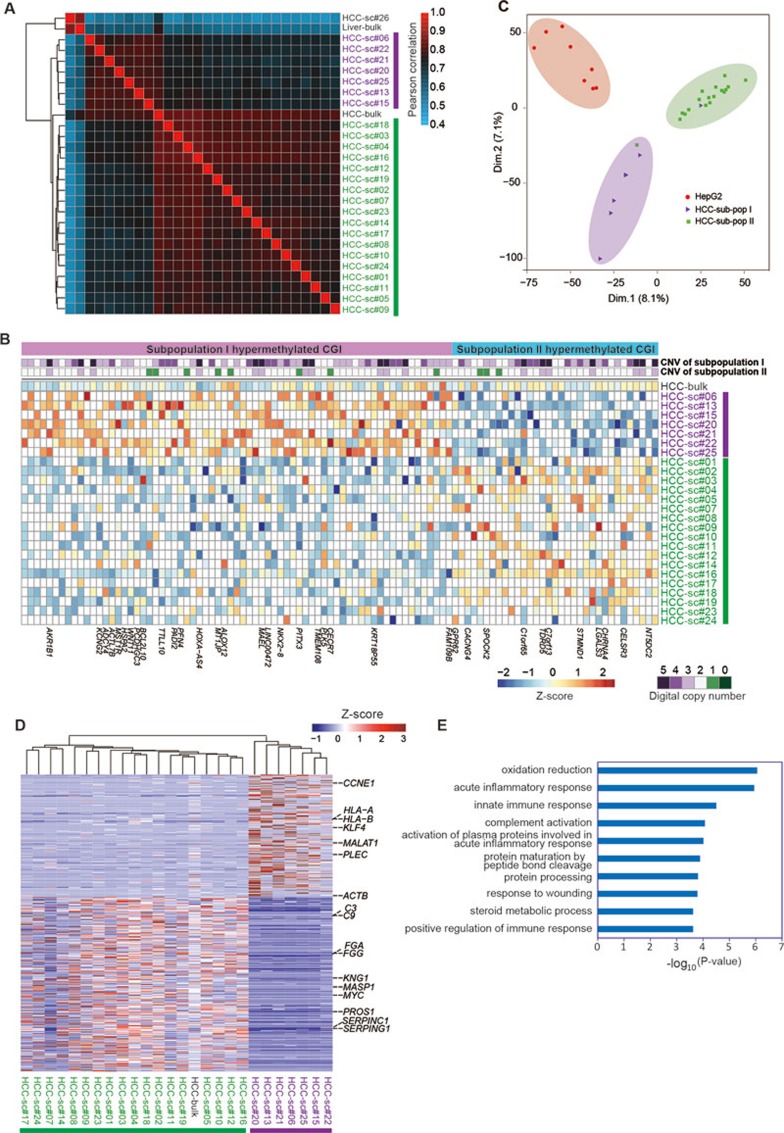
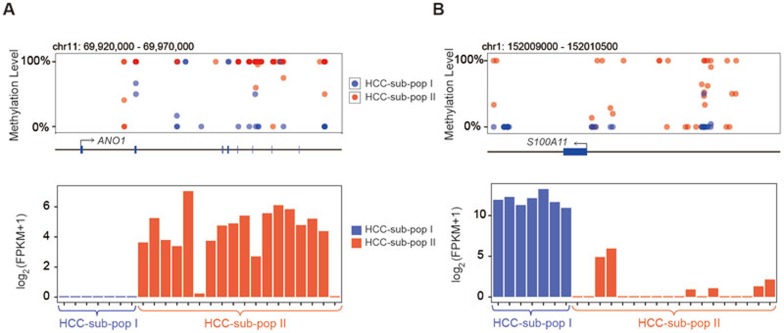
Single-cell genome, DNA methylome, and transcriptome sequencing methods have been separately developed. However, to accurately analyze the mechanism by which transcriptome, genome and DNA methylome regulate each other, these omic methods need to be performed in the same single cell. Here we demonstrate a single-cell triple omics sequencing technique, scTrio-seq, that can be used to simultaneously analyze the genomic copy-number variations (CNVs), DNA methylome, and transcriptome of an individual mammalian cell. We show that large-scale CNVs cause proportional changes in RNA expression of genes within the gained or lost genomic regions, whereas these CNVs generally do not affect DNA methylation in these regions. Furthermore, we applied scTrio-seq to 25 single cancer cells derived from a human hepatocellular carcinoma tissue sample. We identified two subpopulations within these cells based on CNVs, DNA methylome, or transcriptome of individual cells. Our work offers a new avenue of dissecting the complex contribution of genomic and epigenomic heterogeneities to the transcriptomic heterogeneity within a population of cells.


Figures

Figure 1
Figure 1
Sensitivity and reliability of the scTrio-seq technique. (A) A flow chart illustrating the scTrio-seq technique. After a single cell was lysed with mild lysis buffer, the lysis product was centrifuged. The supernatant was transferred to a new tube for transcriptome sequencing analyses, while the pellet (containing the nucleus) was bisulfite-converted for genome (CNVs) and epigenome sequencing analyses. (B) Comparing the rate of detection of DNA segments in HepG2 scTrio-seq data and HepG2 scRRBS data. The total DNA segments are those that can be detected in the bulk HepG2 RRBS data. (C) Comparing the average DNA methylation levels of CpG sites in different genomic regions between HepG2 scTrio-seq and HepG2 scRRBS data. (D) DNA methylation pattern in gene body regions as determined from HepG2 scTrio-seq data and RRBS data. The averaged DNA methylation level of CpG sites is calculated from all RefSeq genes in regions from the TSSs to TESs and their 15-kb flanking regions. (E) Unsupervised hierarchical clustering analysis based on Pearson correlations between global CpG methylation levels of different HepG2 samples. (F) CNV deduction results at a 10-Mb resolution. The normalized copy number values (red or blue dots) for the bulk genome DNA sequencing data and bulk RRBS data are shown. For the scTrio-seq data, HMM fitting results (red or blue segments) are also shown.
Figure 2
Figure 2
The relationships between DNA methylation and gene expression in single cells. The Pearson correlations between DNA methylation and gene expression are calculated in different regions on gene body (from TSS to TES) and their 15-kb flanking regions in scTrio-seq data of HepG2 cells.
Figure 3
Figure 3
The relationships between genome (CNVs), DNA methylation, and gene expression in single cells. (A) CNV deductions of single HepG2 Trio-seq data or scRRBS data at a 10-Mb resolution. The purple or green dots represent the normalized copy numbers and the purple or green segments represent the integer copy number fitted by HMM. (B) Heat map of normalized relative gene expression levels in 10-Mb genomic windows. The genes are ranked according to their genomic positions. The relative expression values (normalized to liver bulk RNA-seq data) of all the genes in each 10-Mb window of each sample are represented by blue to red colors. (C) Relationship between CNV patterns, DNA methylation, and gene expression within single cells. Normalized DNA methylation value is compared with bulk liver RRBS data. Zoom-in pictures represent the normalized copy number, relative RNA expression, and DNA methylation values of the same 10-Mb window from the regions from Chr.14 to Chr.18. (D) The correlations between the copy numbers and gene expression (or DNA methylation levels). The boxplot shows the distributions of each 10-Mb window's relative expression level (or DNA methylation level) within each copy-number group. The Pearson correlation coefficient is shown at the top right corner. Note that there is no 10-Mb DNA fragments with digital copy number of 4.
Figure 4
Figure 4
ScTrio-seq analyses of single HCC cells. (A) Global DNA methylation levels of CpG sites of HepG2 cells and HCC cells. Each circle represents the DNA methylation of one single cell, and the lines represent the bulk or average (single-cell) results. HCC bulk (for the regions also detected in scRRBS) represents the DNA methylation of HCC-bulk cells, the calculation for which only includes regions that are also detected in the HCC scTrio-seq data. (B) Average CpG methylation levels in gene bodies (from TSSs to TESs) of all RefSeq genes and their 15-kb flanking regions in HepG2 cells and HCC cells. (C) Heat map showing normalized copy-number values of 10-Mb windows deduced from RRBS data of scTrio-seq analysis. The HCC cells are clustered based on their CNV patterns. (D) Heat map showing relative gene expression levels in each 10-Mb genomic window. The HCC cells are clustered based on their expression levels in each genomic window. (E) The concordance of the DNA methylation of normal liver cells and that of HCC cells. Each dot shows the Pearson correlation coefficient between any two single cells within each group.
Figure 5
Figure 5
Differences in triple omics between subpopulation I and II of HCC cells. (A) Unsupervised hierarchical clustering analysis based on the Pearson correlations of CpG methylation levels between different HCC samples. A “pairwise” method is used when calculating the Pearson correlations. (B) Differentially methylated CGIs (dmCGIs) between subpopulation I and subpopulation II HCC cells. The DNA methylation level of each CGI is normalized using the Z-score. The white squares represent the CGIs that are not detected in each sample. The genes with a dmCGI within the ±1 kb regions of their TSS regions are labeled at the bottom. (C) Principal component analysis of the HepG2 and HCC cells according to the expression level of RefSeq gene. (D) Hierarchical clustering of Pearson correlation between single HCC single cells considering the genes that are differently expressed between subpopulation I and subpopulation II. The expression level of each gene is normalized using the Z-score. The genes in the complement and coagulation cascades and several other cancer-related genes are marked. (E) Gene Ontology (GO) analyses of the genes whose expressions are downregulated in subpopulation I.
Figure 6
Figure 6
Differentially methylated regions on gene promoter and gene body regulate differentially expressed genes. (A) The DNA methylation levels on the gene body regions of ANO1 (NM_018043) are much lower in subpopulation I HCC cells. Consequently, ANO1 (NM_018043) has lower expression levels (log2 (FPKM + 1)) in subpopulation I cells. (B) The DNA methylation levels on the promoter regions of S100A11 (NM_005620) are much lower in subpopulation I HCC cells. Consequently, S100A11 (NM_005620) has higher expression levels (log2 (FPKM + 1)) in subpopulation I cells.

Similar articles

Cited by

References

    1. Wen L, Tang F. Reconstructing complex tissues from single-cell analyses. Cell 2014; 157:771–773. - PubMed
    1. Shapiro E, Biezuner T, Linnarsson S. Single-cell sequencing-based technologies will revolutionize whole-organism science. Nat Rev Genet 2013; 14:618–630. - PubMed
    1. Ramskold D, Luo S, Wang YC, et al. Full-length mRNA-Seq from single-cell levels of RNA and individual circulating tumor cells. Nat Biotechnol 2012; 30:777–782. - PMC - PubMed
    1. Hashimshony T, Wagner F, Sher N, Yanai I. CEL-Seq: single-cell RNA-Seq by multiplexed linear amplification. Cell Rep 2012; 2:666–673. - PubMed
    1. Jaitin DA, Kenigsberg E, Keren-Shaul H, et al. Massively parallel single-cell RNA-seq for marker-free decomposition of tissues into cell types. Science 2014; 343:776–779. - PMC - PubMed

Publication types