

Decoding three-dimensional reaching movements using electrocorticographic signals in humans
- PMID: 26902372
- PMCID: PMC5535759
- DOI: 10.1088/1741-2560/13/2/026021
Decoding three-dimensional reaching movements using electrocorticographic signals in humans
Abstract
Objective: Electrocorticography (ECoG) signals have emerged as a potential control signal for brain-computer interface (BCI) applications due to balancing signal quality and implant invasiveness. While there have been numerous demonstrations in which ECoG signals were used to decode motor movements and to develop BCI systems, the extent of information that can be decoded has been uncertain. Therefore, we sought to determine if ECoG signals could be used to decode kinematics (speed, velocity, and position) of arm movements in 3D space.
Approach: To investigate this, we designed a 3D center-out reaching task that was performed by five epileptic patients undergoing temporary placement of ECoG arrays. We used the ECoG signals within a hierarchical partial-least squares (PLS) regression model to perform offline prediction of hand speed, velocity, and position.
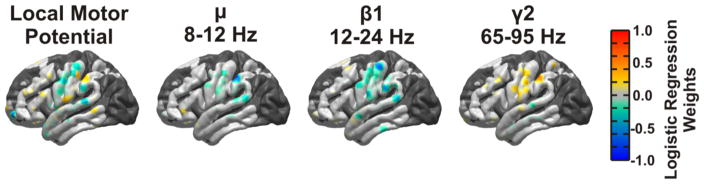
Main results: The hierarchical PLS regression model enabled us to predict hand speed, velocity, and position during 3D reaching movements from held-out test sets with accuracies above chance in each patient with mean correlation coefficients between 0.31 and 0.80 for speed, 0.27 and 0.54 for velocity, and 0.22 and 0.57 for position. While beta band power changes were the most significant features within the model used to classify movement and rest, the local motor potential and high gamma band power changes, were the most important features in the prediction of kinematic parameters.
Significance: We believe that this study represents the first demonstration that truly three-dimensional movements can be predicted from ECoG recordings in human patients. Furthermore, this prediction underscores the potential to develop BCI systems with multiple degrees of freedom in human patients using ECoG.
Figures


Similar articles
-
Reconstruction of reaching movement trajectories using electrocorticographic signals in humans.PLoS One. 2017 Sep 20;12(9):e0182542. doi: 10.1371/journal.pone.0182542. eCollection 2017. PLoS One. 2017. PMID: 28931054 Free PMC article.
-
Unilateral, 3D Arm Movement Kinematics Are Encoded in Ipsilateral Human Cortex.J Neurosci. 2018 Nov 21;38(47):10042-10056. doi: 10.1523/JNEUROSCI.0015-18.2018. Epub 2018 Oct 9. J Neurosci. 2018. PMID: 30301759 Free PMC article.
-
A piecewise probabilistic regression model to decode hand movement trajectories from epidural and subdural ECoG signals.J Neural Eng. 2018 Jun;15(3):036020. doi: 10.1088/1741-2552/aab290. Epub 2018 Feb 27. J Neural Eng. 2018. PMID: 29485407
-
A Review of Motor Brain-Computer Interfaces Using Intracranial Electroencephalography Based on Surface Electrodes and Depth Electrodes.IEEE Trans Neural Syst Rehabil Eng. 2024;32:2408-2431. doi: 10.1109/TNSRE.2024.3421551. Epub 2024 Jul 4. IEEE Trans Neural Syst Rehabil Eng. 2024. PMID: 38949928 Review.
-
Neuroprosthetic limb control with electrocorticography: approaches and challenges.Annu Int Conf IEEE Eng Med Biol Soc. 2014;2014:5212-5. doi: 10.1109/EMBC.2014.6944800. Annu Int Conf IEEE Eng Med Biol Soc. 2014. PMID: 25571168 Review.
Cited by
-
Prediction of movement intention using connectivity within motor-related network: An electrocorticography study.PLoS One. 2018 Jan 24;13(1):e0191480. doi: 10.1371/journal.pone.0191480. eCollection 2018. PLoS One. 2018. PMID: 29364932 Free PMC article.
-
Impact of dataset size and long-term ECoG-based BCI usage on deep learning decoders performance.Front Hum Neurosci. 2023 Mar 16;17:1111645. doi: 10.3389/fnhum.2023.1111645. eCollection 2023. Front Hum Neurosci. 2023. PMID: 37007675 Free PMC article.
-
Dissociative and prioritized modeling of behaviorally relevant neural dynamics using recurrent neural networks.Nat Neurosci. 2024 Oct;27(10):2033-2045. doi: 10.1038/s41593-024-01731-2. Epub 2024 Sep 6. Nat Neurosci. 2024. PMID: 39242944 Free PMC article.
-
Defining Surgical Terminology and Risk for Brain Computer Interface Technologies.Front Neurosci. 2021 Mar 26;15:599549. doi: 10.3389/fnins.2021.599549. eCollection 2021. Front Neurosci. 2021. PMID: 33867912 Free PMC article.
-
Decoding Native Cortical Representations for Flexion and Extension at Upper Limb Joints Using Electrocorticography.IEEE Trans Neural Syst Rehabil Eng. 2019 Feb;27(2):293-303. doi: 10.1109/TNSRE.2019.2891362. Epub 2019 Jan 7. IEEE Trans Neural Syst Rehabil Eng. 2019. PMID: 30624221 Free PMC article.
References
-
- Anderson NR, Blakely T, Schalk G, Leuthardt EC, Moran DW. Electrocorticographic (ECoG) correlates of human arm movements. Exp Brain Res. 2012;223(1):1–10. - PubMed
-
- Bjornsson CS, Oh SJ, Al-Kofahi YA, Lim YJ, Smith KL, Turner JN, De S, Roysam B, Shain W, Kim SJ. Effects of insertion conditions on tissue strain and vascular damage during neuroprosthetic device insertion. J Neural Eng. 2006;3(3):196–207. - PubMed
-
- Blankertz B, Tomioka R, Lemm S, Kawanabe M, Muller KR. Optimizing spatial filters for robust EEG single-trial analysis. Signal Processing Magazine, IEEE. 2008;25(1):41–56.
-
- Brindley GS, Craggs MD. The electrical activity in the motor cortex that accompanies voluntary movement. J Physiol. 1972;223(1):28P–29P. - PubMed
Publication types
MeSH terms
Grants and funding
LinkOut - more resources
Full Text Sources
Other Literature Sources