. 2016 Apr 22;84(5):1403-1412.
doi: 10.1128/IAI.01522-15. Print 2016 May.

Profoundly Reduced CD1c+ Myeloid Dendritic Cell HLA-DR and CD86 Expression and Increased Tumor Necrosis Factor Production in Experimental Human Blood-Stage Malaria Infection

Affiliations

Profoundly Reduced CD1c+ Myeloid Dendritic Cell HLA-DR and CD86 Expression and Increased Tumor Necrosis Factor Production in Experimental Human Blood-Stage Malaria Infection

Jessica R Loughland et al. Infect Immun. .

Abstract

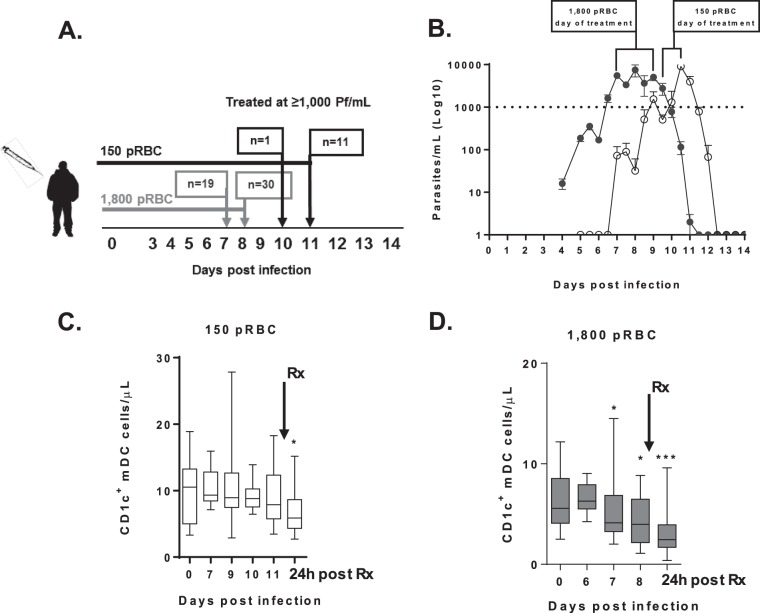
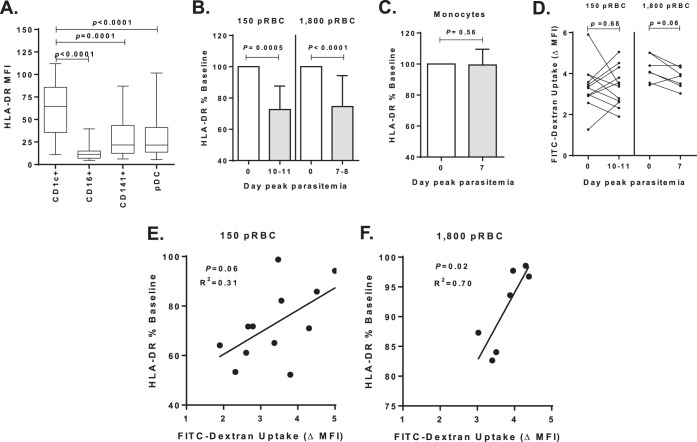
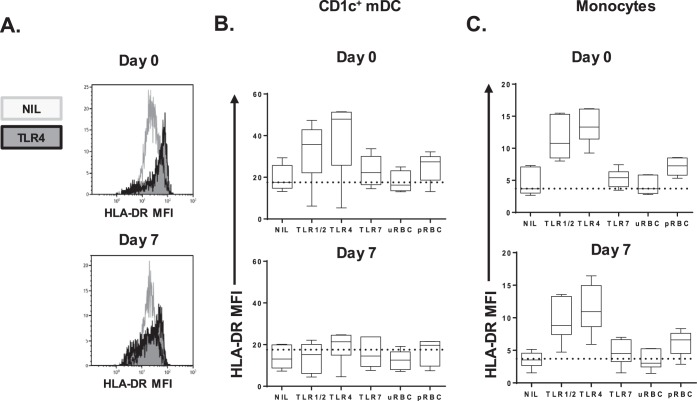
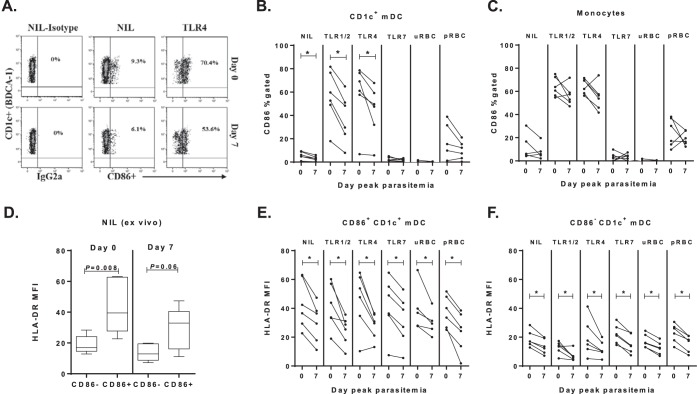
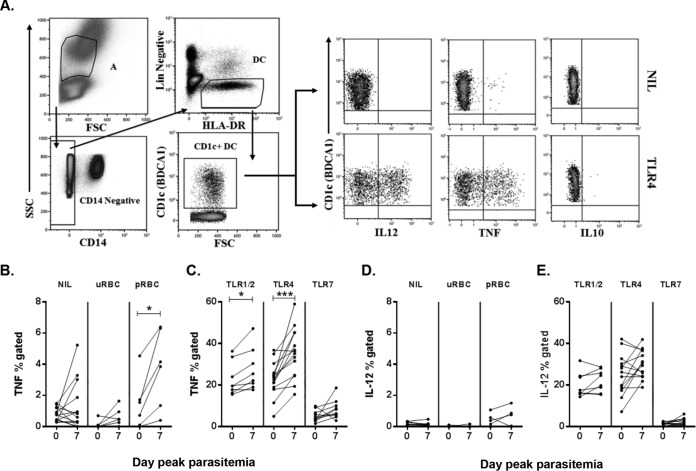
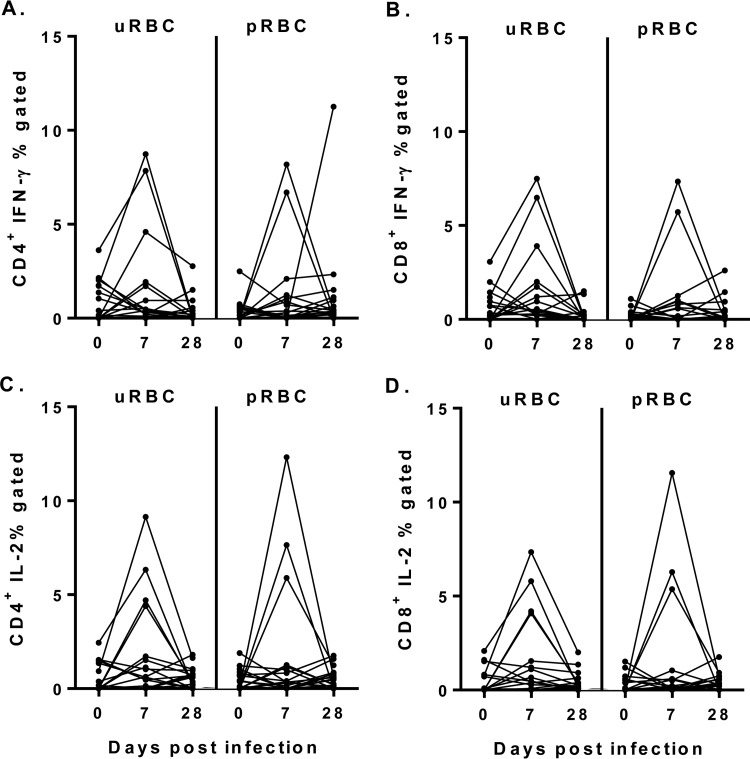
Dendritic cells (DCs) are sentinels of the immune system that uniquely prime naive cells and initiate adaptive immune responses. CD1c (BDCA-1) myeloid DCs (CD1c(+) mDCs) highly express HLA-DR, have a broad Toll-like receptor (TLR) repertoire, and secrete immune modulatory cytokines. To better understand immune responses to malaria, CD1c(+) mDC maturation and cytokine production were examined in healthy volunteers before and after experimental intravenous Plasmodium falciparum infection with 150- or 1,800-parasite-infected red blood cells (pRBCs). After either dose, CD1c(+) mDCs significantly reduced HLA-DR expression in prepatent infections. Circulating CD1c(+) mDCs did not upregulate HLA-DR after pRBC or TLR ligand stimulation and exhibited reduced CD86 expression. At peak parasitemia, CD1c(+) mDCs produced significantly more tumor necrosis factor (TNF), whereas interleukin-12 (IL-12) production was unchanged. Interestingly, only the 1,800-pRBC dose caused a reduction in the circulating CD1c(+) mDC count with evidence of apoptosis. The 1,800-pRBC dose produced no change in T cell IFN-γ or IL-2 production at peak parasitemia or at 3 weeks posttreatment. Overall, CD1c(+) mDCs are compromised by P. falciparum exposure, with impaired HLA-DR and CD86 expression, and have an increased capacity for TNF but not IL-12 production. A first prepatent P. falciparum infection is sufficient to modulate CD1c(+) mDC responsiveness, likely contributing to hampered effector T cell cytokine responses and assisting parasite immune evasion.


Figures

FIG 1
FIG 1
Parasitemia and CD1c+ mDC absolute counts in participants infected with 150 pRBCs (white) or 1,800 pRBCs (gray). (A) Schematic of clinical trial cohorts, 150 pRBCs (black) and 1,800 pRBCs (gray). On the days specified, PCR, full blood counts, and immunological assays were performed. Arrows indicate the day of antimalarial treatment, and “n” represents the number of volunteers treated. (B) Parasitemia was determined by qPCR in participants infected with 150 pRBCs (white circles) or 1,800 pRBCs (gray circles). The dotted line indicates the predetermined parasite treatment threshold of 1,000 parasites/ml. Brackets represent the day of antimalarial treatment after infection with 1,800 pRBCs on day 7 (n = 19), day 8 (n = 30), or day 9 (n = 1) or with 150 pRBCs on day 10 (n = 1) or day 11 (n = 11). The mean parasitemia ± the standard error is presented. (C) Absolute number of circulating CD1c+ mDCs after 150-pRBC infection in 12 participants (24 h after drug treatment, P = 0.04; the exception being six individuals on days 7 and 10). (D) Absolute number of circulating CD1c+ mDCs after 1,800-pRBC infection in 21 participants (day 7, P = 0.05; day 8, P = 0.04; 24 h after drug treatment, P = 0.0002; the exception being 7 individuals on day 6 and 14 individuals on day 8 and after antimalarial drug treatment [Rx]). The box plot shows the minimum, maximum, median, and interquartile range for the data from all of the subjects.
FIG 2
FIG 2
HLA-DR expression on CD1c+ mDCs. (A) HLA-DR expression on DC subsets: CD1c+ mDCs (n = 21), CD16+ mDCs (n = 26), CD141+ mDCs (n = 33), and plasmacytoid DCs (n = 33) in participants at baseline (day 0). (B) CD1c+ mDC HLA-DR MFI (%) at baseline (day 0) after inoculations of 150 pRBCs (12 participants) or 1,800 pRBCs (21 participants) and peak parasitemia (days 10 and 11 or days 7 and 8, respectively). (C) Monocyte HLA-DR MFI (%) baseline after 1,800-pRBC infection in six participants. (D) Uptake of particulate antigen by CD1c+ mDCs after 150-pRBC infection (12 participants, left graph) or 1,800-pRBC infection (7 participants, right graph). The ΔMFI of FITC-dextran uptake (calculated as the MFI for cells incubated at 37°C – the MFI for cells incubated on ice). (E) Association between day 11 (peak parasitemia) baseline HLA-DR MFI and FITC-dextran uptake after 150-pRBC infection. (F) Association between day 7 (peak parasitemia) baseline HLA-DR MFI and FITC-dextran uptake after 1,800-pRBC infection. Statistics were calculated using the Wilcoxon matched-paired test and linear regression. MFI, median fluorescence intensity.
FIG 3
FIG 3
CD1c+ mDC HLA-DR expression after TLR or pRBC stimulation. (A) Representative histograms of HLA-DR MFI on whole-blood CD1c+ mDCs in one individual on days 0 and 7. (B) CD1c+ mDC HLA-DR expression in six participants on day 0 (top graph) and day 7 (bottom graph). The dotted line shows the median HLA-DR MFI on day 0 for the control (NIL) condition (median = 17.6). (C) Monocyte HLA-DR expression in six participants on day 0 (top graph) and day 7 (bottom graph). The dotted line shows the median HLA-DR MFI on day 0 for the control (NIL) condition (median = 4). MFI, median fluorescence intensity; uRBC, uninfected red blood cells; pRBC, parasitized red blood cells.
FIG 4
FIG 4
CD1c+ mDC CD86 expression at peak parasitemia. (A) Representative gating strategy for CD86 on whole-blood CD1c+ mDCs in one individual on day 0 and day 7. (B) The paired frequency of CD86+ CD1c+ mDCs in six participants at day 0 (baseline) and day 7 (peak-parasitemia). The ex vivo (NIL), post-TLR, and uRBC or pRBC stimulation data are shown.(C) The paired frequency of CD86+ CD14+ monocytes in six participants day 0 (baseline) compared to day 7 (peak parasitemia). (D) HLA-DR expression on CD86+ compared to CD86 CD1c+ mDCs at day 0 (baseline) and day 7 (peak parasitemia). A Mann-Whitney test was used for comparison between cell subsets. (E) HLA-DR expression on CD86+ CD1c+ mDCs at day 0 (baseline) and day 7 (peak parasitemia) in six participants. (F) HLA-DR expression on CD86 CD1c+ mDCs at day 0 (baseline) and day 7 (peak parasitemia) in six participants. A Wilcoxon matched-paired test was used for comparison between day 0 and day 7. *, P = 0.03.
FIG 5
FIG 5
CD1c+ mDC cytokine responsiveness to TLR or pRBC stimulation. (A) Representative staining of blood CD1c+ mDCs for intracellular cytokines. CD1c+ mDCs were identified as negative for lineage markers (CD14, CD3, CD19, and CD56), HLA-DR+, and CD1c+. Intracellular cytokine production by CD1c+ mDCs on day 0 (IL-12, TNF, and IL-10) under two conditions, ex vivo (NIL; top panel) and TLR4 (bottom panel), was determined. (B) TNF production on day 0 and day 7 ex vivo (NIL) and after uRBC or pRBC (P = 0.03) stimulation. (C) TNF production on day 0 and day 7 after TLR1/2 (P = 0.02), TLR4 (P = 0.0002), or TLR7 stimulation. (D) IL-12 production on day 0 and day 7 ex vivo (NIL) and after uRBC or pRBC stimulation. (E) IL-12 production on day 0 and day 7 after TLR stimulation. A Wilcoxon matched-paired test was used for comparison between days 0 and day 7. *, P < 0.05; ***, P = 0.0002. Line graphs show data for all subjects (n = 14; the exceptions include 8 individuals for TLR1/2, 10 individuals for TLR7, and 6 individuals for uRBCs and pRBCs). FSC, forward scatter; SSC, side scatter; uRBC, uninfected red blood cells; pRBC, parasitized red blood cells.
FIG 6
FIG 6
Cytokine production by T cells after uRBC or pRBC stimulation on day 0, day 7, and day 28. (A) CD4+ T cell IFN-γ production. (B) CD8+ T cell IFN-γ production. (C) CD4+ T cell IL-2 production. (D) CD8+ T cell IL-2 production. A Wilcoxon matched-paired test was used for comparison between days 0 and 7 and days 0 and 28 for 19 participants.

References

    1. World Health Organization. 2014. World malaria report. World Health Organization, Geneva, Switzerland.
    1. Wykes MN, Good MF. 2008. What really happens to dendritic cells during malaria? Nat Rev Microbiol 6:864–870. doi:10.1038/nrmicro1988. - DOI - PubMed
    1. Shortman K, Liu YJ. 2002. Mouse and human dendritic cell subtypes. Nat Rev Immunol 2:151–161. doi:10.1038/nri746. - DOI - PubMed
    1. Ju X, Clark G, Hart D. 2010. Review of human DC subtypes. Methods Mol Biol 595:3. doi:10.1007/978-1-60761-421-0_1. - DOI - PubMed
    1. Jongbloed SL, Kassianos AJ, McDonald KJ, Clark GJ, Ju X, Angel CE, Chen CJJ, Dunbar P, Wadley RB, Jeet V. 2010. Human CD141+ (BDCA-3)+ dendritic cells (DCs) represent a unique myeloid DC subset that cross-presents necrotic cell antigens. J Exp Med 207:1247. doi:10.1084/jem.20092140. - DOI - PMC - PubMed