. 2016 Feb 23:6:21868.
doi: 10.1038/srep21868.

Monocyte-induced recovery of inflammation-associated hepatocellular dysfunction in a biochip-based human liver model

Affiliations

Monocyte-induced recovery of inflammation-associated hepatocellular dysfunction in a biochip-based human liver model

Marko Gröger et al. Sci Rep. .

Erratum in

Abstract

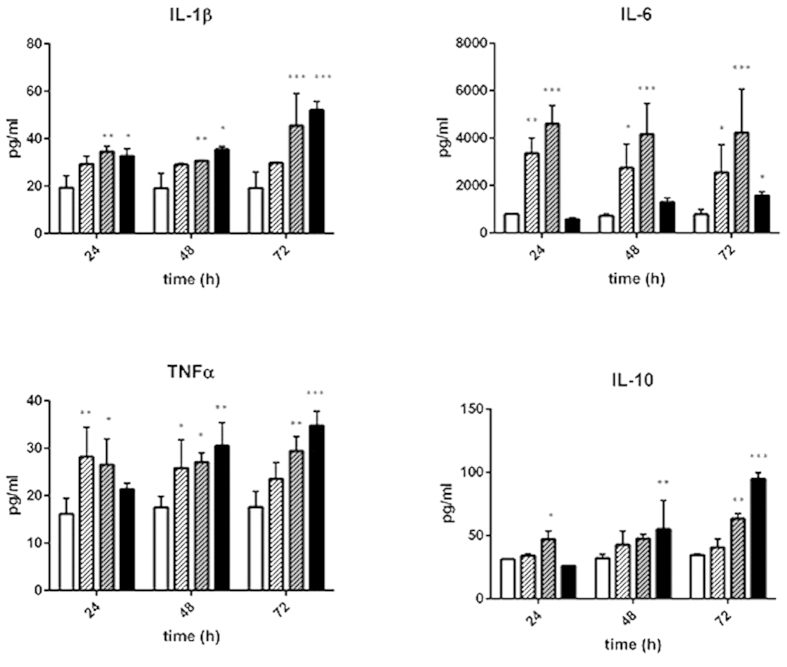
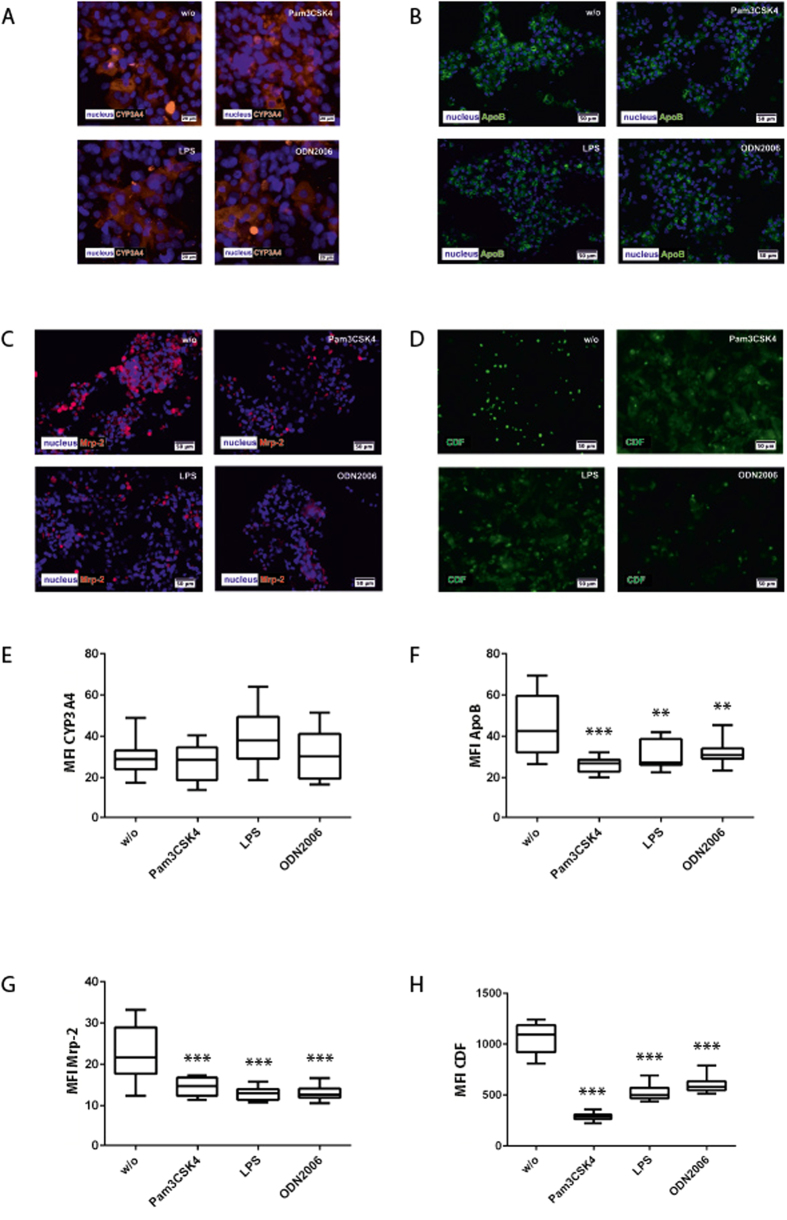
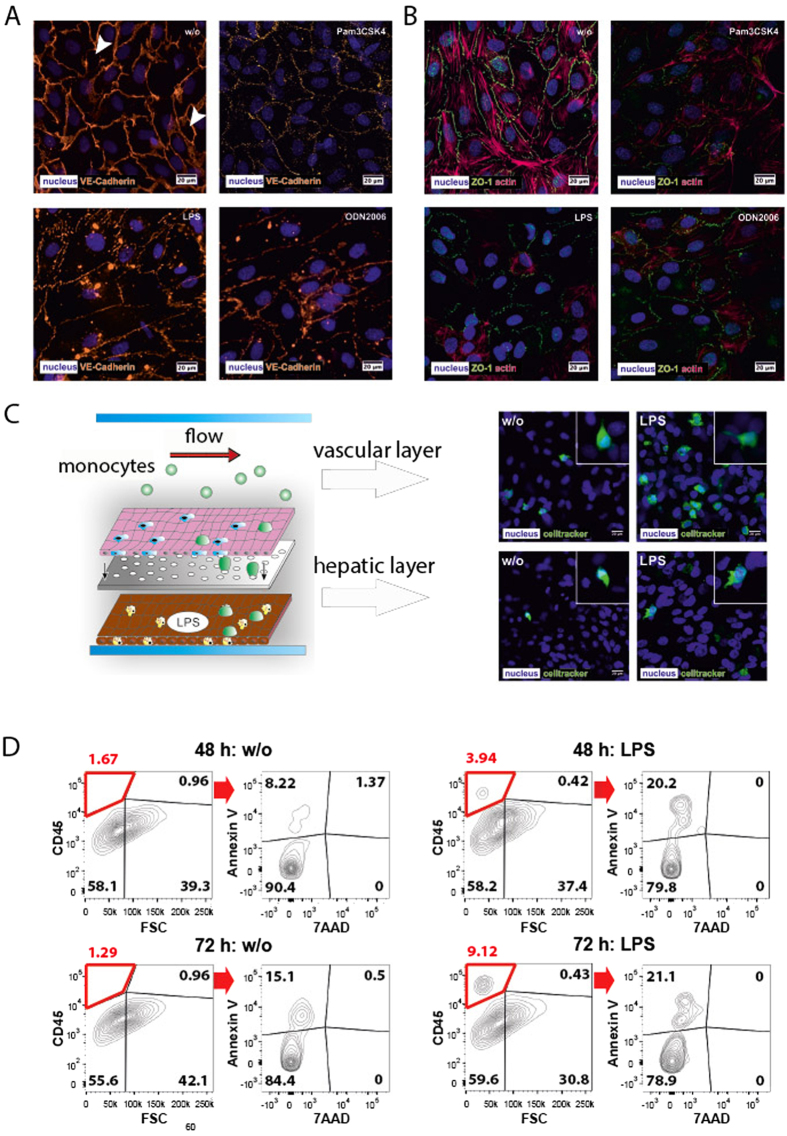
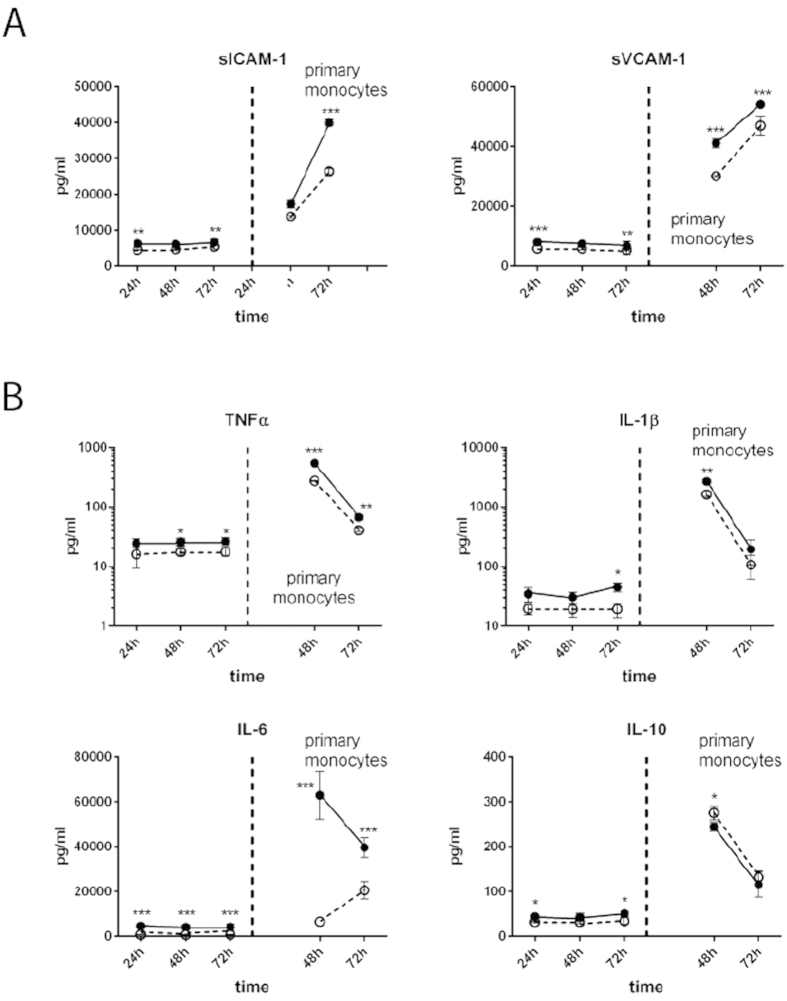
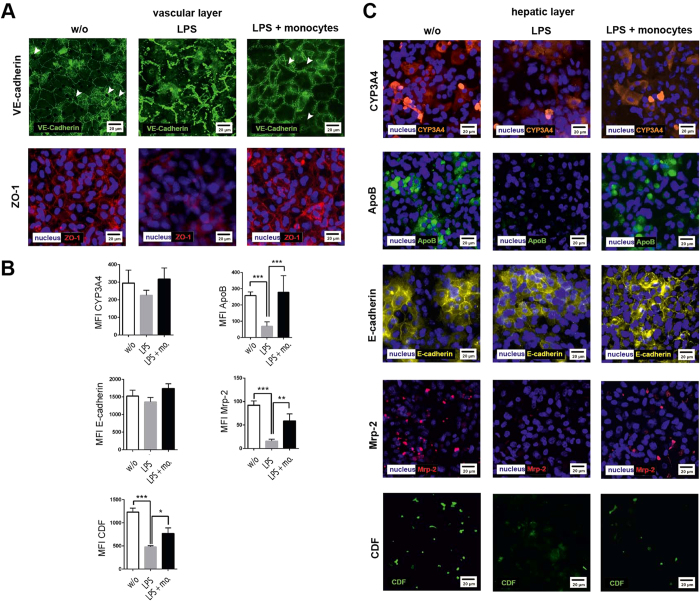
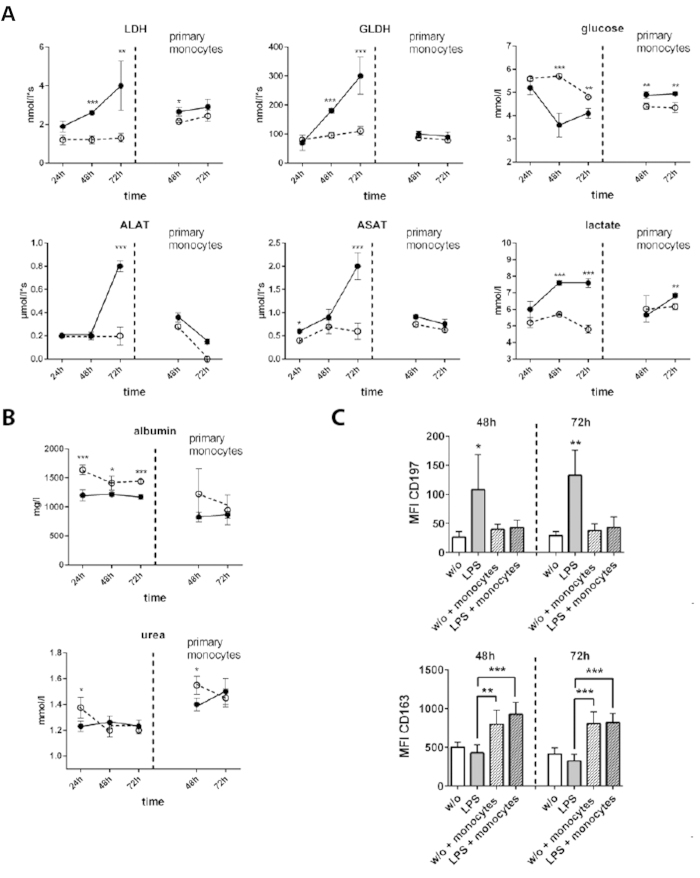
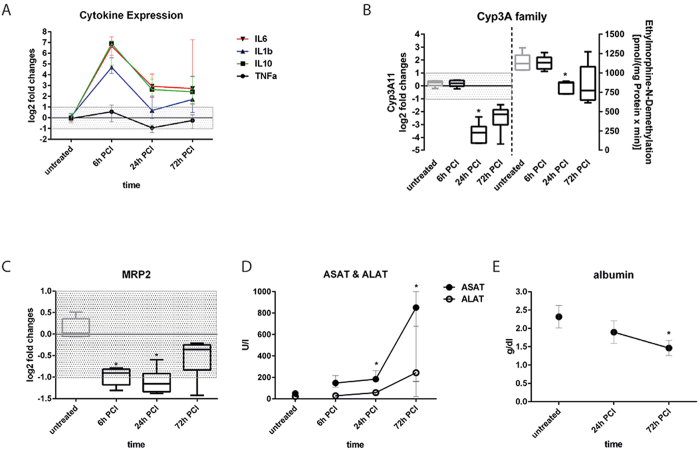
Liver dysfunction is an early event in sepsis-related multi-organ failure. We here report the establishment and characterization of a microfluidically supported in vitro organoid model of the human liver sinusoid. The liver organoid is composed of vascular and hepatocyte cell layers integrating non-parenchymal cells closely reflecting tissue architecture and enables physiological cross-communication in a bio-inspired fashion. Inflammation-associated liver dysfunction was mimicked by stimulation with various agonists of toll-like receptors. TLR-stimulation induced the release of pro- and anti-inflammatory cytokines and diminished expression of endothelial VE-cadherin, hepatic MRP-2 transporter and apolipoprotein B (ApoB), resulting in an inflammation-related endothelial barrier disruption and hepatocellular dysfunction in the liver organoid. However, interaction of the liver organoid with human monocytes attenuated inflammation-related cell responses and restored MRP-2 transporter activity, ApoB expression and albumin/urea production. The cellular events observed in the liver organoid closely resembled pathophysiological responses in the well-established sepsis model of peritoneal contamination and infection (PCI) in mice and clinical observations in human sepsis. We therefore conclude that this human liver organoid model is a valuable tool to investigate sepsis-related liver dysfunction and subsequent immune cell-related tissue repair/remodeling processes.


Figures

Figure 1
Figure 1. Cytokine profiling of liver organoids stimulated with TLR agonists.
Cytokine release of untreated liver organoids (open bars) was compared to liver organoids treated for 24 h, 48 h or 72 h with Pam3CSK4 (open, shaded bars), LPS (grey, shaded bars) or ODN2006 (black bars). Cell culture medium was exchanged every 24 h. Statistical significance was calculated compared to untreated control after 24 h of culture using two-way ANOVA with Dunnett’s multiple comparisons test (*p < 0.05, **p < 0.01, ***p < 0.001). Results of five independent experiments are shown.
Figure 2
Figure 2. Hepatocyte protein expression and CDF secretion in the hepatic layer.
Liver organoids were treated with Pam3CSK4, LPS or ODN2006 for 72 h and compared with untreated control (w/o). (AD) Immunofluorescence staining of (A) CYP3A4 (orange) (B) ApoB (green) and (C) MRP-2 (magenta), (D) CDF secretion (green) into bile canaliculi after 24 h of stimulation with TLR agonists. (E–H) Computational analyses of fluorescence signal intensities using random field analyses of at least 20 regions of interest (ROI) per tested condition (labeled as mean immunofluorescence intensity (MFI) of specific staining against the respective protein) of (E) CYP3A4, (F) ApoB, (G) Mrp-2, (H) CDF. Nuclei are stained with DAPI (blue). Statistical significance was calculated compared to untreated control using one-way ANOVA with Dunnett’s multiple comparisons test (*p < 0.05, **p < 0.01, ***p < 0.001). Results of three independent experiments are shown.
Figure 3
Figure 3. Modulation of endothelial integrity and monocyte adhesion/migration under inflammatory conditions triggered by Pam3CSK4, LPS or ODN2006.
(A) Expression of VE-cadherin (orange). White arrows indicate gaps in the vascular layer. (B) Expression of ZO-1 (green) and actin (red). (C,D) Flow-based adhesion and migration assay of primary monocytes stained with Celltracker® Green at the vascular and hepatic layer of untreated liver organoids (w/o) or liver organoids pre-stimulated with LPS. Nuclei are stained with DAPI (blue). (D) Analysis of primary monocytes transmigrated for 48 h and 72 h into the hepatic layer in absence (w/o) or presence of LPS. Monocytes within the hepatic chamber were stained and gated based on CD45 expression and analyzed for apoptosis induction (Annexin V staining) and cell death (7AAD). (A–D) Results of a representative experiment out of three independent experiments are shown.
Figure 4
Figure 4. Impact of perfusion with primary monocytes.
(A) Release of sICAM and sVCAM in response to primary monocyte perfusion and adhesion. (B) Secretion of IL-1β, IL-6, TNFα and IL-10 in response to primary monocyte perfusion and adhesion. Liver organoids were untreated (dashed line) or stimulated with LPS (solid line), without monocyte perfusion (left from vertical dashed line) or with monocyte perfusion (right from vertical dashed line). (A,B) Statistical significance was calculated between untreated and LPS-treated liver organoids of identical time points and perfusion conditions (*p < 0.05, **p < 0.01, ***p < 0.001) using student’s t-test. Results of six independent experiments are shown.
Figure 5
Figure 5. Immunofluorescence staining of endothelial and hepatocyte proteins without stimulation (w/o) and in presence of 100 ng/ml LPS (LPS) or 100 ng LPS and primary monocytes (LPS + monocytes (mo.)).
(A) Expression of VE-cadherin and ZO-1 at the vascular layer. White arrows indicate gaps in the vascular layer. Representative results of three independent experiments are shown. (B) Computational analyses of fluorescence intensities of at least 20 ROI per condition (labeled as mean immunofluorescence intensity (MFI)) of the respective protein using random field analysis in the hepatic layer. Statistical significance was calculated between indicated conditions using student’s t-test (*p < 0.05, **p < 0.01, ***p < 0.001). Immunostaining for (C) CYP3A4 (red), ApoB (green), E-cadherin (yellow), MRP-2 (red), and detection of CDF secretion (green). Nuclei are stained with DAPI (blue). Representative results of three independent experiments are shown.
Figure 6
Figure 6. Release of intracellular enzymes and metabolic activity of the liver organoid.
Liver organoids were untreated (dashed line) or stimulated with LPS (solid line), without monocyte perfusion (left from vertical dashed line) or with primary monocyte perfusion (primary monocytes, right from vertical dashed line). (A) Release of lactate-dehydrogenase (LDH), glutamate-dehydrogenase (GLDH), aspartate-transaminase (ASAT) and alanine-transaminase (ALAT). Changes in glucose, lactate consumption. (B) Synthesis of albumin and urea. Statistical significance was calculated between untreated and LPS-treated samples at similar time points and perfusion conditions (*p < 0.05, **p < 0.01, ***p < 0.001) using student’s t-test. (C) Computational analyses of fluorescence intensity of 20 ROI per condition (labeled as mean immunofluorescence intensity (MFI)) of CD197 or CD163 using random field analyses of macrophages in the vascular layer. Liver organoids were cultured for 48 h or 72 h in absence (w/o) or presence of LPS (LPS). Where indicated liver organoids were perfused with monocytes (+monocytes) 24 h after culture and then sub-cultured for indicated times. Significance of CD197 was calculated for condition “LPS treatment without monocytes perfusion” compared to the remaining conditions. For CD163 significance was calculated between indicated conditions. For statistical analysis of CD196 and CD163 expression one-way ANOVA with Bonferroni multiple testing correction (*p < 0.05, **p < 0.01, ***p < 0.001) was used. (AC) Data of three independent experiments are shown.
Figure 7
Figure 7. Release of cytokines and intracellular enzymes, and regulation of CYP3A and MRP2 in the PCI model.
Messenger RNA expression of cytokines (A), CYP3A11 (B) and MRP-2 (C). Enzyme activity of CYP3A family members using the model reaction ethylmorphine-N-demethylation (D,E) Serum concentrations of ASAT, ALAT and albumin. Statistically significance was calculated using one-way ANOVA with Dunn’s test for multiple testing correction (#p < 0.05). (AE) Five animals per time point were analyzed.

References

    1. Bauer M., Press A. T. & Trauner M. The liver in sepsis: patterns of response and injury. Curr. Opin. Crit. Care 19, 123–7 (2013). - PubMed
    1. Recknagel P. et al. Liver Dysfunction and Phosphatidylinositol-3-Kinase Signalling in Early Sepsis: Experimental Studies in Rodent Models of Peritonitis. PLoS Med 9, 9–10 (2012). - PMC - PubMed
    1. Ring a & Stremmel W. The hepatic microvascular responses to sepsis. Semin. Thromb. Hemost. 26, 589–94 (2000). - PubMed
    1. Seok J. et al. Genomic responses in mouse models poorly mimic human inflammatory diseases. Proc. Natl. Acad. Sci. USA 110, 3507–3512 (National Acad Sciences, 2013). - PMC - PubMed
    1. Takao K. & Miyakawa T. Genomic responses in mouse models greatly mimic human inflammatory diseases. Proc Natl Acad Sci USA 112, 1401965111– (2014). - PMC - PubMed

Publication types

MeSH terms

LinkOut - more resources