

Co-occurring risk factors for current cigarette smoking in a U.S. nationally representative sample
- PMID: 26902875
- PMCID: PMC4992654
- DOI: 10.1016/j.ypmed.2016.02.025
Co-occurring risk factors for current cigarette smoking in a U.S. nationally representative sample
Abstract
Introduction: Relatively little has been reported characterizing cumulative risk associated with co-occurring risk factors for cigarette smoking. The purpose of the present study was to address that knowledge gap in a U.S. nationally representative sample.
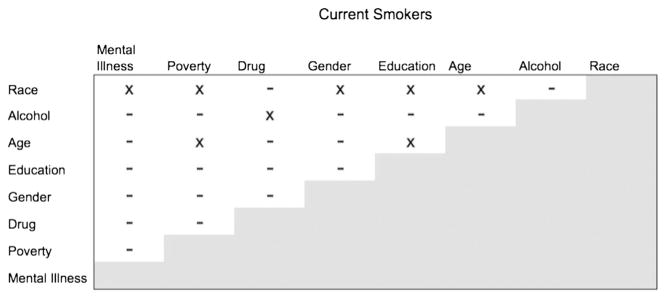
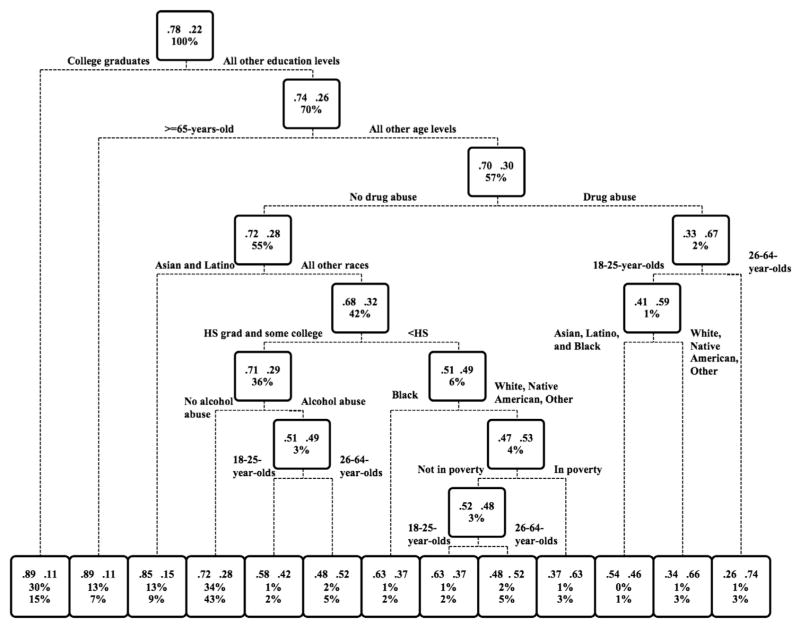
Methods: Data were obtained from 114,426 adults (≥18years) in the U.S. National Survey on Drug Use and Health (years 2011-13). Multiple logistic regression and classification and regression tree (CART) modeling were used to examine risk of current smoking associated with eight co-occurring risk factors (age, gender, race/ethnicity, educational attainment, poverty, drug abuse/dependence, alcohol abuse/dependence, mental illness).
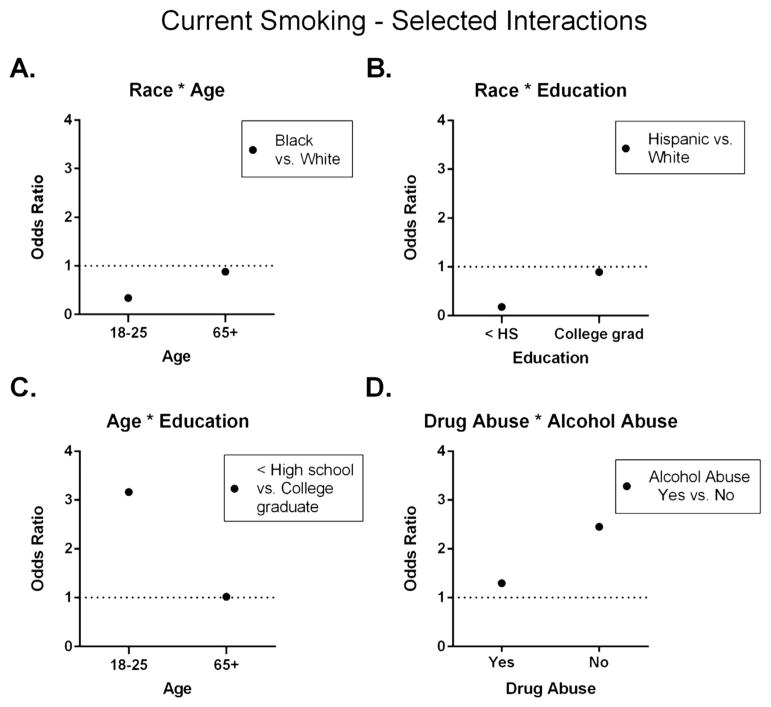
Results: Each of these eight risk factors was independently associated with significant increases in the odds of smoking when concurrently present in a multiple logistic regression model. Effects of risk-factor combinations were typically summative. Exceptions to that pattern were in the direction of less-than-summative effects when one of the combined risk factors was associated with generally high or low rates of smoking (e.g., drug abuse/dependence, age ≥65). CART modeling identified subpopulation risk profiles wherein smoking prevalence varied from a low of 11% to a high of 74% depending on particular risk factor combinations. Being a college graduate was the strongest independent predictor of smoking status, classifying 30% of the adult population.
Conclusions: These results offer strong evidence that the effects associated with common risk factors for cigarette smoking are independent, cumulative, and generally summative. The results also offer potentially useful insights into national population risk profiles around which U.S. tobacco policies can be developed or refined.
Keywords: Adults; Cigarette smoking; Classification and regression tree (CART); Co-occurring risk factors; Current smokers; Educational attainment; Multiple logistic regression; Risk factors; U.S. nationally representative sample.
Copyright © 2016. Published by Elsevier Inc.
Conflict of interest statement
The authors have no conflicts of interest to report.
Figures
References
-
- Asfar T, Arheart KL, Dietz NA, Caban-Martinez AJ, Fleming LE, Lee DJ. Changes in cigarette smoking behavior among US young workers 2005–2010: the role of occupation. Nicotine Tob Res. 2015 Oct 26; pii: ntv240. [Epub ahead of print]) - PubMed
-
- Ashley DL, Backinger CL, van Bemmel DM, Neveleff DJ. Tobacco regulatory science: research to inform regulatory action at the Food and Drug Administration’s Center for Tobacco Products. Nicotine Tob Res. 2014;16(8):1045–1049. http://dx.doi.org/10.1093/ntr/ntu038 (Epub 2014 Mar 17) - DOI - PubMed
-
- Austin PC. A comparison of regression trees, logistic regression, generalized additive models, and multivariate adaptive regression splines for predicting AMI mortality. Stat Med. 2007;26:2937–2957. - PubMed
-
- Breiman L, Friedman JH, Olshen RA, Stone CJ. Classification and Regression Trees. Wadsworth; Belmont, California: 1984.
-
- Center for Behavioral Health Statistics Quality. 2013 National Survey on Drug Use and Health Public Use File Codebook. Substance Abuse and Mental Health Services Administration; Rockville, MD: 2014. [Accessed June 16, 2015]. ( http://www.icpsr.umich.edu/cgi-bin/file?comp=none&study=35509&ds=1&file_....
MeSH terms
Grants and funding
LinkOut - more resources
Full Text Sources
Other Literature Sources
Miscellaneous
