. 2016 Mar 7;213(3):377-97.
doi: 10.1084/jem.20151438. Epub 2016 Feb 22.

Control of Foxp3 stability through modulation of TET activity

Affiliations

Control of Foxp3 stability through modulation of TET activity

Xiaojing Yue et al. J Exp Med. .

Abstract

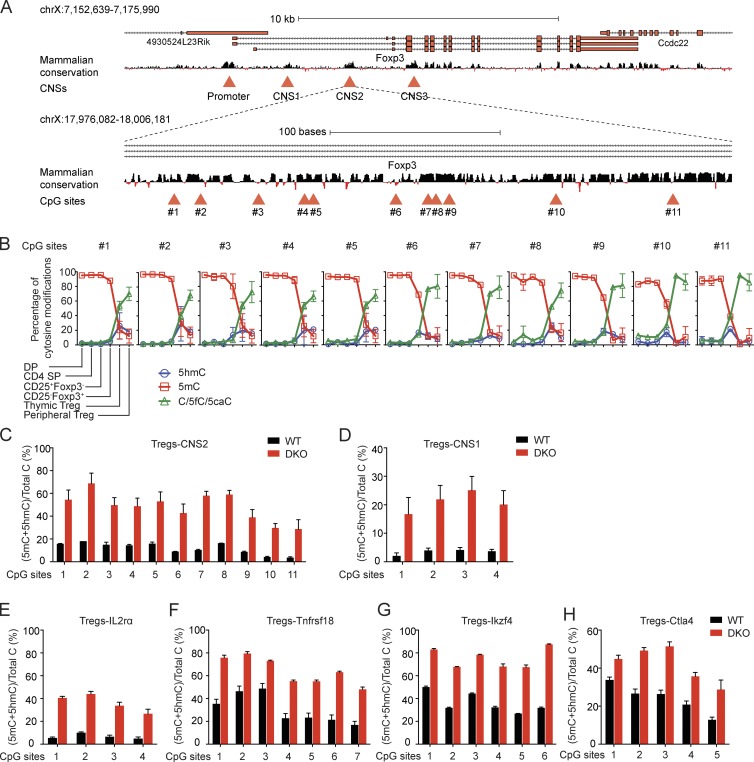
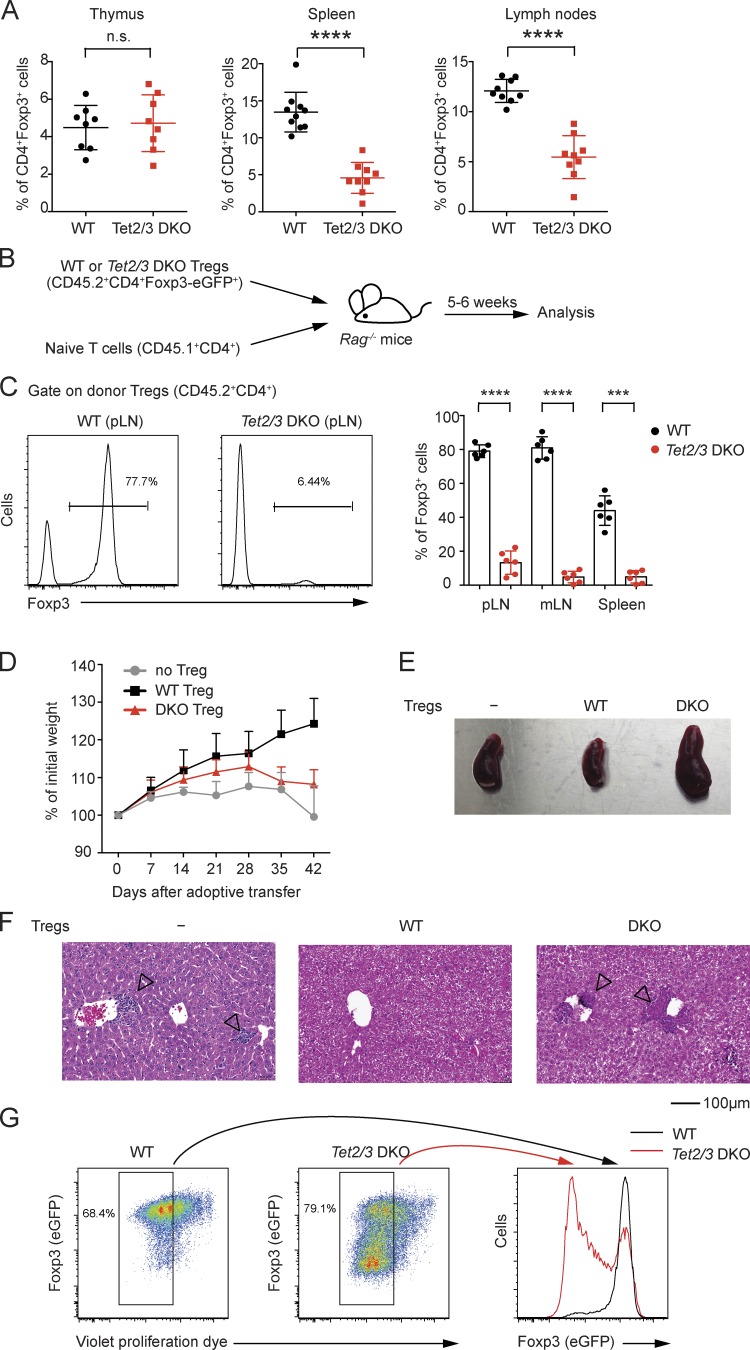
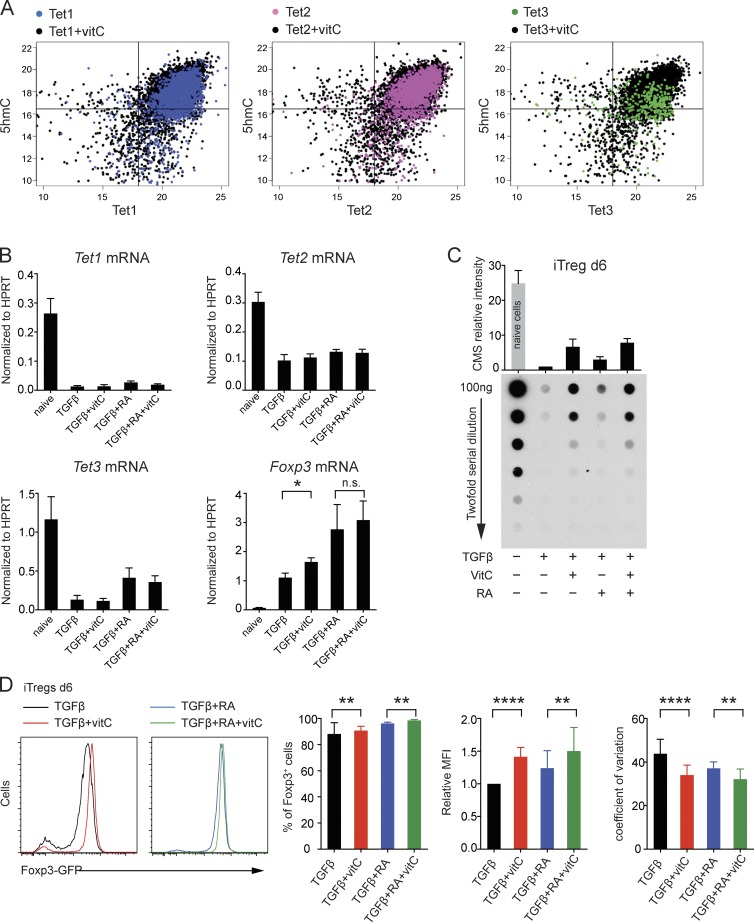
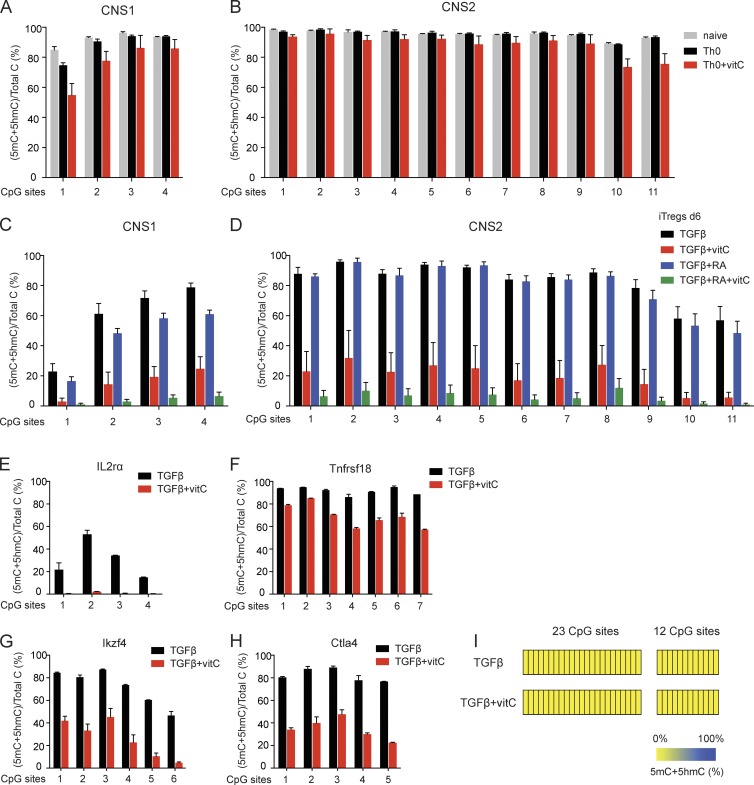
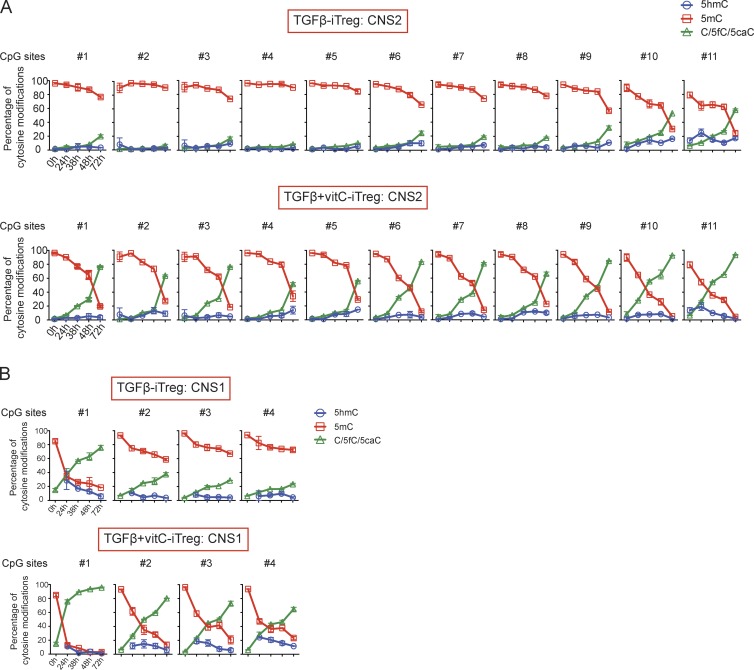
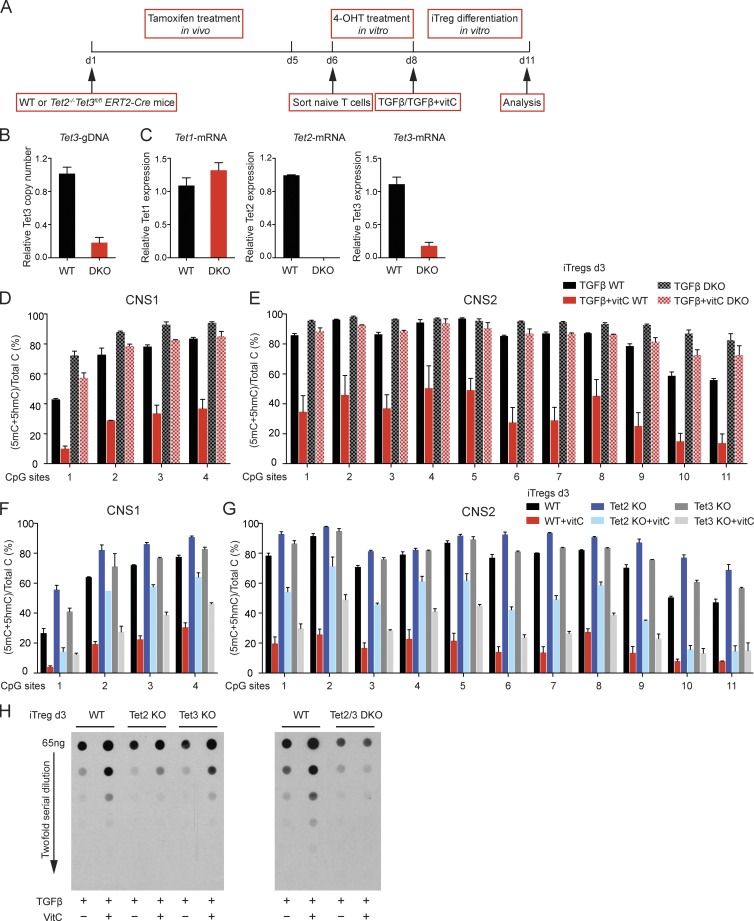
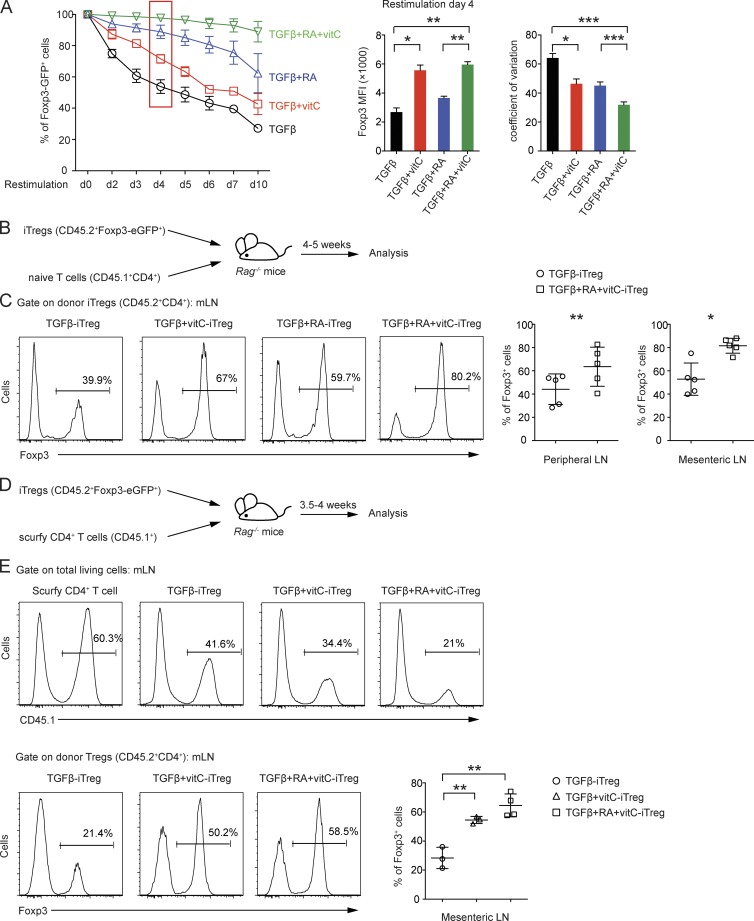
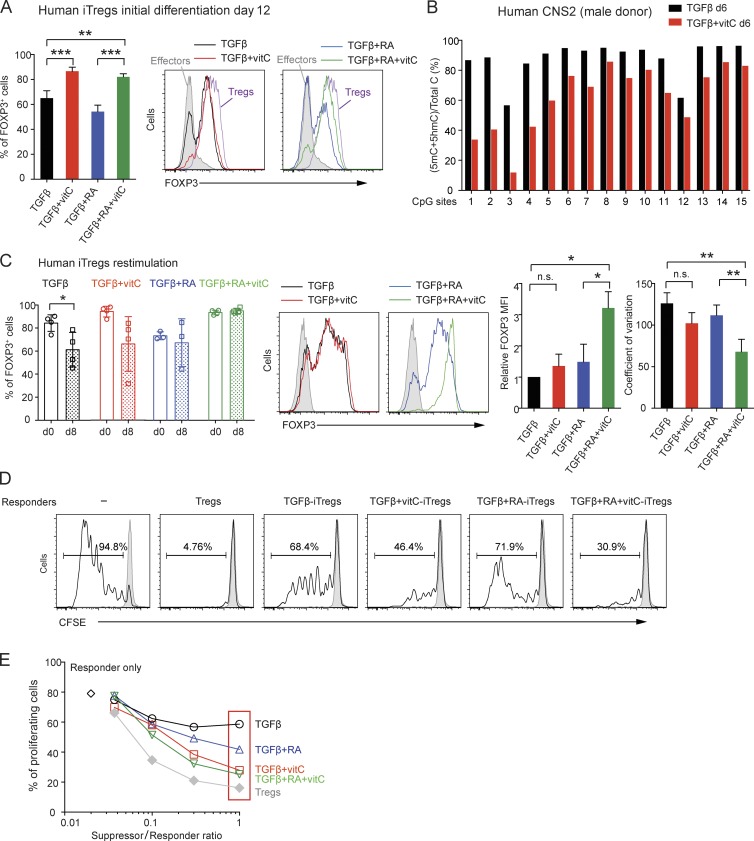
Ten-eleven translocation (TET) enzymes oxidize 5-methylcytosine (5mC) to 5-hydroxymethylcytosine and other oxidized methylcytosines, intermediates in DNA demethylation. In this study, we examine the role of TET proteins in regulating Foxp3, a transcription factor essential for the development and function of regulatory T cells (T reg cells), a distinct lineage of CD4(+) T cells that prevent autoimmunity and maintain immune homeostasis. We show that during T reg cell development in the thymus, TET proteins mediate the loss of 5mC in T reg cell-specific hypomethylated regions, including CNS1 and CNS2, intronic cis-regulatory elements in the Foxp3 locus. Similar to CNS2-deficient T reg cells, the stability of Foxp3 expression is markedly compromised in T reg cells from Tet2/Tet3 double-deficient mice. Vitamin C potentiates TET activity and acts through Tet2/Tet3 to increase the stability of Foxp3 expression in TGF-β-induced T reg cells. Our data suggest that targeting TET enzymes with small molecule activators such as vitamin C might increase induced T reg cell efficacy.


Figures

Figure 1.
Figure 1.
Double deficiency of Tet2 and Tet3 impairs the loss of 5mC. (A) Schematic representation of the Foxp3 locus. Top: Foxp3 transcript variants and mammalian conservation track are shown, and the conserved promoter region and the three conserved noncoding sequences corresponding to the intronic enhancers CNS1, CNS2, and CNS3 are highlighted with red triangles. Bottom: 11 CpG sites in the CNS2 region that were assessed to determine their methylation-hydroxymethylation status are indicated with red triangles. (B) Dynamic changes in 5mC, 5hmC, and C/5fC/5caC in the Foxp3 CNS2 enhancer during T reg cell lineage specification. The graphs depict the cytosine modification status of the 11 CpGs in the CNS2 region as determined by BS-seq and oxBS-seq in six different T cell subsets (DP, CD4 SP, precursor T reg cells [CD25+Foxp3 and CD25Foxp3+], thymic T reg cells, and peripheral T reg cells) that together capture the sequential steps of differentiation that lead to T reg cell specification. Error bars (which in many cases are too small to be detectable) show mean ± SD of thousands of sequencing reads from two independent experiments. (C–H) Graphs depicting the percentage of 5mC + 5hmC determined by BS-seq in peripheral T reg cells in 11 CpGs in Foxp3 CNS2 (C), 4 CpGs in Foxp3 CNS1 (D), 4 CpGs in Il2ra intron 1a (E), 7 CpGs in Tnfrsf18 exon 5 (F), 6 CpGs in Ikzf4 intron 1b (G), and 5 CpGs in Ctla4 exon 2 (H). Error bars show mean ± SD of thousands of sequencing reads from three to four independent experiments.
Figure 2.
Figure 2.
The stability of T reg cells is significantly compromised with double deficiency of Tet2 and Tet3. (A) Percentage of Foxp3+ T reg cells among CD4 SP thymocytes or splenic and lymph node CD4+ T cells in Tet2/3 DKO mice and littermate controls. n = 8–9. n.s., not significant. (B) Schematic representation of the adoptive transfer experiment for assessing T reg cell stability in vivo. (C) Analysis of peripheral lymphoid organs from Rag-deficient mice 5–6 wk after adoptive transfer of peripheral T reg cells from young (3–4 wk old) WT (CD45.2+) or Tet2/3 DKO (CD45.2+) reporter mice as a CD4+Foxp3-eGFP+ population together with congenically marked naive T cells (CD45.1+CD4+). Left: Representative histograms of Foxp3+ cells within CD45.2+CD4+ cells. Right: The mean percentage of Foxp3+ cells in the CD45.2+CD4+ cell gate. Each dot represents one mouse. Error bars show mean ± SD from three independent experiments with six mice per group. pLN, peripheral lymph node. mLN, mesenteric lymph node. (D–F) The Foxp3 stability assay using T reg cells sorted from either WT or Tet2/3 DKO reporter mice as the CD4+Foxp3-eGFP+ population. The percent change in initial weight after adoptive transfer (D), the picture of spleens (E), and hematoxylin and eosin staining of livers (F) from adoptive transfer without T reg cells or with WT or Tet2/3 DKO T reg cells are shown. Arrowheads indicate mononuclear cell infiltration in the liver. Data are representative of three independent experiments. (G) WT or Tet2/3 DKO Foxp3-eGFP+ T reg cells were labeled with violet proliferation dye and cultured in vitro for 3 d and then analyzed for Foxp3-eGFP expression by flow cytometry. Left: Representative pseudocolor plots for WT or Tet2/3 DKO T reg cells. Right: Histogram overlay of Foxp3-eGFP+ cells from WT and Tet2/3 DKO T reg cells within the dividing cells. Data are representative of three independent experiments. ***, P < 0.001; ****, P < 0.0001 by Student’s t test.
Figure 3.
Figure 3.
The effects of vitamin C on TET activity and expression. (A) The effect of vitamin C on TET activity. HEK293T cells were transfected with HA-tagged TET1–3, cultured in the presence/absence of vitamin C, and then stained and imaged for TET expression (x axis) and 5hmC intensity (y axis). The y/x axis is shown in log2 scale. Each dot represents a TET-expressing cell, with hundreds of cells analyzed from independent wells. (B) Quantitative real-time PCR analysis of Tet1, Tet2, Tet3, and Foxp3 mRNA expression levels in naive and iT reg cells differentiated for 3 d in the presence of TGF-β, TGF-β + vitamin C (vitC), TGF-β + RA, or TGF-β + RA + vitamin C. Error bars show mean ± SD from three independent experiments. (C) Genomic DNA from naive and iT reg cells differentiated for 6 d in the presence of TGF-β, TGF-β + vitamin C, TGF-β + RA, or TGF-β + RA + vitamin C was treated with sodium BS to convert 5hmC to CMS. The relative intensity of CMS was quantified by anti-CMS dot blot assay and normalized to the amount of CMS detected in iT reg cells differentiated for 6 d with TGF-β alone. Error bars show mean ± SD from three independent experiments. (D, left) Representative histogram overlay. Right: Graphs for the percentage of Foxp3+ cells, relative MFI (normalized to the MFI in TGF-β condition), and coefficient of variation for iT reg cells differentiated for 6 d in the presence of TGF-β, TGF-β + vitamin C, TGF-β + RA, and TGF-β + RA + vitamin C. Error bars show mean ± SD from more than five independent experiments. *, P < 0.05; **, P < 0.01; ****, P < 0.0001 by Student’s t test. n.s., not significant.
Figure 4.
Figure 4.
Supplementation with vitamin C during iT reg cell differentiation leads to the loss of 5mC in T reg cell–specific regulatory regions. (A and B) BS-seq of the four CpG sites in Foxp3 CNS1 (A) and the 11 CpG sites in Foxp3 CNS2 (B). Graphs depict the percentage of (5mC + 5hmC)/total C in naive CD4+ T cells and naive CD4+ T cells activated under Th0 condition without or with vitamin C. Error bars show mean ± SD of thousands of sequencing reads from two to four independent experiments. (C and D) BS-seq of the four CpG sites in Foxp3 CNS1 (C) and the 11 CpG sites in Foxp3 CNS2 (D). Graphs depict the percentage of (5mC + 5hmC)/total C in iT reg cells differentiated for 6 d in the presence of TGF-β, TGF-β + vitamin C, TGF-β + RA, and TGF-β + RA + vitamin C. Error bars show mean ± SD of thousands of sequencing reads from four independent experiments. (E–H) BS-seq of four CpGs in Il2ra intron 1a (E), seven CpGs in Tnfrsf18 exon5 (F), six CpGs in Ikzf4 intron 1b (G), and five CpGs in Ctla4 exon2 (H). Graphs depict the percentage of (5mC + 5hmC)/total C in iT reg cells differentiated for 6 d in the presence of TGF-β or TGF-β + vitamin C. Error bars show mean ± SD of thousands of sequencing reads from at least two independent experiments. (I) Heat maps depicting the percentage of (5mC + 5hmC)/total C in CpGs within two distinct regions of an upstream CpG island in the Foxp3 locus in iT reg cells differentiated for 6 d in the presence of TGF-β or TGF-β + vitamin C, as determined by BS-seq. Data show mean of thousands of sequencing reads from at least two independent experiments.
Figure 5.
Figure 5.
Dynamic alterations in cytosine modifications in Foxp3 CNS1 and CNS2 during iT reg cell differentiation in the presence of vitamin C. Dynamic changes in 5mC, 5hmC, and C/5fC/5caC in the Foxp3 CNS2 (A) and Foxp3 CNS1 (B) during iT reg cell in vitro differentiation. Diagrams depicting the cytosine methylation status of the 11 CpGs in CNS2 (A) and four CpGs in CNS1 (B) as determined by BS-seq and oxBS-seq at five different time points (0, 24, 38, 48, and 72 h) that together capture the sequential steps of differentiation that lead to the loss of 5mC in CNS2 (A) and CNS1 (B) in the presence of vitamin C. Data at 0 h for CNS1 locus is BS-seq. Error bars (which in many cases are too small to be detectable) show mean ± SD of thousands of sequencing reads from two independent experiments.
Figure 6.
Figure 6.
Vitamin C induces the loss of 5mC in CNS1 and CNS2 during iT reg cell differentiation via TET proteins. (A) Schematic representation of the experimental strategy for Tet3 deletion using the ERT2-Cre system. (B) Quantitative RT-PCR analysis of Tet3 deletion efficiency at the genomic DNA level. The relative copy number was normalized to GAPDH. (C) Quantitative RT-PCR analysis of Tet1, Tet2, and Tet3 mRNA expression levels. The relative expression level was normalized to HPRT. Error bars show mean ± SD from three independent experiments. (D and E) BS-seq of the four CpG sites in Foxp3 CNS1 (D) and 11 CpG sites in Foxp3 CNS2 (E). Graphs depict the percentage of (5mC + 5hmC)/total C in iT reg cells differentiated for 3 d from WT or Tet2−/−Tet3fl/fl ERT2-Cre cells in the presence of TGF-β or TGF-β + vitamin C, in both cases after tamoxifen and 4-OHT treatment as shown in A. (F and G) BS-seq of the four CpG sites in Foxp3 CNS1 (F) and the 11 CpG sites in Foxp3 CNS2 (G). Graphs depict the percentage of (5mC + 5hmC)/total C in iT reg cells differentiated in the presence of TGF-β and TGF-β + vitamin C for 3 d from WT, Tet2−/−, and Tet3fl/fl CD4-Cre naive CD4+ T cells. Error bars show mean ± SD of thousands of sequencing reads from two to three independent experiments. (H) Genomic DNA from WT, Tet2 KO, Tet3 KO, and Tet2/3 DKO naive and iT reg cells differentiated for 3 d in the presence of TGF-β and TGF-β + vitamin C was treated with sodium BS to convert 5hmC to CMS. The relative intensity of CMS was quantified by anti-CMS dot blot assay. Data are representative of three independent experiments.
Figure 7.
Figure 7.
Supplementation of vitamin C during iT reg cell differentiation enhances the stability of iT reg cells in vitro and in vivo. (A) Naive CD4+ T cells from Foxp3-IRES-eGFP reporter mice were differentiated into iT reg cells for 6 d in the presence of TGF-β, TGF-β + vitamin C, TGF-β + RA, or TGF-β + RA + vitamin C, and then the Foxp3-eGFP+ population was sorted and restimulated with anti-CD3 and anti-CD28 antibodies. The percentage of Foxp3-eGFP+ cells was monitored daily after restimulation. Right: Geometric MFI and coefficient of variation for Foxp3-eGFP+ cells on day 4 after restimulation. Error bars show mean ± SD from three independent experiments. (B) Schematic representation of the adoptive transfer experiment for assessing iT reg cell stability in vivo. (C, left) Representative histograms of Foxp3+ cells from Rag-deficient mice 4–5 wk after adoptive transfer of sorted iT reg cells differentiated for 6 d in the presence of TGF-β, TGF-β + vitamin C, TGF-β + RA, or TGF-β + RA + vitamin C. Right: Graphs for the percentage of Foxp3+ cells from peripheral and mesenteric lymph nodes. Data are from five mice per group. (D) Schematic representation of adoptive transfer experiment of scurfy CD4+ T cells. (E) Representative histograms of CD45.1+ cells (top) and CD45.2+CD4+Foxp3+ cells (bottom) from Rag-deficient mice 3.5–4 wk after adoptive transfer of iT reg cells differentiated in the presence of TGF-β, TGF-β + vitamin C, or TGF-β + RA + vitamin C together with scurfy CD4+ T cells. Bottom right: Graph for the percentage of Foxp3+ cells from mesenteric lymph nodes. Data are from three or four mice per group. Error bars show mean ± SD. mLN, mesenteric lymph node. *, P < 0.05; **, P < 0.01; ***, P < 0.001 by Student’s t test.
Figure 8.
Figure 8.
Vitamin C promotes the loss of 5mC in human FOXP3 CNS2 and enhances the stability and suppressive function of human iT reg cells. (A, left) Percentage of Foxp3+ cells in human iT reg cells differentiated from naive CD4+ T cells in the presence of TGF-β, TGF-β + vitamin C, TGF-β + RA, and TGF-β + RA + vitamin C on day 12. Error bars show mean ± SD from three to four independent donors. Right: Representative histogram overlay of Foxp3 expression for human iT reg cells differentiated for 12 d in the presence of TGF-β, TGF-β + vitamin C, TGF-β + RA, and TGF-β + RA + vitamin C. Effector CD4+ T cells (filled gray) and expanded T reg cells (purple) are shown for comparison. (B) BS-seq of 15 CpGs in human FOXP3 CNS2. Graph depicts the percentage of (5mC + 5hmC)/total C in human iT reg cells differentiated for 6 d without or with vitamin C from a male donor. (C, left) Analysis of Foxp3 expression in human iT reg cells generated as indicated in the presence of TGF-β, TGF-β + vitamin C, TGF-β + RA, and TGF-β + RA + vitamin C (d0) and restimulated with anti-CD3 and anti-CD28 antibodies for 8 d (d8). Graphs show results from three independent donors. Middle: Representative histogram overlay of Foxp3 expression for human iT reg cells on day 8 after restimulation. Right: Foxp3 MFI (normalized to the MFI in TGF-β condition) and coefficient of variation analyzed on day 8 after restimulation. *, P < 0.05; **, P < 0.01; ***, P < 0.001 by Student’s t test. n.s., not significant. (D) Proliferation analysis by CFSE dilution in human CD8+ T cells (responders) stimulated with anti-CD3 antibody and cultured with T reg or iT reg cells (suppressors) at a responder/suppressor ratio of 1:0.3. The percentage of proliferating cells (black line) and of resting, unstimulated responders (gray shaded histogram) are shown in each plot. (E) Percentage of proliferating responder cells at different responder/suppressor ratios. Results are representative of three independent donors.

References

    1. Abbas A.K., Benoist C., Bluestone J.A., Campbell D.J., Ghosh S., Hori S., Jiang S., Kuchroo V.K., Mathis D., Roncarolo M.G., et al. . 2013. Regulatory T cells: recommendations to simplify the nomenclature. Nat. Immunol. 14:307–308. 10.1038/ni.2554 - DOI - PubMed
    1. Allan S.E., Crome S.Q., Crellin N.K., Passerini L., Steiner T.S., Bacchetta R., Roncarolo M.G., and Levings M.K.. 2007. Activation-induced FOXP3 in human T effector cells does not suppress proliferation or cytokine production. Int. Immunol. 19:345–354. 10.1093/intimm/dxm014 - DOI - PubMed
    1. Benson M.J., Pino-Lagos K., Rosemblatt M., and Noelle R.J.. 2007. All-trans retinoic acid mediates enhanced T reg cell growth, differentiation, and gut homing in the face of high levels of co-stimulation. J. Exp. Med. 204:1765–1774. 10.1084/jem.20070719 - DOI - PMC - PubMed
    1. Blaschke K., Ebata K.T., Karimi M.M., Zepeda-Martínez J.A., Goyal P., Mahapatra S., Tam A., Laird D.J., Hirst M., Rao A., et al. . 2013. Vitamin C induces Tet-dependent DNA demethylation and a blastocyst-like state in ES cells. Nature. 500:222–226. 10.1038/nature12362 - DOI - PMC - PubMed
    1. Booth M.J., Branco M.R., Ficz G., Oxley D., Krueger F., Reik W., and Balasubramanian S.. 2012. Quantitative sequencing of 5-methylcytosine and 5-hydroxymethylcytosine at single-base resolution. Science. 336:934–937. 10.1126/science.1220671 - DOI - PubMed

Publication types