

Predicting clinical outcome from reward circuitry function and white matter structure in behaviorally and emotionally dysregulated youth
- PMID: 26903272
- PMCID: PMC4993633
- DOI: 10.1038/mp.2016.5
Predicting clinical outcome from reward circuitry function and white matter structure in behaviorally and emotionally dysregulated youth
Abstract
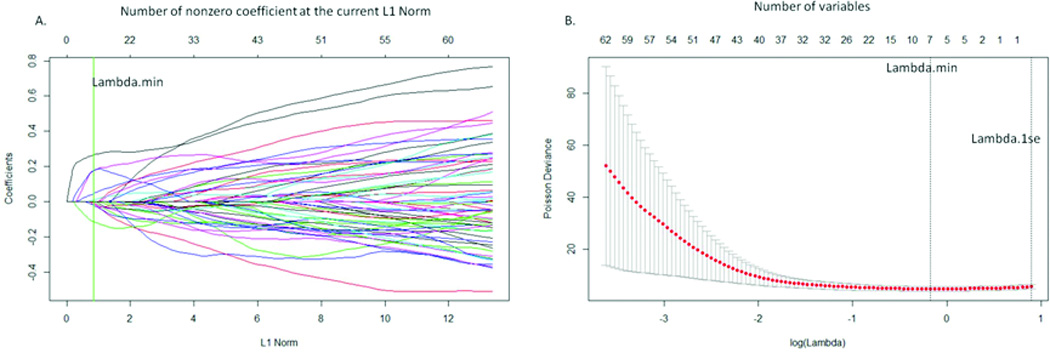
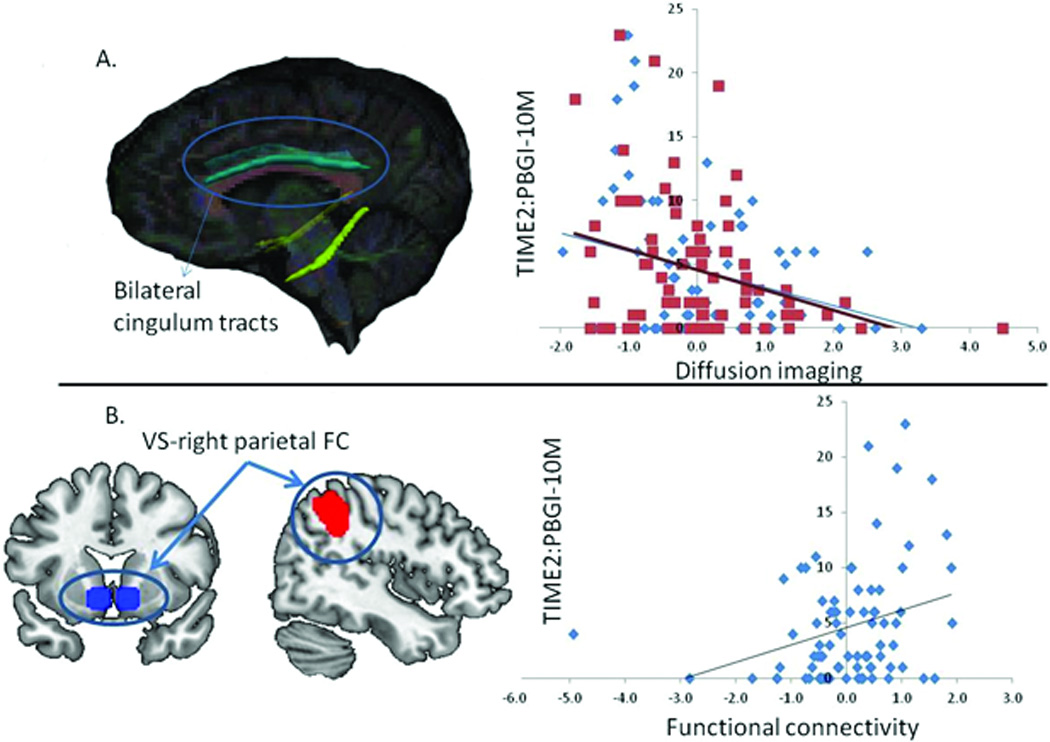
Behavioral and emotional dysregulation in childhood may be understood as prodromal to adult psychopathology. Additionally, there is a critical need to identify biomarkers reflecting underlying neuropathological processes that predict clinical/behavioral outcomes in youth. We aimed to identify such biomarkers in youth with behavioral and emotional dysregulation in the Longitudinal Assessment of Manic Symptoms (LAMS) study. We examined neuroimaging measures of function and white matter in the whole brain using 80 youth aged 14.0 (s.d.=2.0) from three clinical sites. Linear regression using the LASSO (Least Absolute Shrinkage and Selection Operator) method for variable selection was used to predict severity of future behavioral and emotional dysregulation measured by the Parent General Behavior Inventory-10 Item Mania Scale (PGBI-10M)) at a mean of 14.2 months follow-up after neuroimaging assessment. Neuroimaging measures, together with near-scan PGBI-10M, a score of manic behaviors, depressive behaviors and sex, explained 28% of the variance in follow-up PGBI-10M. Neuroimaging measures alone, after accounting for other identified predictors, explained ~1/3 of the explained variance, in follow-up PGBI-10M. Specifically, greater bilateral cingulum length predicted lower PGBI-10M at follow-up. Greater functional connectivity in parietal-subcortical reward circuitry predicted greater PGBI-10M at follow-up. For the first time, data suggest that multimodal neuroimaging measures of underlying neuropathologic processes account for over a third of the explained variance in clinical outcome in a large sample of behaviorally and emotionally dysregulated youth. This may be an important first step toward identifying neurobiological measures with the potential to act as novel targets for early detection and future therapeutic interventions.
Conflict of interest statement
statement: Bertocci, Bebko, Olino, Fournier, Iyengar, Horwitz, Axelson, Holland, Schirda, Versace, Almeida, Perlman, Diwadkar, Travis, Bonar, Gill, and Forbes have no financial interests or potential conflicts of interest.
Figures
References
-
- Fu CH, Steiner H, Costafreda SG. Predictive neural biomarkers of clinical response in depression: a meta-analysis of functional and structural neuroimaging studies of pharmacological and psychological therapies. Neurobiology of Disease. 2013;52:75–83. - PubMed
Publication types
MeSH terms
Grants and funding
LinkOut - more resources
Full Text Sources
Other Literature Sources
