. 2016 Apr 1;143(7):1205-16.
doi: 10.1242/dev.129189. Epub 2016 Feb 22.

Retinoic acid-induced premature osteoblast-to-preosteocyte transitioning has multiple effects on calvarial development

Affiliations

Retinoic acid-induced premature osteoblast-to-preosteocyte transitioning has multiple effects on calvarial development

Shirine Jeradi et al. Development. .

Abstract

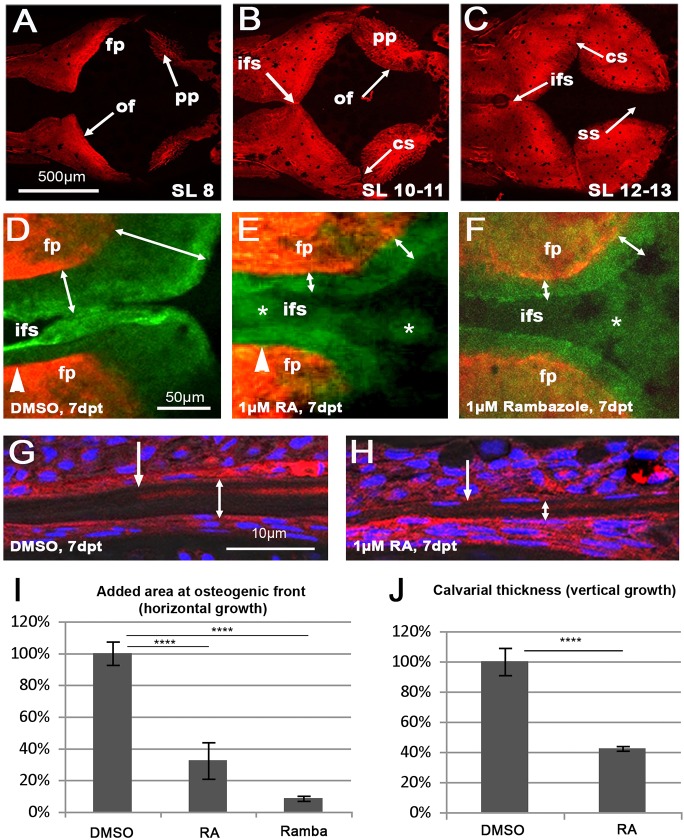
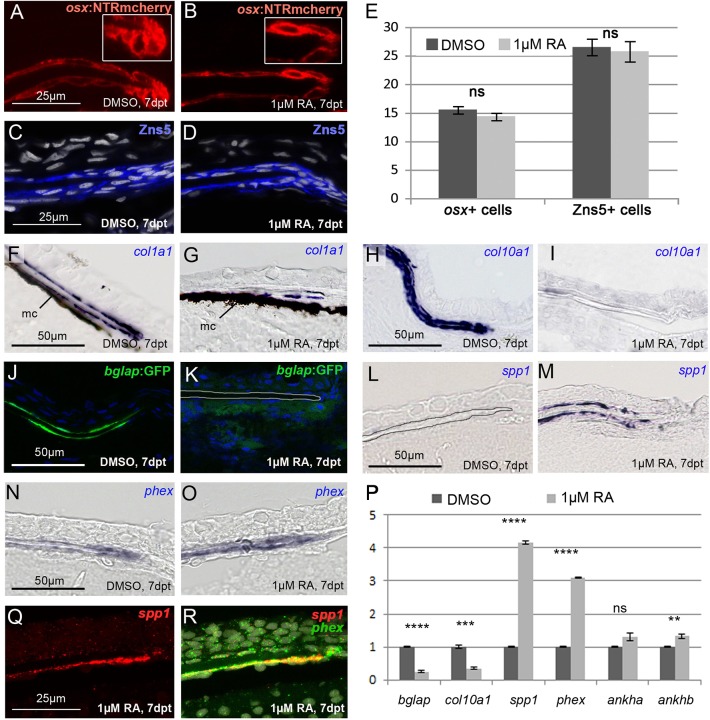
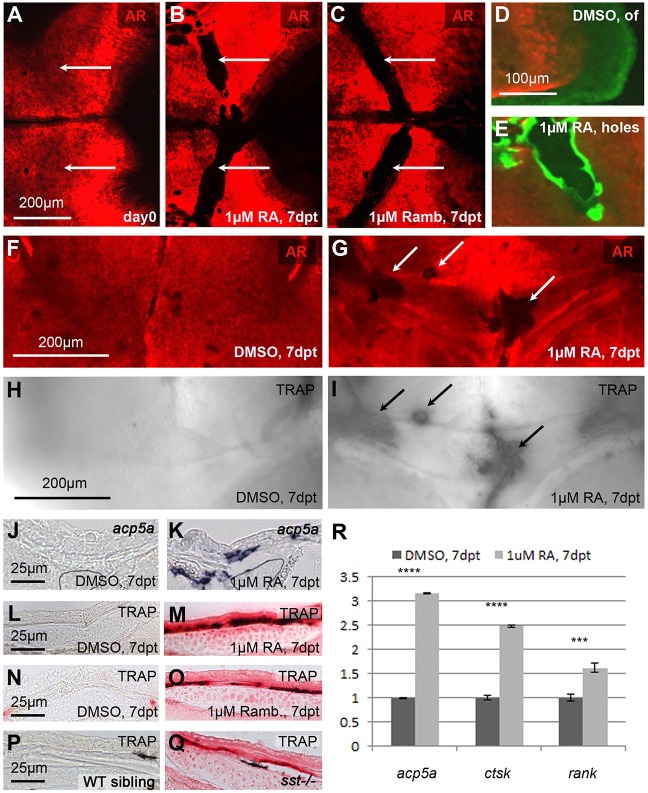
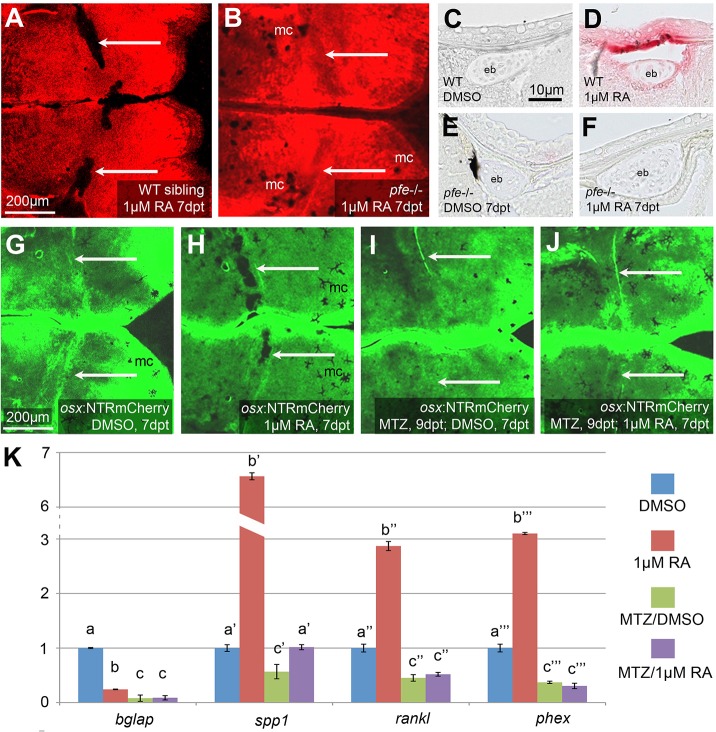
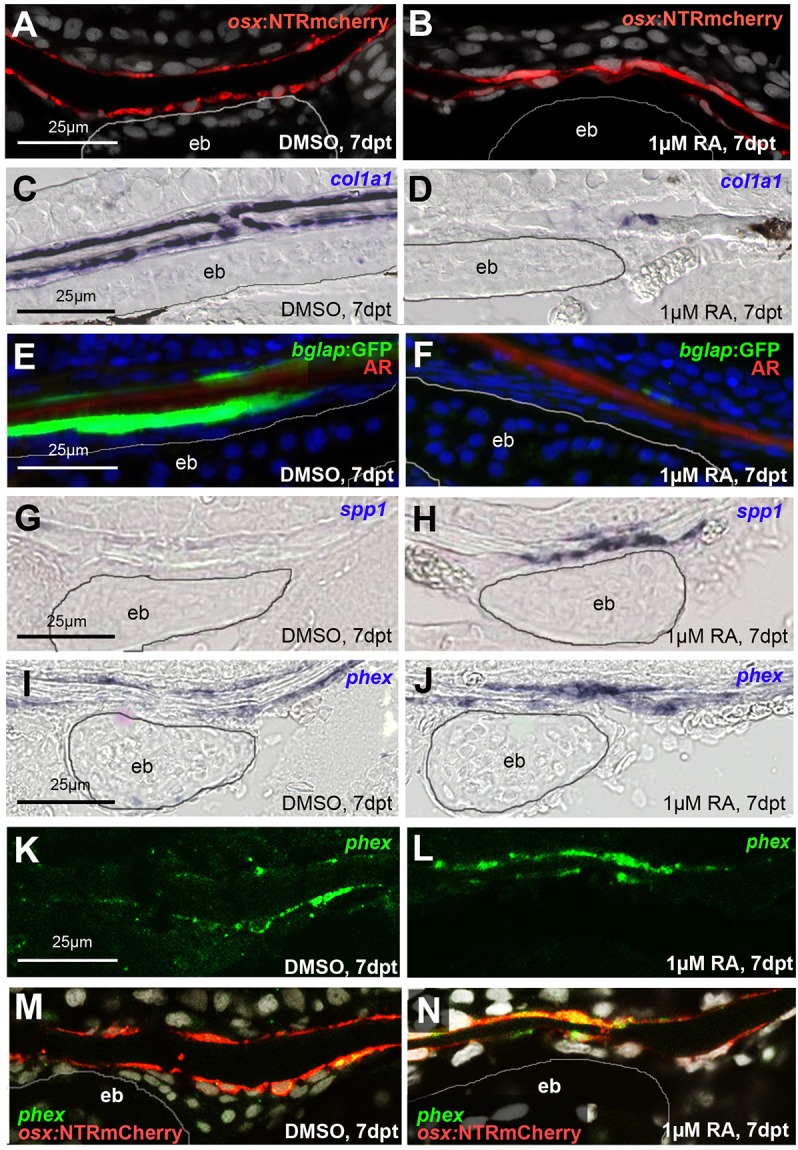
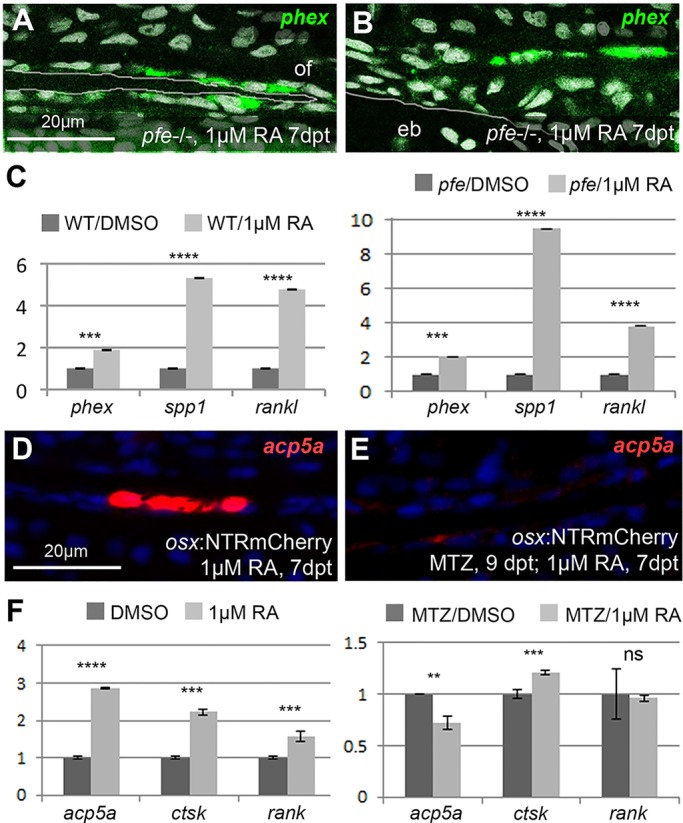
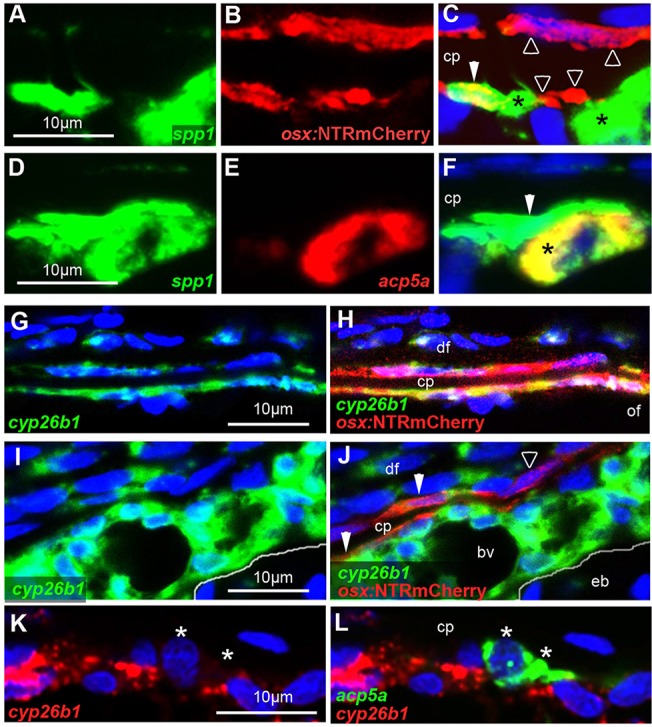
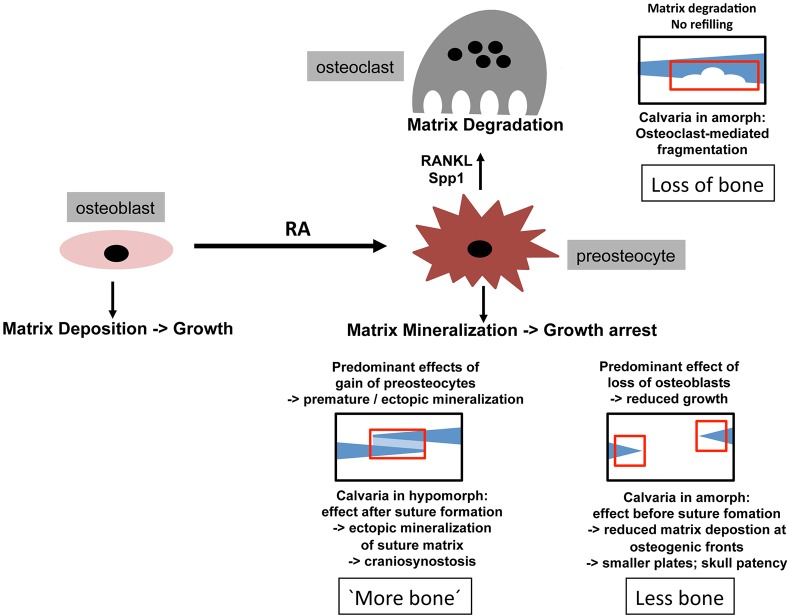
We have previously shown that, in human and zebrafish, hypomorphic mutations of the gene encoding the retinoic acid (RA)-metabolizing enzyme Cyp26b1 result in coronal craniosynostosis, caused by an RA-induced premature transitioning of suture osteoblasts to preosteocytes, inducing ectopic mineralization of the suture's osteoid matrix. In addition, we showed that human CYP26B1 null patients have more severe and seemingly opposite skull defects, characterized by smaller and fragmented calvaria, but the cellular basis of these defects remained largely unclear. Here, by treating juvenile zebrafish with exogenous RA or a chemical Cyp26 inhibitor in the presence or absence of osteogenic cells or bone-resorbing osteoclasts, we demonstrate that both reduced calvarial size and calvarial fragmentation are also caused by RA-induced premature osteoblast-to-preosteocyte transitioning. During calvarial growth, the resulting osteoblast deprival leads to decreased osteoid production and thereby smaller and thinner calvaria, whereas calvarial fragmentation is caused by increased osteoclast stimulation through the gained preosteocytes. Together, our data demonstrate that RA-induced osteoblast-to-preosteocyte transitioning has multiple effects on developing bone in Cyp26b1 mutants, ranging from gain to loss of bone, depending on the allelic strength, the developmental stage and the cellular context.

Keywords: Bone development; Diversity; Retinoic acid; Zebrafish.


Conflict of interest statement

Competing interests

The authors declare no competing or financial interests.

Figures

Fig. 1.
Fig. 1.
Treatment with RA or the Cyp26 inhibitor R115866 leads to impaired horizontal and vertical growth of calvaria. (A-C) Alizarin Red (AR) staining of calvarial pates of untreated juvenile wild-type zebrafish at the indicated standard length (SL); dorsal view of head; anterior to the right. For details, see text. (D-F) Magnified dorsal view of central head region of SL8-9 fish treated with DMSO (D), RA (E) or R115866 (rambazole; F) for 7 days, after consecutive in vivo AR staining (red) before and calcein staining (green) after the treatment. The width of the green-only region is indicated by double-headed arrows. Arrowheads in D,E mark the position of the virtual transverse projections shown in Fig. S1A,B; asterisks in E,F mark diffuse and weak green staining in patent regions of the RA- and R115866-treated fish, but not in the control, most likely representing ectopic ossification of col1a2-encoded collagen in the overlying dermis (Le Guellec et al., 2004; see Fig. S1 and Discussion). (G,H) Transverse sections through frontal plate of SL8-9 fish treated with DMSO (G) or RA (H), in vivo stained with AR before and with DAPI after the treatment. Positions of osteogenic fronts before the treatment are indicated by regular arrows (revealed by the border of the AR-positive stripes); thicknesses of the frontal plates are indicated by double-headed arrows. Note the preferential vertical growth at the inner surface of the calvaria (larger distance between AR-positive stripe of ‘old’ bone and ventral surface of calvaria). (I,J) Quantification of reduced horizontal and vertical growth, expressed as percentage of added area (I) or width (J) of DMSO-treated controls. DMSO: n=7; RA: n=6; rambazol: n=4). Mean values±s.d. are shown. ****P<0.0001. cs, coronal suture; fp, frontal plate; ifs, interfrontal suture; of, osteogenic front; pp, parietal plate; ss, sagittal suture.
Fig. 2.
Fig. 2.
RA induces premature osteoblast-to-preosteocyte transitioning at osteogenic fronts. (A-D,F-R) Transverse sections through the osteogenic front region of a frontal calvarial plate of SL8-9 wild-type fish treated as indicated. (A,B) The number of osx-expressing cells assessed in tg(osx:NTR-mCherry) is unaltered upon RA treatment. However, at the osteogenic front, cells lose their globular shape (see insets for magnification). (C,D) Immunofluorescence with Zns5 antibody, counterstained with DAPI, reveals unaltered numbers and distributions of osteogenic cells upon RA treatment. (E) Quantification of osx- and Zns5-positive cells in corresponding regions at the osteogenic front. DMSO: n=8; RA: n=10. Mean values±s.d. are shown. (F-I) In situ hybridizations, revealing strongly impaired expression of the collagen genes col1a1 (F,G) and col10a1 (H,I) in bone-lining cells of RA-treated fish. In F,G, H2O2 treatment had been omitted, leaving the melanocytes (mc) of the meninges (Goldgeier et al., 1984) visible as black cells. (J,K) Expression of bglap as assessed in tg(bglap:GFP) is downregulated in the RA-treated samples. In K, the borders of the calvarial plate are outlined. (L-O) In situ hybridizations, revealing increased expression of spp1 (L,M) and the preosteocyte marker phex (N,O) in bone-lining cells of the RA-treated fish. (P) qRT-PCR analyses of isolated calvaria: the RA-treated sample displays a highly significant downregulation of the osteoblast markers bglap and col10a1, and a highly significant upregulation of the preosteocyte markers phex and spp1, whereas ankha and ankhb, other mammalian osteocyte markers (Franz-Odendaal et al., 2006; Laue et al., 2011), were not increased or only moderately increased. (Q,R) Double fluorescence in situ hybridization revealing coexpression of spp1 (red; single channel in Q) and phex (green; merged image in R; counterstained with DAPI in white) in bone-lining cells of RA-treated fish. **P<0.01, ***P<0.001, ****P<0.0001, ns, not significant.
Fig. 3.
Fig. 3.
Treatment with RA or the Cyp26 inhibitor R115866 leads to calvarial bone fragmentation and ectopic osteoclast activation. (A-C) AR staining of SL9-10 fish before treatment (A) and after 7 days of treatment with RA (B) or R115866 (Ramb; C); dorsal view of head region. White arrows point to similar areas at the level of the epiphyseal bar (compare with Fig. S5B), which is continuous before (A), but fragmented after (B,C) the treatment. (D,E) Consecutive in vivo AR staining directly before, and calcein (green) staining after the treatment. The newly synthesized matrix (green) at the sites of fragmentation in the RA-treated fish shows signs of hypermineralization (E; more intense green), in comparison with the newly synthesized matrix at the osteogenic front (of) of the DMSO-treated control (D). (F-I) In vivo AR staining (F,G), followed by enzymatic TRAP staining (H,I); epiphyseal bar region, anterior to the top. Ectopic TRAP is exclusively present in fragmented areas of RA-treated sample (G,I). (J-Q) Transverse sections through epiphyseal bar region showing in situ hybridization for mRNA of the TRAP-encoding gene acp5a (J,K) or enzymatic TRAP staining (L-Q). (J-M) RA-treated fish display ectopic acp5a expression and TRAP activity. (N-Q) Increased TRAP activity is displayed in corresponding regions of fish treated with the Cyp26 inhibitor R115866 (Ramb; O) and in an sst mutant, homozygous for a hypomorphic cyp26b1 mutation (Q). At this level, the calvarial plate of the sst mutant is much thinner than in the wild-type sibling (see Fig. S5E,F for magnifications). (R) qRT-PCR analysis of isolated calvarial plates: the expression of marker genes of active osteoclasts (acp5a, ctsk and rank) is significantly upregulated in RA-treated samples compared with DMSO controls. ***P<0.001, ****P<0.0001.
Fig. 4.
Fig. 4.
Both osteoclasts and osteogenic cells are required to mediate RA-induced calvarial fragmentation. (A,B) AR staining of SL9-10 wild-type sibling (A; n=7/7) and pfe mutant (B; n=9/9) after 7 days of RA treatment. Arrows point to calvarial fragmentations in the wild type and corresponding regions in pfe mutant, which lacks fragmentation. (C-F) TRAP labeling of transverse sections through epiphyseal bar (eb) region, where RA-calvarial fragmentation occurs (see Fig. S4B). In comparison with wild-type siblings (D; n=3/3), RA treatment fails to induce TRAP activity in pfe mutant (F; n=4/4), with staining comparable to the untreated WT sibling (C; n=3/3) or mutant (E; n=3/3). (G-J) Calcein staining of osx:NTRmcherry transgenic fish after MTZ treatment (I,J) for osteogenic cell ablation, and/or RA (H,J) or DMSO (G,I) treatment. After ablation of osteogenic cells (J; n=7/7), RA fails to induce calvarial fragmentation seen in the RA only-treated transgenic fish (H; n=5/5). Also, pure ablation of osteogenic cells fails to cause calvarial fragmentation (I; n=6/6). Arrows point to calvarial fragmentations in the RA-treated, non-ablated transgenic, and corresponding regions of the other specimens lacking fragmentation. (K) Comparative qRT-PCR analysis of isolated calvarial plates from SL11-12 sibling fish containing (−MTZ) or lacking (+MTZ) osteogenic cells, and treated (RA) or not treated (DMSO) with RA. Columns with same superscript letter (a,b,c) are not significantly different (P>0.05). In the absence of osteogenic cells (MTZ+RA), RA fails to significantly induce expression of phex and rankl (MTZ+RA versus MTZ+DMSO), whereas spp1 is much more weakly induced (1.8× in MTZ+RA versus MTZ+DMSO, compared with 6.6× in RA versus DMSO). The remaining spp1 induction most likely reflects expression in other cell types (compare with Fig. 6F and see Discussion). Furthermore, RA-treated fish containing osteogenic cells (RA) display 5.5-fold higher expression levels of the direct osteoclastogenesis effector rankl compared with RA-treated fish lacking osteogenic cells (MTZ+RA). mc, melanocytes.
Fig. 5.
Fig. 5.
RA induces premature osteoblast-to-preosteocyte transitioning at calvarial fragmentation sites. A,B,G-N show sagittal, and C-F show transverse sections through the fragmentation sites above the epiphyseal bar (eb; outlined) of the frontal plate of SL9-10 wild-type fish treated as indicated. (A,B) The number of osx-expressing cells, as assessed in tg(osx:NTR-mCherry), is unaltered upon RA treatment (9.0±1.26 cells in defined area above epiphyseal bar in DMSO control versus 9.2±1.06 cells in corresponding region of RA-treated fish; n=12 confocal stacks from three independent specimen for each condition). In B, the space separating the two osx-positive lines is strongly reduced, reflecting the thinning or complete loss of the calvarial plate. (C,D) In situ hybridizations, revealing strongly impaired expression of the collagen gene col1a1 in bone-lining cells of the RA-treated fish. (E,F) Expression of bglap, a marker for mature osteoblasts, as assessed in tg(bglap:GFP), is downregulated in RA-treated sample. (G-J) In situ hybridizations, revealing increased expression of spp1 (G,H) and the preosteocyte marker phex (I,J) in bone-lining cells of the RA-treated fish. (K-M) phex in situ hybridization (K,L; green), counterstained via anti-RFP immunolabeling of osteogenic cells expressing the osx:NTRmCherry transgene (red; merged images in M,N). phex induction by RA is most prominent in osteogenic cells above the epiphyseal bar.
Fig. 6.
Fig. 6.
In mutants lacking osteoclasts, preosteocytes are normally induced, whereas osteoclast markers cannot be induced after ablation of osteogenic cells. (A,B) Fluorescent phex in situ hybridization of RA-treated pfe mutants at osteogenic front (A; of) and calvarial fragmentation site (B), counterstained with DAPI (white). pfe mutants display a similar phex expression pattern as RA-treated wild-type controls (Figs 2R vs 5L). (C) qRT-PCR analysis of osteoblast marker genes in pfe mutants and wild-type controls after DMSO or RA treatment. The preosteocyte markers phex and rankl are induced by RA in pfe−/− mutants to a similar extent as in wild-type controls; spp1 induction is even stronger than in wild-type controls (9.5× versus 5.3×), pointing to an inhibitory role of osteoclasts on Spp1 production in preosteocytes (Sims and Martin, 2014). (D,E) In the absence of osteogenic cells, RA fails to induce osteoclastic acp5a expression in epiphyseal bar region (E), in contrast to controls containing osteogenic cells (D). (F) qRT-PCR analysis of osteoclastic marker gene expression. In the absence of osteogenic cells, RA induces a down-, rather than an upregulation of the osteoclast-specific marker gene acp5a, whereas rank levels, which are 1.56±0.13× increased upon RA treatment of wild-type controls, do not respond to RA. By contrast, ctsk expression is induced (1.2±0.02×), but induction is weaker than in controls (2.2±0.09×). The remaining ctsk and spp1 (Fig. 4K) induction is most likely due to their activation in other cell types such as macrophages, consistent with former reports (Bühling et al., 2001; Rittling, 2011). **P<0.01, ***P<0.001, ****P<0.0001, ns, not significant.
Fig. 7.
Fig. 7.
Osteoclasts are tightly associated with preosteocytes and, in contrast to osteogenic cells, lack cyp26b1 expression. All images show wild-type specimens at 7 dpt with RA. DMSO-treated controls stained in parallel lacked detectable spp1, acp5a and cyp26b1 signals (not shown). A-F,I-L show sagittal sections through sites of calvarial fragmentation; G,H show transverse sections at the osteogenic front region of a frontal plate, labeled by in situ hybridization with the indicated probes and/or anti-RFP immunolabeling of osteogenic cells expressing tg(osx:NTRmCherry). Osteoclasts are labeled with asterisks, preosteocytes with filled arrowheads, and other osteogenic cells with open arrowheads. (A-C) spp1 is expressed in an osx+ cell (preosteocyte), which is tightly associated with an spp1+, osx cell (osteoclast) (n=8/8). Note that particularly on the outer surface of the calvarial plate, not all osx+ cells express spp1. (D-F) ssp1 is expressed in an acp5a+ osteoclast, which is tightly associated with an ssp1+, acp5a cell (preosteocyte) (n=13/13). (G,H) At the osteogenic front, almost all osx+ osteogenic cells lining the growing calvarial plate display RA-induced cyp26b1 expression (n=5/5). (I,J) Sites of calvarial fragmentation contain both cyp26b1+ and cyp26b1 osteogenic cells (osx+). Note that chondrocytes in the epiphyseal bar lack RA-induced cyp26b1 expression (n=5/5). (K,L) acp5a+ osteoclasts lack cyp26b1 expression (n=8/8). Panels G-J show additional cyp26b1 expression in dermal fibroblasts, known targets of RA signaling (Nelson and Balian, 1984; Varani et al., 1990). Panels I-L show additional and very strong RA-induced cyp26b1 expression in a distinct tissue adjacent to the epiphyseal bar. The exact nature of this tissue is unknown. It contains multiple blood vessels, not seen in such sizes and densities in other subcalvarial regions (compare with Fig. S5A). bv, blood vessel; cp, calvarial plate; df, dermal fibrobasts; eb, epiphyseal bar; of, osteogenic front.
Fig. 8.
Fig. 8.
Model of how RA-induced premature osteoblast-to-preosteocyte transitioning can have multiple and contrary effects on the net bone mass in developing calvaria. Regular bone is in dark blue, ectopic bone in light blue. Affected regions are boxed in red. Gain of preosteocytes in coronal suture of hypomorph leads to ectopic mineralization of suture matrix (seemingly more bone; bottom left). Loss of osteoblasts at growing edges of calvaria of amorph leads to reduced matrix deposition, ceased calvarial growth and skull patency (less bone; bottom right). Osteoclast activation by gained preosteocytes in amorph leads to the resorption of formerly formed calvarial bone (loss of bone; top right).

Similar articles

Cited by

References

    1. Apschner A., Huitema L. F. A., Ponsioen B., Peterson-Maduro J. and Schulte-Merker S. (2014). Zebrafish enpp1 mutants exhibit pathological mineralization, mimicking features of generalized arterial calcification of infancy (GACI) and pseudoxanthoma elasticum (PXE). Dis. Model. Mech. 7, 811-822. 10.1242/dmm.015693 - DOI - PMC - PubMed
    1. Balkan W., Rodríguez-Gonzalez M., Pang M., Fernandez I. and Troen B. R. (2011). Retinoic acid inhibits NFATc1 expression and osteoclast differentiation. J. Bone Miner. Metab. 29, 652-661. 10.1007/s00774-011-0261-0 - DOI - PubMed
    1. Barros N. M. T., Hoac B., Neves R. L., Addison W. N., Assis D. M., Murshed M., Carmona A. K. and McKee M. D. (2013). Proteolytic processing of osteopontin by PHEX and accumulation of osteopontin fragments in Hyp mouse bone, the murine model of X-linked hypophosphatemia. J. Bone Miner. Res. 28, 688-699. 10.1002/jbmr.1766 - DOI - PubMed
    1. Begemann G., Schilling T. F., Rauch G. J., Geisler R. and Ingham P. W. (2001). The zebrafish neckless mutation reveals a requirement for raldh2 in mesodermal signals that pattern the hindbrain. Development 128, 3081-3094. - PubMed
    1. Bühling F., Reisenauer A., Gerber A., Krüger S., Weber E., Brömme D., Roessner A., Ansorge S., Welte T. and Röcken C. (2001). Cathepsin K--a marker of macrophage differentiation? J. Pathol. 195, 375-382. 10.1002/path.959 - DOI - PubMed

Publication types

MeSH terms

LinkOut - more resources