. 2016 Apr 15;291(16):8575-90.
doi: 10.1074/jbc.M116.718841. Epub 2016 Feb 22.

Molecular Insights into Toluene Sensing in the TodS/TodT Signal Transduction System

Affiliations

Molecular Insights into Toluene Sensing in the TodS/TodT Signal Transduction System

Serry Koh et al. J Biol Chem. .

Abstract

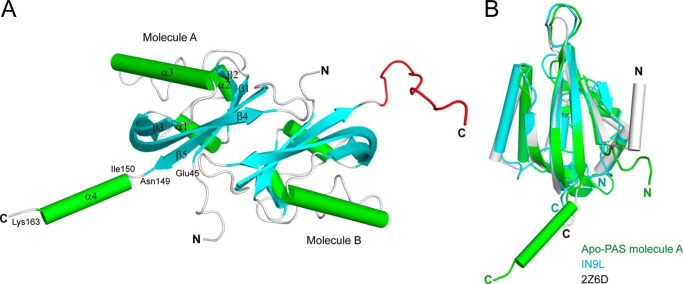
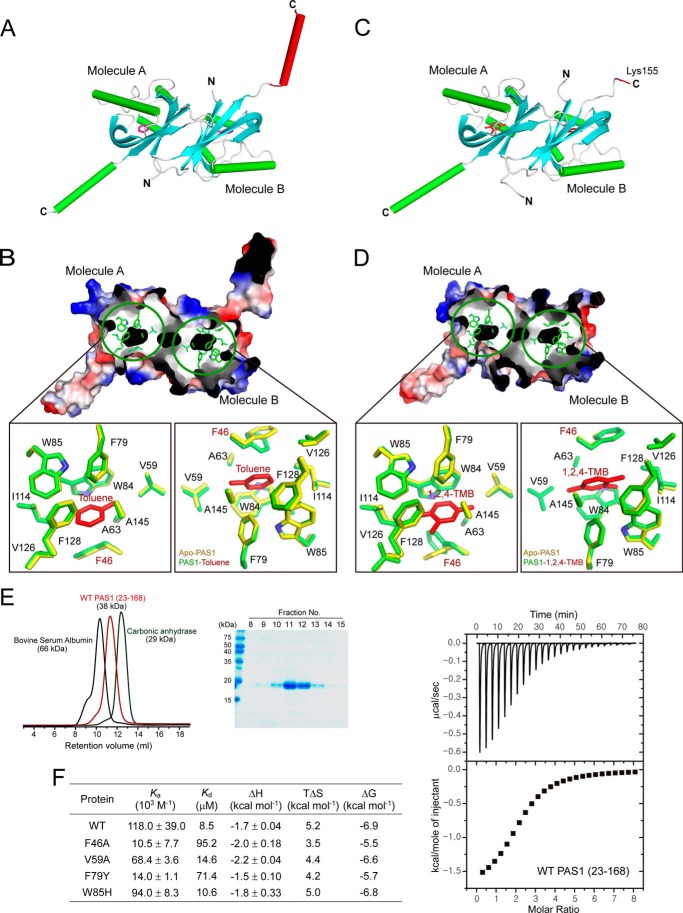
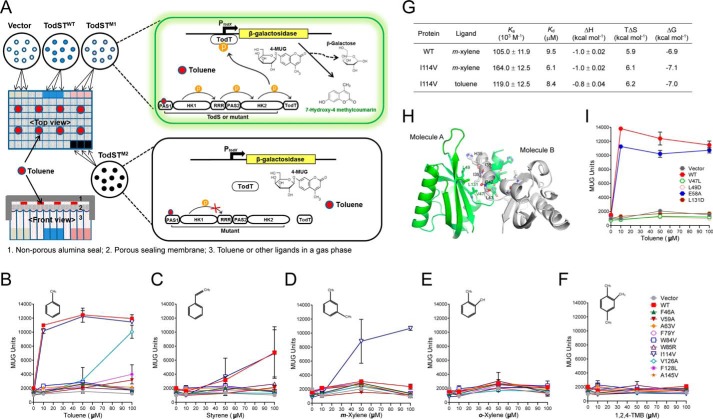
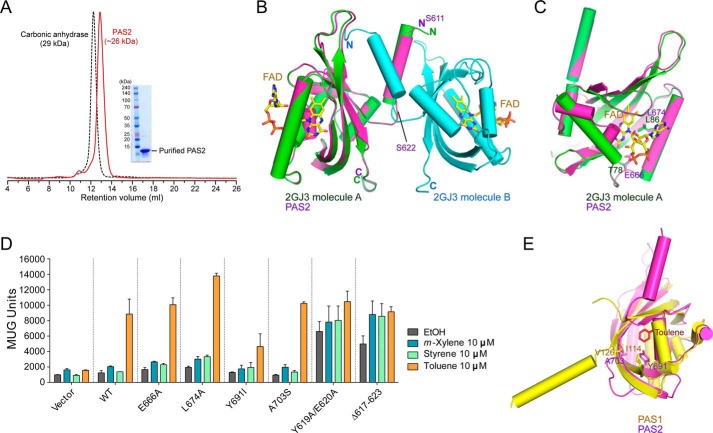
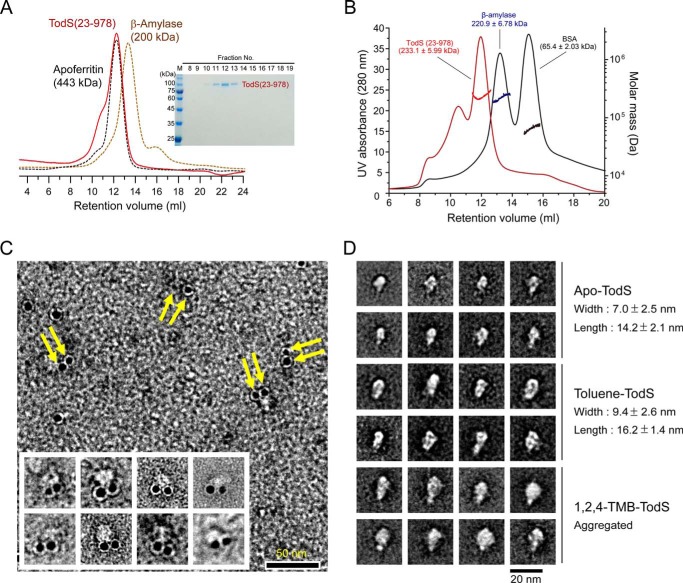
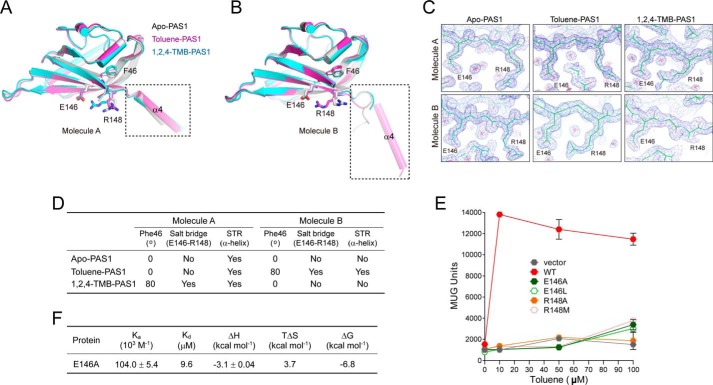
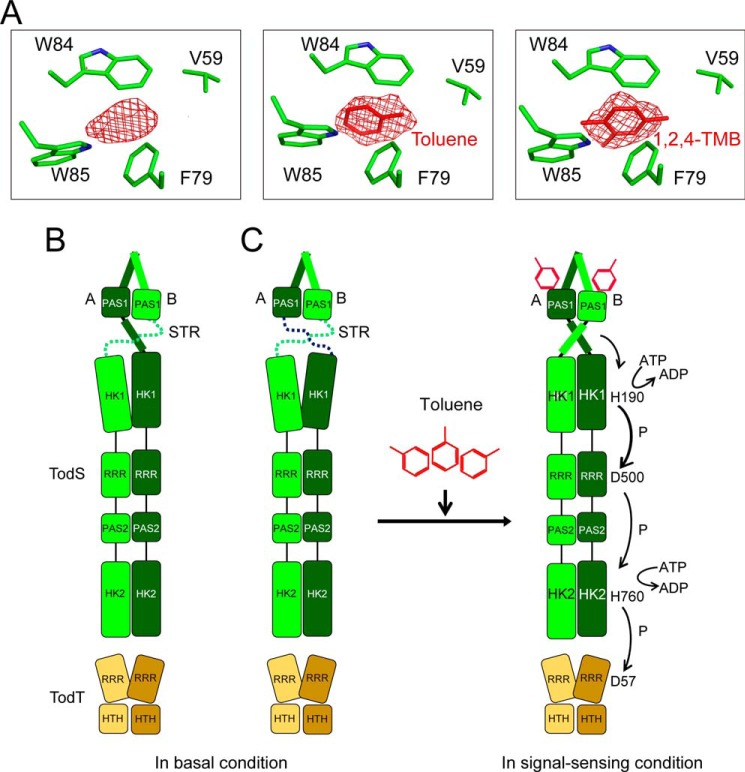
TodS is a sensor kinase that responds to various monoaromatic compounds, which either cause an agonistic or antagonistic effect on phosphorylation of its cognate response regulator TodT, and controls tod operon expression in Pseudomonas putida strains. We describe a molecular sensing mechanism of TodS that is activated in response to toluene. The crystal structures of the TodS Per-Arnt-Sim (PAS) 1 sensor domain (residues 43-164) and its complex with toluene (agonist) or 1,2,4-trimethylbenzene (antagonist) show a typical β2α3β3 PAS fold structure (residues 45-149), forming a hydrophobic ligand-binding site. A signal transfer region (residues 150-163) located immediately after the canonical PAS fold may be intrinsically flexible and disordered in both apo-PAS1 and antagonist-bound forms and dramatically adapt an α-helix upon toluene binding. This structural change in the signal transfer region is proposed to result in signal transmission to activate the TodS/TodT two-component signal transduction system. Site-directed mutagenesis and β-galactosidase assays using a P. putida reporter strain system verified the essential residues involved in ligand sensing and signal transfer and suggest that the Phe(46) residue acts as a ligand-specific switch.

Keywords: Pseudomonas; bacterial signal transduction; biodegradation; histidine kinase; x-ray crystallography.


Figures

FIGURE 1.
FIGURE 1.
Overall structure of apo-PAS1. A, ribbon representation of the structure of TodS PAS1 in an asymmetric configuration. There are two PAS1 molecules in the asymmetric unit. The β-sheets and α-helices are shown in cyan and green, respectively. The C-terminal disordered region in molecule B corresponding to α4 in molecule A is displayed in red. B, apo-PAS1 (green) superimposed onto the LOV/PAS domain of the C. reinhardtii photoreceptor (Protein Data Bank code 1N9L; cyan) and the LOV1 domain of the Arabidopsis blue light receptor protein phototropin-2 (Protein Data Bank code 2Z6D; gray).
FIGURE 2.
FIGURE 2.
Toluene sensing by TodS PAS1. A, TodS PAS1 structure in complex with the agonist toluene. There are two toluene-bound PAS1 molecules in the asymmetric unit. Toluene molecules are shown as red carbon atoms. The C-terminal α-helix in molecule B corresponding to the disordered region in molecule B of apo-PAS1 is displayed in red. B, the toluene-binding pocket. The pocket is shown in black in an electrostatic surface representation. The detailed environment of toluene sensing by PAS1 is magnified for both molecules A and B. Toluene (red) is surrounded by hydrophobic PAS1 residues (green). C, PAS1 structure in complex with the antagonist 1,2,4-TMB. There are two antagonist-bound PAS1 molecules in the asymmetric unit. The 1,2,4-TMB molecules are shown as red carbon atoms. The C-terminal disordered region in molecule B corresponding to the disordered region in molecule B of apo-PAS1 is displayed in red. D, the 1,2,4-TMB-binding pocket. The pocket is shown in black in an electrostatic surface representation. The detailed environment of 1,2,4-TMB-binding by PAS1 is magnified for both molecules A and B. Notably, 1,2,4-TMB (red) is surrounded by the same hydrophobic residues (green) as those in the toluene-binding pocket. The corresponding residues (yellow) responsible for forming the hydrophobic pocket in apo-PAS1 are superimposed onto the toluene- and 1,2,4-TMB-binding residues, respectively. Gly48 is not shown in B and D, because only the side chains of all residues are displayed. E, SEC analysis of purified His6-tagged PAS1(23–168). Eluted PAS1 was compared with the molecular weight standard markers BSA (66 kDa) and carbonic anhydrase (29 kDa) (left) and analyzed by SDS-PAGE (right). F, thermodynamic parameters of toluene-binding to PAS1(23–168) and its mutants. The best fitting results were obtained with a “one set of binding” sites model using the ORIGIN software package (MicroCal). The heat data generated by the toluene addition to the reaction buffer were subtracted from the heat data generated from the reaction of each protein variant with toluene. The typical ITC profile for the binding of toluene molecules to WT PAS1(23–168) is displayed.
FIGURE 3.
FIGURE 3.
In vivo validation of PAS1 in the TodS/TodT signal transduction system. A, schematic diagram showing the high-throughput β-galactosidase assay system. The P. putida KT2440-PXZ strain expressing WT-TodS/TodT or its variant mutants was grown in 96-deep well plates in the presence of a gas phase ligand in the range of 10–400 μm for β-galactosidase induction. The activity of the induced β-galactosidase was measured using the hydrolyzed fluorescent substrate, 7-hydroxy-4-methylcourmain, at 465 nm after a 1-h incubation with MUG substrate and calculated as MUG units. B–F, the PAS1 ligand-binding residues were evaluated for their ligand sensing and phospho-signal-relaying capacities, either upon agonist (toluene, styrene, and m-xylene) or antagonist (1,2,4-TMB and o-xylene) application in a gas phase saturated with each ligand supplied over a range of 10–100 μm. G, thermodynamic parameters of toluene or m-xylene binding to WT PAS1(23–168) and its mutant (I114V) proteins. The best fitting results were obtained with a “one set of binding sites” model using the ORIGIN software package (MicroCal). The heat data generated by the toluene or m-xylene addition to the reaction buffer were subtracted from the heat data generated from the reaction of each protein variant either with toluene or m-xylene. H, dimerization of PAS1. The dimeric structure of PAS1 was modeled on the structure of the A. vinelandii NifL LOV domain (Protein Data Bank code 2GJ3). Hydrophobic residues predicted to be involved in dimerization are displayed in green and gray in molecules A and B, respectively. I, the residues involved in dimerization were evaluated using the β-galactosidase assay system in a toluene environment. All results were obtained with three independent experiments. Error bars, S.D.
FIGURE 4.
FIGURE 4.
Role of PAS2 in TodS/TodT signal transduction. A, SEC analysis of purified PAS2(611–729). Eluted PAS2 protein was compared with the molecular weight standard marker carbonic anhydrase (29 kDa) and analyzed as a dimer in solution. B, the modeled PAS2 structure (magenta) based on the dimeric structure (green and cyan) of the A. vinelandii NifL LOV domain (Protein Data Bank code 2GJ3). FAD binding to each NifL PAS domain is shown. The N-terminal α-helix (residues Ser611–Ser622) of PAS2 predicted to be involved in dimerization is indicated. C, PAS2 residues Glu666 and Leu674, corresponding to the NifL FAD binding residues Thr78 and Leu86. D, potential PAS2 residues involved in ligand binding were assessed using the β-galactosidase assay with different ligands. The N-terminal PAS2 α-helix (residues Ser611–Ser622) predicted to be involved in dimerization, as seen in Fig. 4B, was also evaluated with the same assay. E, the modeled PAS2 was superimposed onto toluene-bound PAS1. The PAS2 residues Tyr691 and Ala703 were analyzed with the corresponding PAS1 residues Ile114 and Val126, which are responsible for toluene binding.
FIGURE 5.
FIGURE 5.
SEC-MALS and electron microscopic analyses of TodS. A, SEC analysis of purified TodS(23–978). Eluted TodS was compared with the molecular mass standard markers β-amylase (223.8 kDa) and apoferritin (443 kDa). B, SEC-MALS analysis of TodS(23–978). Horizontal lines across the peaks indicate the calculated molecular mass of eluted TodS(23–978) (red), β-amylase (blue), and BSA (black). The inset shows SDS-PAGE of purified TodS(23–978) used for SEC-MALS analysis. C, electron microscopic image of gold-labeled TodS proteins. Ni-NTA-gold labeling of C-terminal His6-tagged TodS(43–978) proteins was employed to define the molecular arrangement of the TodS dimer. Shown is a negative-stained image showing paired circular gold particles (yellow arrows), suggesting a head-to-head dimer of TodS. Scale bar, 50 nm. D, molecular appearance of TodS(23–978) proteins. Electron microscopic images of apo-TodS (top), TodS treated with toluene (middle), and TodS treated with 1,2,4-TMB (bottom) were visualized by negative staining. Ten representative images were selected. Scale bar, 20 nm.
FIGURE 6.
FIGURE 6.
Molecular switching by Phe46 for signal transfer. A and B, toluene-bound (magenta) and 1,2,4-TMB-bound (cyan) PAS1 structures were superimposed onto the apo-PAS1 structure (gray). The critical residues for signal transfer (Phe46, Glu146, and Arg148) are displayed. The STR is indicated by the dashed rectangular box. C, 2FoFc electron density maps contoured at 1.1 σ showing the Glu146 and Arg148 positions in each PAS1 structure. D, summary of the signal switching by Phe46 upon binding of different types of ligands. Position of the Phe46 aromatic ring in each PAS1 structure was specified as the degree of tilting relative to that of Phe46 in apo-PAS1. E, evaluation of the residues involved in signal switching with the β-galactosidase assay in a toluene environment. Results were obtained with three independent experiments. F, thermodynamic parameters of toluene-binding to the E146A mutant. The best fit results were obtained with a “one set of binding” sites model using the ORIGIN software package (MicroCal). The heat data generated by the toluene addition to the reaction buffer were subtracted from the heat data generated from the reaction of E146A with toluene. Error bars, S.E.
FIGURE 7.
FIGURE 7.
Proposed molecular mechanism of TodS/TodT signal transduction. A, the FoFc electron density map of apo-PAS1 contoured at 3.0 σ (left), corresponding to the maps for toluene contoured at 3.0 σ (center) and 1,2,4-TMB contoured at 2.5 σ (right) of PAS1-ligand complexes, respectively. B and C, proposed models of TodS/TodT signal transduction. TodS exists as a dimer with a flexible nature, which might possess a basal level of autokinase activity. In this condition, the PAS1 sensor domain would not effectively deliver signals to the C-terminal HK1 via the flexible nature of STR. Thus, this conformation could not induce the functional dimeric conformation of HK1 to enable successful autophosphorylation. Upon toluene sensing at an effective level, the PAS1 STRs may be reorganized to transmit signals and induce conformational changes in TodS to align the HK1-RRR-PAS2-HK2 domains for efficient multistep phosphorelay. See “Discussion” for a full description. Molecules A and B in the PAS1 dimer are shown in light green and dark green, respectively. TodT dimers are displayed in light and dark yellow. Toluene molecules are shown in red.

References

    1. Zylstra G. J., McCombie W. R., Gibson D. T., and Finette B. A. (1988) Toluene degradation by Pseudomonas putida F1: genetic organization of the tod operon. Appl. Environ. Microbiol. 54, 1498–1503 - PMC - PubMed
    1. Zylstra G. J., Wackett L. P., and Gibson D. T. (1989) Trichloroethylene degradation by Escherichia coli containing the cloned Pseudomonas putida F1 toluene dioxygenase genes. Appl. Environ. Microbiol. 55, 3162–3166 - PMC - PubMed
    1. Lee J. Y., Roh J. R., and Kim H. S. (1994) Metabolic engineering of Pseudomonas putida for the simultaneous biodegradation of benzene, toluene, and p-xylene mixture. Biotechnol. Bioeng. 43, 1146–1152 - PubMed
    1. Ramos J. L., Duque E., Huertas M. J., and Haïdour A. (1995) Isolation and expansion of the catabolic potential of a Pseudomonas putida strain able to grow in the presence of high concentrations of aromatic hydrocarbons. J. Bacteriol. 177, 3911–3916 - PMC - PubMed
    1. Yu H., Kim B. J., and Rittmann B. E. (2001) A two-step model for the kinetics of BTX degradation and intermediate formation by Pseudomonas putida F1. Biodegradation 12, 465–475 - PubMed

Publication types

MeSH terms

LinkOut - more resources