. 2016 Apr 15;36(9):1342-53.
doi: 10.1128/MCB.01117-15. Print 2016 May.

Analysis of Subcellular RNA Fractions Revealed a Transcription-Independent Effect of Tumor Necrosis Factor Alpha on Splicing, Mediated by Spt5

Affiliations

Analysis of Subcellular RNA Fractions Revealed a Transcription-Independent Effect of Tumor Necrosis Factor Alpha on Splicing, Mediated by Spt5

Gil Diamant et al. Mol Cell Biol. .

Abstract

The proinflammatory cytokine tumor necrosis factor alpha (TNF-α) modulates the expression of many genes, primarily through activation of NF-κB. Here, we examined the global effects of the elongation factor Spt5 on nascent and mature mRNAs of TNF-α-induced cells using chromatin and cytosolic subcellular fractions. We identified several classes of TNF-α-induced genes controlled at the level of transcription, splicing, and chromatin retention. Spt5 was found to facilitate splicing and chromatin release in genes displaying high induction rates. Further analysis revealed striking effects of TNF-α on the splicing of 25% of expressed genes; the vast majority were not transcriptionally induced. Splicing enhancement of noninduced genes by TNF-α was transient and independent of NF-κB. Investigating the underlying basis, we found that Spt5 is required for the splicing facilitation of the noninduced genes. In line with this, Spt5 interacts with Sm core protein splicing factors. Furthermore, following TNF-α treatment, levels of RNA polymerase II (Pol II) but not Spt5 are reduced from the splicing-induced genes, suggesting that these genes become enriched with a Pol II-Spt5 form. Our findings revealed the Pol II-Spt5 complex as a highly competent coordinator of cotranscriptional splicing.


Figures

FIG 1
FIG 1
Analysis of TNF-α-induced mRNAs in different subcellular compartments. (A) Fractionation of HeLa cells into cytosol, nucleosol, and chromatin fractions. Spt5 KD and control HeLa cells were treated with TNF-α for 1 h and harvested. Spt5 KD efficiency was validated using Western blotting (left panel). Cells were separated into cytosol and whole nuclei, and nuclei were further fractionated into nuclear soluble (nucleosol) and chromatin fractions. Cell-equivalent amounts of cytosol, whole nuclei, and nucleosol protein samples were analyzed by Western blotting using antitubulin and anti-H3 antibodies (right panel). (B) Global effects of TNF-α and Spt5 KD on mRNA levels in subcellular compartments. Cytosolic and chromatin RNA samples were subjected to high-throughput sequencing as described in Materials and Methods. Reads were aligned to the hg19 human genome assembly, and the indicated ratios were calculated between samples in each RNA fraction separately. The resulting gene list was clustered into 10 distinct groups. The heat map presents the log of the calculated ratios of differentially expressed genes for each fraction as indicated below the map.
FIG 2
FIG 2
Transcript accumulation kinetics. HeLa cells were treated with TNF-α for the indicated durations. Cells were harvested, and RNA was extracted from the cytosolic and chromatin fractions. mRNA (mature) levels of representative genes from the TNF-α-induced clusters 1 to 4 were analyzed by RT-qPCR (primer information available on request). Graphs present RNA levels normalized to the level of GAPDH (glyceraldehyde-3-phosphate dehydrogenase) in both fractions and calibrated to that of the untreated cytosolic sample, which was set to 1.
FIG 3
FIG 3
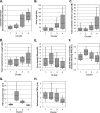
Features associated with genes affected by TNF-α and Spt5 at the level of chromatin retention. (A) Box plot presentation of the distribution of chromatin retention levels in clusters 1 to 4 following TNF-α induction. The bars represent the median, 25%, and 75% quartile values; the top and the bottom whiskers represent the 75 to 87.5% and 12.5 to 25% ranges of the population, respectively. (B) Box plot presentation of the distribution of gene lengths in TNF-α-induced clusters 1 to 4. (C) Distribution of intron length in clusters 1 to 4. (D) Distribution of exon length in clusters 1 to 4. (E) Distribution of exon density (number of exons/kb). (F) Spt5 KD effect on chromatin retention levels of the TNF-α-induced genes. (G) Distribution of TNF-α induction (fold) in clusters 1 to 4. (H) Distribution of the effect of TNF-α on the splicing of genes in clusters 1 to 4 as described in the legend to Fig. 4A. AU, arbitrary units.
FIG 4
FIG 4
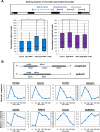
Analysis of splicing following TNF-α induction and Spt5 KD. (A) The upper panel shows a scheme of the RNA-Seq splicing analysis. Chromatin-associated reads aligned to the exon-exon junction or the exon-intron junction were separately combined to generate spliced and unspliced pools. Counted reads are from genes whose FPKM values were >2 for exonic reads and >0.4 for intronic reads. The distribution of the spliced and unspliced pools from each of the indicated samples is shown in box plots. Asterisks denote statistically significant differences (P < 0.0001). The genes in each pool were further analyzed using Fisher's exact test, which yields an odds ratio (measure of the difference in splicing efficiency in a given gene between samples) and a P value. (B) HeLa cells were treated with TNF-α for the noted durations and harvested. RNA samples were produced from the chromatin-associated fraction, reverse transcribed with random hexamers, and subjected to splicing efficiency analysis. The upper panel shows a schematic representation of the primer pairs used to detect the levels of spliced and unspliced transcripts. Validation of the PCR products was done by polyacrylamide gel electrophoresis (see Fig. S5 in the supplemental material for several examples). Spliced and unspliced transcripts from representative genes from the list of genes whose splicing was induced by TNF-α were analyzed by RT-qPCR and normalized to the level of GAPDH. The graphs present the ratios between spliced and unspliced transcripts at different time points of two independent experiments.
FIG 5
FIG 5
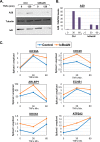
TNF-α-facilitated splicing of noninduced genes is independent of NF-κB. (A) HeLa cells were transfected with dominant IκBα (IκBαΔN) or control vector for 48 h and then treated with TNF-α for 120 min or left untreated. Cells were then harvested and subjected to Western blotting with the indicated antibodies. (B and C) IκBαΔN transfected HeLa cells were treated with TNF-α for 30 and 60 min, and RNA was prepared from the chromatin fraction. Levels of the A20 and GAPDH mRNAs were determined by RT-qPCR (B). The levels of spliced and unspliced transcripts of representative genes were determined as described in the legend to Fig. 4B (C). The graphs are representative of two independent repeats.
FIG 6
FIG 6
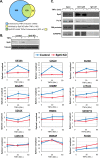
TNF-α and Spt5 regulate splicing cooperatively. (A) Venn diagram showing the number of genes whose splicing was enhanced by TNF-α independently of NF-κB and the number of genes with inhibited splicing following Spt5 KD and TNF-α treatment. (B) Control and Spt5 KD HeLa cells were treated with TNF-α for the indicated times. Spt5 KD efficiency is shown in the upper panel. Chromatin-associated fractions were then produced and reverse transcribed. The levels of spliced and unspliced transcripts of representative genes were analyzed by RT-PCR and normalized to the level of GAPDH. Graphs present three independent experiments (average ± standard error of the mean). (C) HeLa cells either left untreated or treated with TNF-α for 30 min were harvested. Cell lysates were then subjected to coimmunoprecipitation using anti-Spt5 antibody or rabbit IgG. The immunoprecipitated proteins were detected using anti-Spt5, anti-Pol II, anti-SM proteins, and anti-hnRNPA1 antibodies.
FIG 7
FIG 7
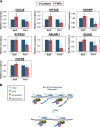
Pol II-Spt5 complex is splicing competent. (A) HeLa cells, treated with TNF-α for 30 min or left untreated, were subjected to chromatin immunoprecipitation (ChIP) using anti-Spt5, anti-Pol II, or control (for background levels) antibodies. Analysis was performed by qPCR using primers directed to the center of the genes. Graphs show occupancy levels normalized to the input levels. The uninduced sample was set to 1. ChIP analyses of additional 5′ and 3′ locations of a few genes are shown in Fig. S10C in the supplemental material. The results represent the average ± standard error of the mean of at least three independent experiments. *, P < 0.05. (B) A model showing the occupancy of a splicing-induced non-NF-κB target gene by Pol II, Spt5, and the splicing machinery under basal and TNF-α-induced conditions.

Similar articles

Cited by

References

    1. Yamaguchi Y, Shibata H, Handa H. 2013. Transcription elongation factors DSIF and NELF: promoter-proximal pausing and beyond. Biochim Biophys Acta 1829:98–104. doi:10.1016/j.bbagrm.2012.11.007. - DOI - PubMed
    1. Lindstrom DL, Squazzo SL, Muster N, Burckin TA, Wachter KC, Emigh CA, McCleery JA, Yates JR III, Hartzog GA. 2003. Dual roles for Spt5 in pre-mRNA processing and transcription elongation revealed by identification of Spt5-associated proteins. Mol Cell Biol 23:1368–1378. doi:10.1128/MCB.23.4.1368-1378.2003. - DOI - PMC - PubMed
    1. Mandal SS, Chu C, Wada T, Handa H, Shatkin AJ, Reinberg D. 2004. Functional interactions of RNA-capping enzyme with factors that positively and negatively regulate promoter escape by RNA polymerase II. Proc Natl Acad Sci U S A 101:7572–7577. doi:10.1073/pnas.0401493101. - DOI - PMC - PubMed
    1. Pei Y, Shuman S. 2002. Interactions between fission yeast mRNA capping enzymes and elongation factor Spt5. J Biol Chem 277:19639–19648. doi:10.1074/jbc.M200015200. - DOI - PubMed
    1. Wen Y, Shatkin AJ. 1999. Transcription elongation factor hSPT5 stimulates mRNA capping. Genes Dev 13:1774–1779. doi:10.1101/gad.13.14.1774. - DOI - PMC - PubMed

Publication types

MeSH terms