. 2016 Mar 8;113(10):2774-9.
doi: 10.1073/pnas.1524040113. Epub 2016 Feb 22.

Tetratricopeptide repeat protein protects photosystem I from oxidative disruption during assembly

Affiliations

Tetratricopeptide repeat protein protects photosystem I from oxidative disruption during assembly

Mark Heinnickel et al. Proc Natl Acad Sci U S A. .

Abstract

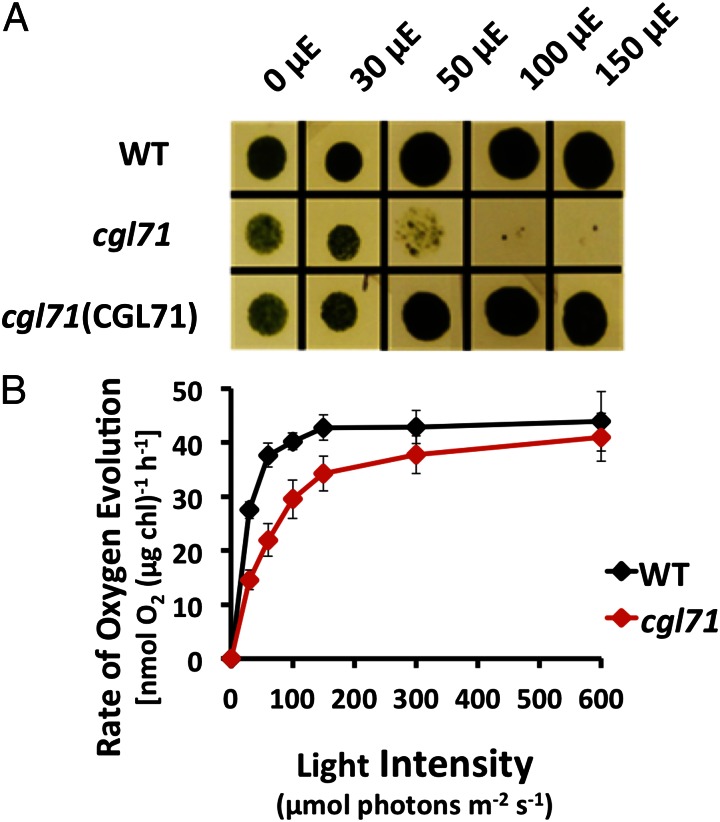
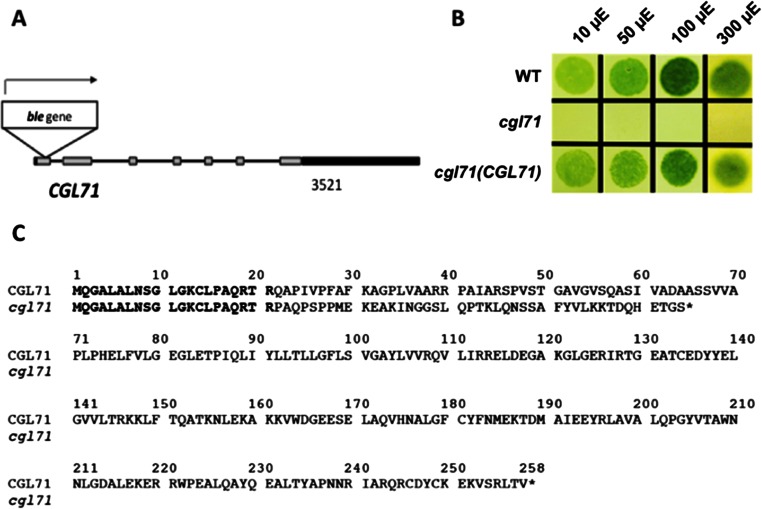
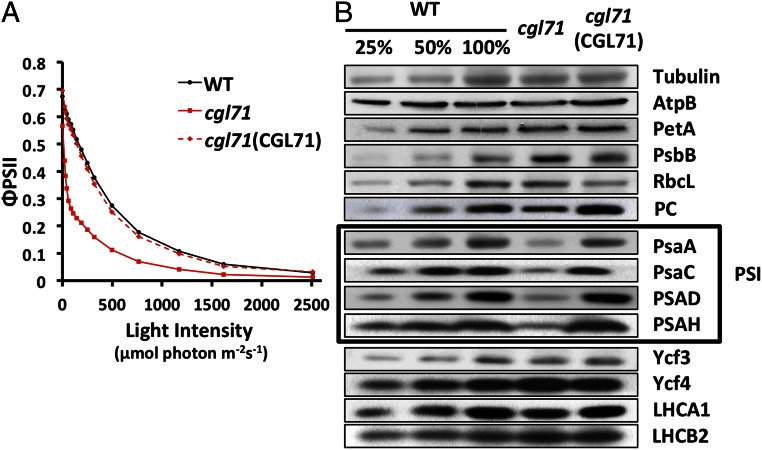
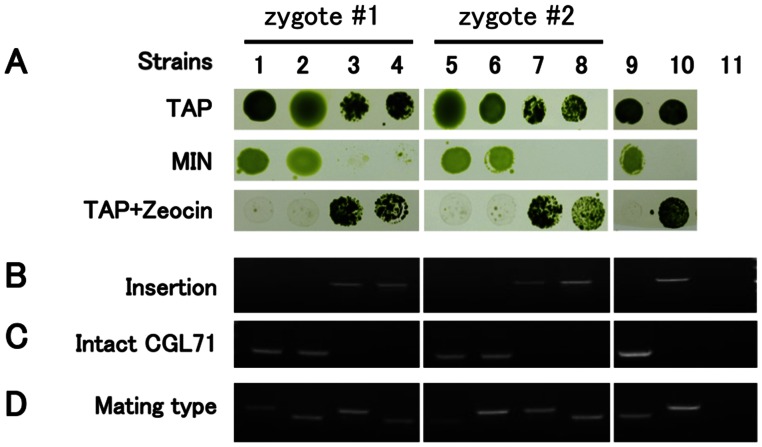
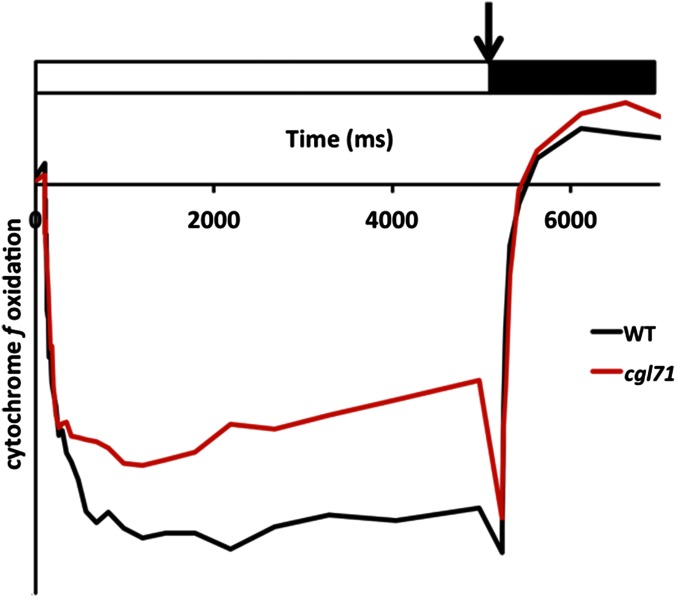
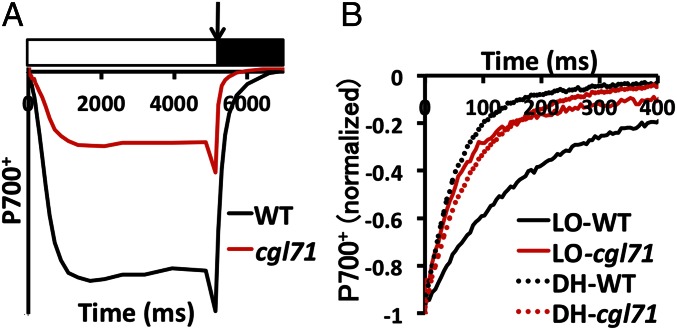
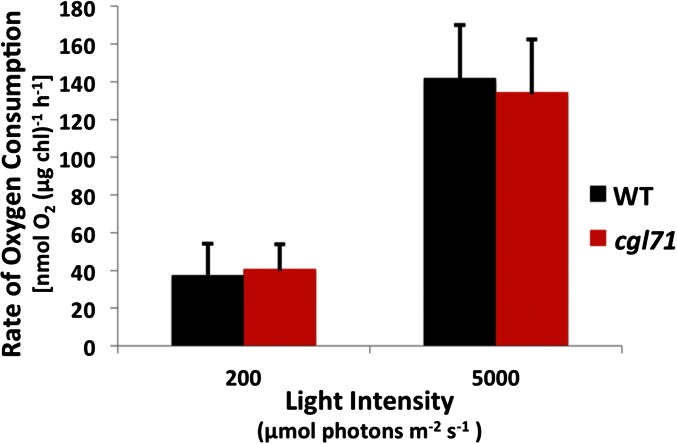
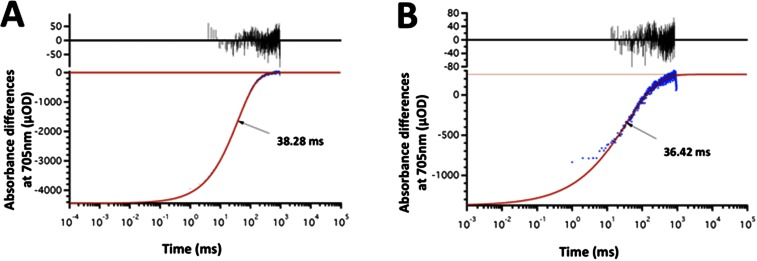
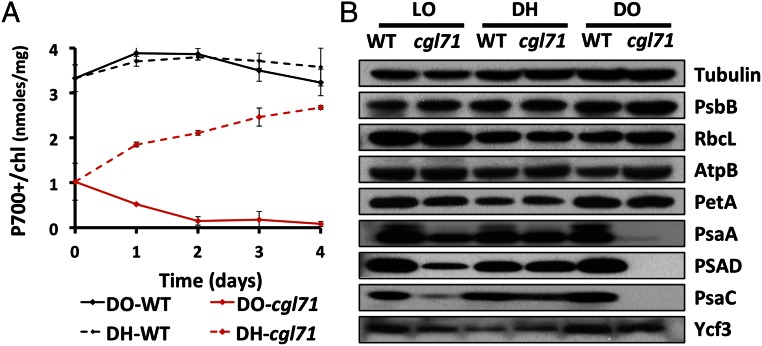
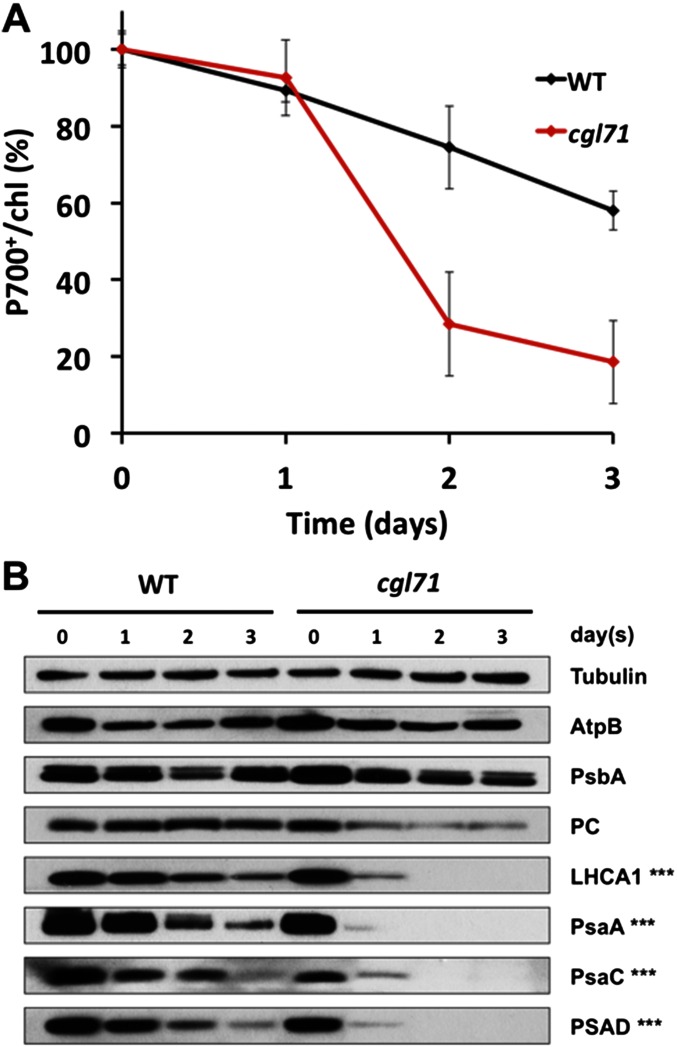
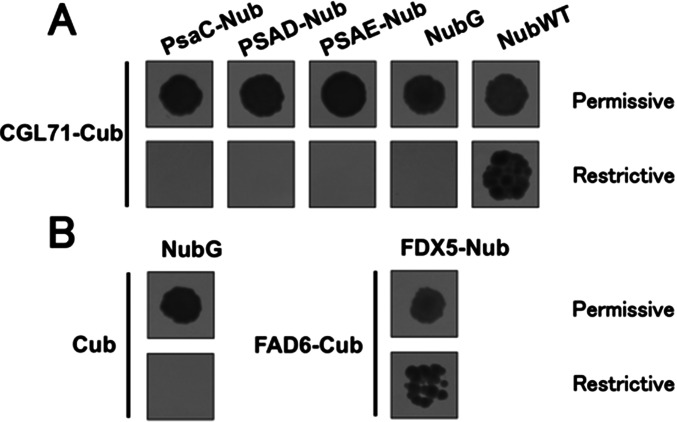
A Chlamydomonas reinhardtii mutant lacking CGL71, a thylakoid membrane protein previously shown to be involved in photosystem I (PSI) accumulation, exhibited photosensitivity and highly reduced abundance of PSI under photoheterotrophic conditions. Remarkably, the PSI content of this mutant declined to nearly undetectable levels under dark, oxic conditions, demonstrating that reduced PSI accumulation in the mutant is not strictly the result of photodamage. Furthermore, PSI returns to nearly wild-type levels when the O2 concentration in the medium is lowered. Overall, our results suggest that the accumulation of PSI in the mutant correlates with the redox state of the stroma rather than photodamage and that CGL71 functions under atmospheric O2 conditions to allow stable assembly of PSI. These findings may reflect the history of the Earth's atmosphere as it transitioned from anoxic to highly oxic (1-2 billion years ago), a change that required organisms to evolve mechanisms to assist in the assembly and stability of proteins or complexes with O2-sensitive cofactors.

Keywords: GreenCut; oxidative disruption; photosynthesis; photosystem I biogenesis.


Conflict of interest statement

The authors declare no conflict of interest.

Figures

Fig. 1.
Fig. 1.
Growth and O2 evolution of the cgl71 mutant. (A) WT, cgl71, and cgl71(CGL71) rescued cells were grown at 30 µmol photons⋅m−2⋅s−1 (µE) in liquid TAP medium and then were washed and spotted onto solid TAP medium and allowed to grow for 5 d at various light intensities, as indicated at the top of the image. (B) Rate of O2 evolution of WT and cgl71 mutant cells after growth at 30 µE. Cells were pelleted by centrifugation (3,200 × g) for 10 min, resuspended in 50 mM Hepes (pH 7.5) containing 5 mM NaHCO3, and shaken in the dark for 30 min. During the assay, samples were illuminated at increasing light intensities, as indicated on the x axis, for 2 min each, followed by a 2-min dark incubation. The rate of O2 evolution at each light intensity was corrected for the rate of dark respiration. Each point represents the mean of three biological replicates.
Fig. S1.
Fig. S1.
The cgl71 mutant and its inability to grow photoautotrophically. (A) A diagram of the CGL71 gene showing the position of the inserted ble marker gene. Exons are shown as gray boxes, introns as black lines, and 5′ and 3′ UTRs as black boxes. The ble gene is inserted into the first exon in the same orientation as the CGL71 gene. (B) WT, cgl71, and cgl71(CGL71) rescued cells were grown at 30 µmol photons⋅m−2⋅s−1 (μE) in liquid TAP medium and then were washed and spotted onto solid minimal medium and maintained in the light (30 µmol photons⋅m−2⋅s−1 for 10 d). (C) Alignment of hypothetical truncated CGL71 generated by insertion of the ble gene into CGL71. The truncated CGL71 protein (cgl71) would be 64 amino acids long; the end of the protein is indicated by an asterisk. The first 21 amino acids of the CGL71 protein in the disrupted strain match WT CGL71, but then the reading frame continues along the inserted sequence (amino acids 22–64 of the non-CGL71 sequence) until it encounters a stop at codon 65.
Fig. 2.
Fig. 2.
Decreased PSII quantum yield and reduced levels of PSI polypeptides in the cgl71 mutant. (A) Quantum yield of PSII based on the fluorescence parameter ΦPSII, which is (Fm′ − Fs)/Fm′, in WT, cgl71, and the cgl71(CGL71) rescued strains. Cells used for the analyses were in exponential growth phase under LO conditions. For measurements, samples were exposed to 1 min of actinic light at the intensities indicated on the x axis. All values on the y axis are averages of three separate measurements (biological replicates). (B) Chlamydomonas proteins from WT, cgl71, and the cgl71(CGL71) rescued strain were resolved by SDS/PAGE on a 15% polyacrylamide gel and detected immunologically. Antibodies used for the analysis were to the polypeptides indicated at the right side of the figure. One microgram of chl was loaded for each sample analyzed. The boxed area highlights the subunit polypeptides of PSI. See Materials and Methods for more details. AtpB, β subunit of ATP synthase; LHCA1, light-harvesting polypeptides of PSI; LHCB2, light-harvesting polypeptide of PSII; PetA, cytochrome f; PsaA, PsaC, PSAD, and PSAH, polypeptide subunits of PSI; PsbB, chlorophyll protein of PSII; RbcL, large subunit of ribulose 1,5 bisphosphate carboxylase; Ycf3 and Ycf4, assembly factors associated with PSI.
Fig. S2.
Fig. S2.
Analysis of two tetrads (WT crossed to cgl71) for Zeocin resistance (ble) and growth on HS and TAP medium. (A) The cells were spotted on agar plates and grown for 10 d at 30 µmol photons⋅m−2⋅s−1. The Zeocin-supplemented medium contained 5 μg/mL Zeocin. Strains 1–4, progeny from tetrad #1; strains 5–8, progeny from tetrad #2; strain 9, WT; strain 10, cgl71; lane 11, H2O control (no template) only for BD. (B) PCR using RMD264/CGL71-R2 primers to detect the ble insertion. (C) PCR using CGL71-F2/CGL71-R2 primers to detect the intact CGL71 gene. (D) PCR using mating-type primers. The upper bands in D represent mating type minus, which is 600 bp. The lower bands in D represent mating type plus, which is 500 bp.
Fig. S3.
Fig. S3.
Oxidation and rereduction activities of cytochrome f of WT and cgl71 cells. Cells used for the analyses were grown under LO conditions. Absorbance differences were monitored at 554 nm with respect to a baseline drawn from absorbance changes at 546 and 573 nm during continuous illumination of cells with 156 μmol photons⋅m−2⋅s−1 for 5 s. A saturating pulse was administered immediately following the continuous light treatment, followed by a 2-s dark incubation. (The illumination period is indicated by a white box, the saturating pulse by an arrow, and the dark incubation period by a black box). WT and cgl71 samples were concentrated to 30 µg chl/mL. Values on the y axis decrease as a greater amount of cytochrome f is oxidized.
Fig. 3.
Fig. 3.
The cgl71 mutant is defective for active P700. (A) Oxidation and reduction characteristics of the cgl71 mutant. Cells used for analyses were grown under LO conditions. Absorbance differences were monitored at 705 nm during continuous illumination of cells with 156 µmol photons⋅m−2⋅s−1 for 5 s (white box), followed by a saturating light pulse (arrow) and a 2-s dark incubation (black box). WT and cgl71 samples were concentrated to 30 µg chl/mL. Values on the y axis decrease as a greater amount of P700 is oxidized. The PSII inhibitors DCMU and HA were included at concentrations of 10 μM and 1 mM, respectively, to block all electron flow from PSII. (B) Kinetics of P700+ rereduction following a saturating pulse as in A and normalized to total oxidizable P700. For all experiments, values on the y axis are the average of six measurements (technical replicates), which were essentially identical for all biological replicates. Error bars are not shown, but each data point shown in the figure does not deviate from any of the individual replicates (at least three for each data point) by more than 5% of the indicated value.
Fig. S4.
Fig. S4.
PSI-dependent O2 consumption rate. Samples were harvested during exponential growth under LO conditions, washed, and broken by sonification, and the membranes were resuspended in 50 mM Hepes-KOH (pH 7.5). Inhibitors of PSII (10 μM DCMU and 1 mM HA), electron donors (10 mM ascorbic acid and 50 μM DCPIP), an electron acceptor (1 mM MV and 1 mM sodium azide to block catalase activity), and 1.5 mL of membrane samples containing ∼30 μg chl (∼120 and ∼40 nM P700+ for WT and cgl71 cells, respectively), were added to the assay mix in the oxygen electrode chamber, followed by incubation of the samples in the dark for ∼30 min. Samples were illuminated with either 200 or 5,000 μmol photons⋅m−2⋅s−1 for 2 min, and the last 30 s was used to determine the rate of O2 consumption. Values on the y axis are the average of three biological replicates. Error bars represent SDs. For more details concerning the sample preparation and the assay, see SI Materials and Methods, In Vitro PSI Activity.
Fig. S5.
Fig. S5.
The kinetics of P700+ reduction were measured by monitoring the light-induced absorbance after a laser flash. The lifetime of the P700+ signal in both the WT (A) and the cgl71 mutant (B) cells, indicated by arrows, showed a similar monophasic decay time (∼35 ms). The data points (blue) were fit to the models, and the deviation from the fit is shown in black at the top of each graph. This decay was shown previously to be caused by recombination of the FA/FB and P700+ charge-separated state (30). The signal indicates that FA/FB are the terminal PSI electron acceptors in both the WT and mutant cells. For more details concerning the sample preparation and the assay, see SI Materials and Methods, Purification of Thylakoid Membrane and SI Materials and Methods, PSI Charge Recombination Kinetics.
Fig. 4.
Fig. 4.
Changes in PSI during hypoxic growth. Strains were grown under LO conditions for 5 d before being moved to DO or DH conditions for 4 d beginning at day 0. (A) Level of oxidizable P700 relative to chl for WT and cgl71 cells maintained in DO and DH conditions. Points are average values from three saturating flashes. All traces were corrected for potentially interfering absorbance at 740 nm. The results shown represent the average of three biological replicates. (B) Immunological detection of specific thylakoid proteins from WT and cgl71 cells. Proteins extracted from cells containing 1 μg of chl were resolved by SDS/PAGE (15% polyacrylamide gel) and were detected immunologically using monospecific antibodies raised to the polypeptides indicated at the right of the figure. Growth conditions are given at the top of the immunoblot. All protein designations are as in Fig. 2.
Fig. S6.
Fig. S6.
PSI turnover under DO conditions (in the presence of chloramphenicol). Strains were grown under LO conditions. They then were treated with chloramphenicol (CAP) (final concentration, 250 μg/mL) and were moved to DO conditions for 3 d beginning on day 0. (A) Level of oxidizable P700 relative to chl for WT and cgl71 cells maintained in CAP-DO conditions (normalized to day 0). The results shown are the average of three biological replicates. (B) Immunological detection of specific thylakoid proteins from WT and cgl71 cells. Proteins extracted from cells containing 1 μg of chl were resolved by SDS/PAGE (15% polyacrylamide gel) and quantified by immunoblot analysis using monospecific antibodies raised to the polypeptides (indicated at the right of the figure). Times following movement of the cells to DO conditions are indicated at the top of the immunoblot. Triple asterisks indicate that three times more cgl71 sample (based on chl) than WT sample was resolved on the gel to achieve a roughly even load of PSI subunit polypeptides at day 0.
Fig. S7.
Fig. S7.
Mating-based split-ubiquitin system showing no protein–protein interactions of CGL71 and PSI subunits (PsaC, PSAD, and PSAE). (A) Yeast diploids containing two vectors (indicated above and at the left) were grown on both permissive (Upper) and restrictive (Lower) plates (see SI Materials and Methods, Mating-Based Split-Ubiquitin Assay). (B) The NubG (empty) vector combined with CGL71-Cub or Cub served as negative controls, and the NubWT vector combined with CGL71-Cub or FAD6-Cub vector combined with FDX5-Nub served as positive controls (51). Each interaction was confirmed by colony PCR. Three different colonies were picked for the assay, which showed similar results in the three colonies.

References

    1. Golbeck JH. Structure and function of photosystem I. Annu Rev Plant Physiol Plant Mol Biol. 1992;43:293–324.
    1. Chitnis PR. PHOTOSYSTEM I: Function and physiology. Annu Rev Plant Physiol Plant Mol Biol. 2001;52:593–626. - PubMed
    1. Shikanai T. Cyclic electron transport around photosystem I: Genetic approaches. Annu Rev Plant Biol. 2007;58:199–217. - PubMed
    1. Busch A, Hippler M. The structure and function of eukaryotic photosystem I. Biochim Biophys Acta. 2011;1807(8):864–877. - PubMed
    1. Kargul J, Janna Olmos JD, Krupnik T. Structure and function of photosystem I and its application in biomimetic solar-to-fuel systems. J Plant Physiol. 2012;169(16):1639–1653. - PubMed

Publication types

MeSH terms

LinkOut - more resources